Research Report DFE-RR066
Towards universal
early years provision:
analysis of take-up
by disadvantaged
families from recent
annual childcare
surveys
Svetlana Speight and Ruth Smith, with
Cathy Coshall
This research report was commissioned before the new UK Government took office on 11 May 2010. As a result the content may not reflect current Government policy
and may make reference to the Department for Children, Schools and Families (DCSF) which has now been replaced by the Department for Education (DFE).
Contents
Acknowledgements ...1
Executive summary ...2
Introduction ... 2
Receipt of the entitlement to free early years provision by children from different backgrounds... 2
Focus on families experiencing the highest level of multiple disadvantage – what distinguishes those who take-up early years provision from those who do not?... 3
Reasons for not using the entitlement to free early years provision ... 4
Hours of the entitlement to free early years provision used... 4
Conclusions ... 5
1 Introduction ...6
1.1Aims of the study ... 6
1.2Background ... 6
The policy background ... 6
The research background: overview ... 8
Outcome studies ... 9
Uptake studies ... 10
1.3About the data ... 11
The Childcare and Early Years Survey of Parents series ... 11
Defining early years provision ... 12
1.4Measuring disadvantage ... 12
1.5Interpreting results in the report... 14
Weights ... 14
Bases ... 14
Percentages ... 14
Statistical significance ... 14
Symbols in tables ... 14
2 Receipt of the entitlement to free early years provision by children from different backgrounds...15
2.1Introduction... 15
2.2Take-up of early years provision and child’s age ... 15
2.3Take-up of early years provision by other child characteristics ... 16
2.4Take-up of early years provision by characteristics of family and mother ... 18
2.5Take-up of early years provision by region and area characteristics ... 22
2.6Take-up of early years provision by level of multiple disadvantage experienced by the family ... 24
2.7Key characteristics associated with the take-up of early years provision... 25
2.8Summary ... 27
3 Focus on families experiencing the highest level of multiple disadvantage – what distinguishes those who take-up early years provision and those who do not? 29 3.1Introduction... 29
3.2Take-up of early years provision by child characteristics ... 29
3.3Take-up of early years provision by characteristics of family and mother ... 30
3.4Take-up of early years provision by region and area characteristics ... 33
3.5Key characteristics associated with the take-up of early years provision... 34
3.6Perceptions of local childcare and use of the entitlement to free early years provision ... 36
3.7Summary ... 38
4 Reasons for not using the entitlement to free early years provision ...40
4.1Introduction... 40
4.2Children not receiving early years provision... 40
Awareness of the entitlement to free early years provision... 40
Other reasons for not using early years provision... 41
4.3Children not receiving the entitlement to free early years provision ... 41
Data limitations... 41
Providers of early years provision attended by children... 42
Awareness of the entitlement to free early years provision... 42
Other reasons for not receiving the entitlement to free early years provision ... 42
4.4Summary ... 42
5 Hours of the entitlement to free early years provision used...44
5.1Introduction... 44
5.2Hours of the entitlement to free early years provision received by eligible 3 and 4 year old children ... 44
5.3Summary ... 46
6 Conclusions...47
References...49
Appendix A Additional tables ...53
Tables
Table 2.1 Receipt of the entitlement to free early years provision, by age of child... 15
Table 2.2 Providers of early years provision attended by 3 and 4 year olds, by age of child... 16
Table 2.3 Receipt of the entitlement to free early years provision, by whether child has a long-standing illness or disability ... 17
Table 2.4 Receipt of the entitlement to free early years provision, by whether child has special educational needs or other special needs... 17
Table 2.5 Receipt of the entitlement to free early years provision, by family type and work status... 18
Table 2.6 Receipt of the entitlement to free early years provision, by family income... 19
Table 2.7 Receipt of the entitlement to free early years provision, by whether main carer has full driving licence and access to a car, van or motorcycle... 19
Table 2.8 Receipt of the entitlement to free early years provision, by mother's highest academic qualifications... 20
Table 2.9 Receipt of the entitlement to free early years provision, by number of children aged 0-14 in the household20 Table 2.10 Receipt of the entitlement to free early years provision, by mother's ethnicity... 21
Table 2.11 Receipt of the entitlement to free early years provision, by region and area urbanisation... 22
Table 2.12 Receipt of the entitlement to free early years provision, by area deprivation... 23
Table 2.13 Receipt of the entitlement to free early years provision, by level of multiple disadvantage experienced by family ... 24
Table 2.14 Providers of early years provision attended by 3 and 4 year olds, by level of multiple disadvantage experienced by family... 25
Table 2.15 Logistic regression model for receipt of early years provision... 26
Table 3.1 Receipt of the entitlement to free early years provision by children in disadvantaged families, by age of child 29 Table 3.2 Receipt of the entitlement to free early years provision by children in disadvantaged families, by sex of child 30 Table 3.3 Receipt of the entitlement to free early years provision by children in disadvantaged families, by family type 31 Table 3.4 Receipt of the entitlement to free early years provision by children in disadvantaged families, by mother's employment status... 31
Table 3.5 Receipt of the entitlement to free early years provision by children in disadvantaged families, by family income ... 32
Table 3.6 Receipt of the entitlement to free early years provision by children in disadvantaged families, by mother's highest academic qualifications... 32
Table 3.7 Receipt of the entitlement to free early years provision by children in disadvantaged families, by number of children aged 0-14 in the household... 33
Table 3.8 Receipt of the entitlement to free early years provision by children in disadvantaged families, by region and area urbanisation... 33
Table 3.9 Logistic regression model for receipt of early years provision by children in disadvantaged families... 35
Table 3.10 Receipt of the entitlement to free early years provision by children in disadvantaged families, by parents' erceptions of childcare availability... 36
p Table 3.11 Receipt of the entitlement to free early years provision by children in disadvantaged families, by parents' erceptions of childcare quality... 37
p Table 3.12 Receipt of the entitlement to free early years provision by children in disadvantaged families, by parents' perceptions of childcare affordability... 37
Table 3.13 Receipt of the entitlement to free early years provision by children in disadvantaged families, by level of information available about childcare... 38
Table 4.1 Awareness of the entitlement to free early years provision among parents not taking up early years provision, by multiple disadvantage... 40
Table 4.2 Reasons for not using early years provision, by multiple disadvantage... 41
Table 5.1 Number of free hours per week, by age of child... 44
Table 5.2 Number of free hours per week, by multiple disadvantage... 45
Table 5.3 Reasons for receiving fewer than 12.5 free hours, by multiple disadvantage... 46
Table A2.1 Receipt of the entitlement to free early years provision, by sex of child... 53
Table A2.2 Receipt of the entitlement to free early years provision, by mother's employment status... 53
Table A2.3 Receipt of the entitlement to free early years provision, by ethnicity of child... 53
Table A2.4 Receipt of the entitlement to free early years provision, by Government Office Region... 54
Table A3.1 Receipt of the entitlement to free early years provision by children in disadvantaged families, by whether child bility... 54
has a long-standing illness or disa Table A3.2 Receipt of the entitlement to free early years provision by children in disadvantaged families, by whether child ... 55
has special educational needs Table A3.3 Receipt of the entitlement to free early years provision by children in disadvantaged families, by whether main rcycle... 55
carer has full driving licence and access to a car, van or moto Table A3.4 Receipt of the entitlement to free early years provision by children in disadvantaged families, by area deprivation ... 55
[image:4.595.77.517.90.660.2]Acknowledgements
We are grateful to all parents who took part in the 2008 and 2009 surveys in the Childcare and Early Years Survey of Parents series for their time and sincere answers.
Executive summary
Introduction
The entitlement to free early years provision was first introduced by the Labour
Government in the National Childcare Strategy (DfEE 1998). The scope of the initiative gradually expanded over time, with particular emphasis on improving access for children from disadvantaged backgrounds (HM Treasury 2004a, HM Government 2009). By January 2010 almost all eligible 4 year olds (98%) and the vast majority of eligible 3 year olds (92%) in England were benefiting from the entitlement to free early years provision (DfE 2010) and survey data illustrates that this early years provision is provided through a variety of settings (Smith et al. 2010).
There is a lot of research evidence showing that receiving good quality early years education is associated with improved outcomes for children’s development, and is particularly beneficial for children from disadvantaged backgrounds (Feinstein et al. 2008, Hansen and Hawkes 2009, Leseman 2009, Melhuish 2004, Smith et al. 2009b, Sylva et al. 2004). There is also evidence showing that children from disadvantaged backgrounds (e.g. those from workless and low-income families) are less likely to attend early years education settings and thus to receive the benefits of it (Ghate and Hazell 2002, Speight
et al. 2010).
This study aims to analyse how the take-up of early years provision varies by different dimensions of disadvantage and the main barriers experienced by disadvantaged families. The data used is from the 2008 and 2009 surveys in the Childcare and Early Years
Survey of Parents series, which were carried out by the National Centre for Social Research on behalf of the Department for Education.
As well as examining the role of different dimensions of disadvantage (such as
worklessness, absence of qualifications, low income, area deprivation, disability etc.) we construct a separate measure of multiple disadvantage and use it to distinguish between families experiencing the highest level of multiple disadvantage and those with lower levels or no disadvantage. This measure also allows us to focus on children from the most disadvantaged families and to see what distinguishes those of them who receive early years provision from those who do not.
Receipt of the entitlement to free early years provision by children from
different backgrounds
Overall, 92% of eligible 3 and 4 year olds received early years provision in 2008-2009. Four year olds were more likely to receive early years provision than three year olds, which is largely explained by the prominent role played by reception classes in providing early years provision for 4 year olds.
Children were receiving early years provision at a range of maintained and private providers including nursery classes (28%), reception classes (27%), playgroups/pre-schools (19%), day nurseries (18%) and nursery playgroups/pre-schools (15%).
access to a car had higher rates of take-up of early years provision than those without such access. However, once we controlled for income (as car ownership is correlated with income levels), the effect of access to a car became insignificant.
The take-up of early years provision was similar for boys and girls, and it did not vary by whether the child had a long-standing illness or disability or by whether they had special educational needs.
Compared with children whose mothers were White, children of Black African, Pakistani and Bangladeshi mothers were substantially less likely to receive early years provision. However, once the analysis controlled for differences in socio-demographic profile between families from different ethnic backgrounds, the effect of ethnicity on uptake of early years provision was no longer significant.
The take-up of early years provision was the lowest in London compared with other
regions of England. Children living in deprived areas were less likely to receive early years provision than those living in more affluent areas.
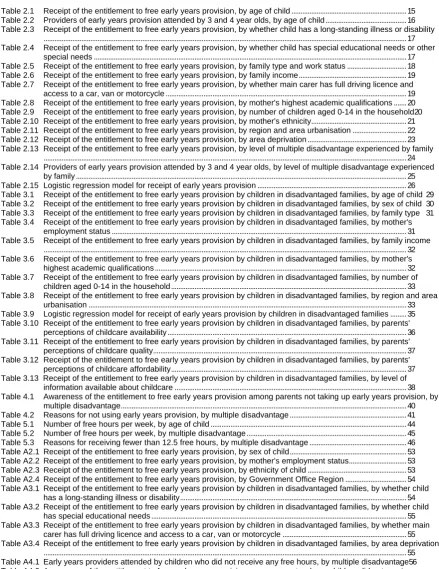
There was a strong association between the level of multiple disadvantage experienced by the family and their take-up of early years provision. In families experiencing no disadvantage only 3% of children were not attending any early years providers, whereas the proportion was higher for families experiencing some or a lot of disadvantage, with the highest figure (13%) found among the most disadvantaged families.
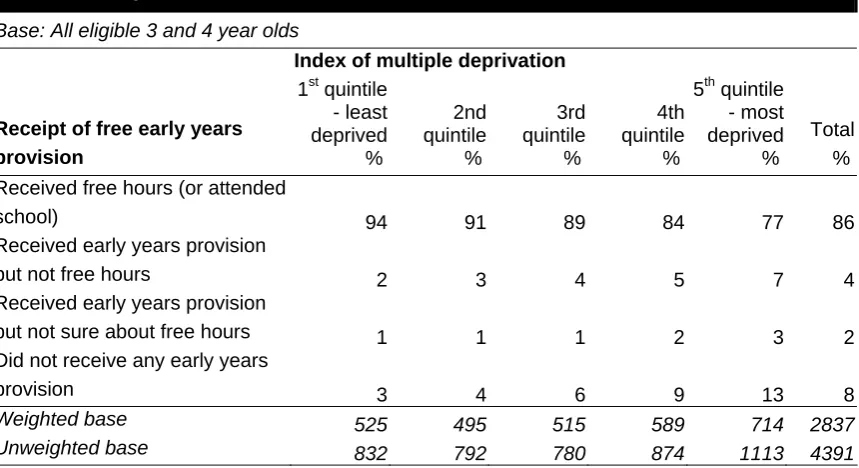
There were differences in the types of providers attended by children depending on the level of disadvantage experienced by their families. Children from the most disadvantaged families were more likely to receive early years provision at nursery classes and less likely to receive it at playgroups/pre-schools, day nurseries and childminders, whereas
attendance at reception classes and nursery schools did not vary by level of multiple disadvantage.
Focus on families experiencing the highest level of multiple disadvantage –
what distinguishes those who take-up early years provision from those who
do not?
Among children from families experiencing the highest level of multiple disadvantage (28% of children in the study), there were a number of socio-demographic differences between those who were receiving early years provision and those who were not.
There were large differences in the take-up of early years provision by child’s age: among disadvantaged 4 year olds only 5% were not receiving any early years provision, whereas the figure was 24% for 3 year olds. This age difference is greater than that seen for all families and highlights the role that the entitlement to free early years provision for disadvantaged 2 year olds could have to play in targeting disadvantaged families early and improving take-up of early years provision at age 3.
Children of lone parents and those whose mothers were in paid employment were more likely to receive early years provision, whereas those from larger and lower-income families were less likely to receive it. There was no association between the take-up of early years provision and family’s access to a car.
Girls from disadvantaged families were more likely to receive early years provision than boys, although when the analysis controlled for other socio-demographic characteristics, this difference was no longer statistically significant. There were no differences in the take-up of early years provision between children with and without a long-standing illness or disability and between children with and without special educational needs.
Children living in London were less likely to receive early years provision than children living outside of London. The level of deprivation in the area did not appear to make a difference to the take-up of early years provision by children from the most disadvantaged families.
We analysed whether parents’ negative perceptions of the availability of places at local providers of nursery education and childcare and of the quality of local provision were a barrier to their use of the entitlement to free early years provision. We found that this was not the case. Instead, it appears that lack of knowledge about local early years provision was a substantial barrier to taking it up.
Reasons for not using the entitlement to free early years provision
As discussed above, 8% of children aged 3 and 4 and eligible for the entitlement to free early years provision were not attending any early years providers. We found that parents of 38% of these children were not aware that the government paid for some hours of nursery education per week for children of this age. Low awareness of the scheme was a particular barrier for the highly disadvantaged families, as parents of 50% of children in these families were not aware of their entitlement, compared with parents of 26% of children in less or non-disadvantaged families.
Those parents who were aware of the entitlement to free early years provision were asked why they were not using it. Parents of 47% of children mentioned personal preferences, parents of 33% of children reported various constraining factors such as lack of places at local providers, and parents of 20% of children mentioned one-off circumstances such as being on holiday in the week the survey asked about. Parents from the most
disadvantaged families were much more likely to report constraining factors as their reasons for not using the provision than parents from less or non-disadvantaged families.
The surveys also showed that parents of 4% of 3 and 4 year old children reported that their children attended early years provision but were not receiving any free hours. This estimate appears to be somewhat inflated due to parents’ confusion over how the scheme works. The main reasons why some children received early years provision but not any free hours appeared to be low awareness of the entitlement to free early years provision and use of providers such as childminders who did not provide the entitlement to free early years provision. The prevalence of these reasons varied by level of multiple disadvantage experienced by the family. Low awareness of the entitlement to free early years provision was a particular barrier to take-up for the highly disadvantaged families, while use of childminders was a factor most pertinent to families experiencing no or little disadvantage.
Hours of the entitlement to free early years provision used
Those children who were receiving some free hours of early years provision (except those who received them through attending school) received an average (median) of 12.5 free hours per week (which corresponds with the level of provision in most areas in 2008-2009 when the surveys took place).
Children from families experiencing the highest level of multiple disadvantage were less likely to receive less than their full entitlement than children from less or
non-disadvantaged families (25%, compared with 35-39% respectively).
Reasons why some children received their entitlement to free early years provision for less than 12.5 hours per week did not vary by level of disadvantage experienced by the family. Parents of just under a half of those children (49%) reported various constraining factors, such as that they would have had to pay for more hours or that the setting had no extra sessions available. Parents of 36% of children mentioned their personal preferences not to send their child to an early years provider for more hours, and for parents of 13% of children it was due to one-off circumstances that their child received fewer than 12.5 free hours in the week the survey asked about.
Conclusions
Our analysis revealed large differences in the take-up of early years provision by children from different backgrounds, with those from disadvantaged families being much less likely to access early years provision than those from families in better circumstances. What were the main barriers to accessing early years provision experienced by disadvantaged families?
The findings of this study suggest that lack of awareness of the entitlement to free early years provision and a low level of information about local options for nursery education and childcare were important factors affecting take-up of early years provision by
disadvantaged families. In addition, the way the entitlement to free early years provision is delivered through a range of providers appeared to have an impact on its uptake by the disadvantaged families. Parents from disadvantaged families were more likely to mention lack of availability of places at local providers and other constraining factors than those from families in better circumstances. There is some evidence to suggest that some types of providers (e.g. nursery classes attached to schools) might be more easily accessible by disadvantaged families than others (e.g. day nurseries), which means that there may be fewer options open to disadvantaged families with regard to where to take-up the
1
Introduction
1.1
Aims of the study
There is a lot of research evidence showing that receiving good quality early years education is associated with improved outcomes for children’s development, and is particularly beneficial for children from disadvantaged backgrounds (Feinstein et al. 2008, Hansen and Hawkes 2009, Leseman 2009, Melhuish 2004, Smith et al. 2009b, Sylva et al. 2004). There is also evidence showing that children from disadvantaged backgrounds (e.g. those from workless and low-income families) are less likely to attend early years education settings and thus to receive the benefits of it (Ghate and Hazell 2002, Smith et al. 2010, Speight et al. 2010). There have been a number of policy strategies and
initiatives since the late 1990s aiming to change this situation and to enable more children, and disadvantaged children in particular, to participate in early years education (DfEE 1998, HM Treasury 2004a, HM Government 2009).
The present report reflects the Coalition Government’s commitment to continue work on identifying barriers to the uptake of early years provision among the most disadvantaged 3 and 4 year olds as an important means of reducing educational and socio-economic inequality (Gove 2010). The study uses data from the 2008 and 2009 surveys in the Childcare and Early Years Survey of Parents series and aims to provide analysis relating to the following questions:
• How does take-up of early years provision by 3 and 4 year olds who are eligible for the entitlement to free early years provision vary by different dimensions of disadvantage? • What are the main barriers to taking up early years provision experienced by children
from disadvantaged backgrounds?
• What is the level of awareness of the entitlement to free early years provision among those not taking it up? Is lack of awareness a particular barrier for disadvantaged families?
• Do families who take-up the entitlement to free early years provision use all of the hours available (i.e. 12.5 hours per school term week in most areas when the surveys were carried out)? Does the number of hours used – and the ability to use the whole entitlement – vary by level of disadvantage experienced by the family?
1.2
Background
The policy background
Despite its early beginnings with the 1816 founding by Robert Owen of a nursery school in Scotland, early education remained a low policy priority for central and local government until the late nineties of the twentieth century when the Labour Government introduced the entitlement to free early years provision for 3 and 4 year old children. Up to then, access to early education was unevenly distributed across the country, available primarily in disadvantaged areas (Penn 2009). Early education was delivered by qualified teachers in free standing state funded nursery schools or nursery classes attached to state primary schools and in a small number of private nursery schools and classes.
The implementation of the entitlement to free early years provision for 3 and 4 year olds was completed by 2004 (NAO 2004) and is now being rolled out as originally planned to more than 20,000 targeted 2 year old children after a pilot period (Smith et al. 2009b). The Ten Year Strategy for Childcare (HM Treasury 2004a) reviewed the achievements of the National Childcare Strategy and outlined the way forward for early years provision from age two, underpinned by research findings on its long-term educational and social
benefits for children. The Strategy also alluded to evidence, presented as part of the Child Poverty Review (HM Treasury 2004b) of the potential of good quality early years provision to counter the impact of poverty on young children’s development. These messages were reinforced in the next childcare strategy review (HM Government 2009).
Initially, 3 and 4 year old children whose parents wanted a place for them, had been entitled to 12.5 hours of free early years provision for 33 weeks of the year, but in 2006 this entitlement was extended to cover 38 weeks of the year. A further increase to 15 hours per week delivered flexibly, was piloted by 34 pathfinder authorities between 2007 and 2009 (Clarke et al. 2009). The Coalition Government has confirmed that this
entitlement will be rolled out nationally from September 2010 as originally planned (Gove 2010).
The entitlement to free early years provision is funded by the Nursery Education Grant and can be provided not only in state nursery schools and classes, but also in private-for-profit and not-for-private-for-profit childcare businesses and indeed by childminders forming part of a childminding network associated with a Children’s Centre. The National Childcare
Strategy proposed this integration of early education within childcare provision, since no sensible distinction could be made between early education and childcare (NAO 2004). Subsequently the legal distinction between childcare and nursery education for young children aged 0-5 was removed altogether in the Childcare Act 2006. The term ‘early years provision’ has come to describe the provision of integrated early learning, development and care for young children as set out in Section 18 of the Act.
Since 2001 all providers must meet Ofsted registration requirements, which include the delivery of the Early Years Foundation Stage, a curricular and regulatory framework governing provision for children aged 0 to 6 years of age. Introduced in the 2006 Childcare Act, this was implemented nationally from September 2008. The Early Years Foundation Stage extends to the end of the school year in which children reach their fifth birthday and is followed by Key Stage 1 of the National Curriculum. This programme replaced the Foundation Stage Curriculum for children aged 3 to the end of reception year of primary school, the Birth to Three Matters framework, and the National Standards for Under 8s Daycare and Childminding which applied previously (DCSF 2008).
In England 92% of all 3 year olds and 98% of all 4 year olds now benefit from the entitlement to free early years provision (DfE 2010). The two most recent surveys in the Childcare and Early Years Survey of Parents series (Kazimirski et al. 2008, Speight et al. 2009), whose data have been analysed for the present study, highlight the extent to which early learning and childcare provision in England is being taken up by children from families experiencing disadvantage. Like their predecessors in this time series
commissioned by the Government, they identified a steady increase in the use of formal childcare since the introduction of the National Childcare Strategy. However, a continuing concern articulated in the 2007 survey is:
…the concentration of ‘non-users’ of childcare in the lowest income groups, given that a key focus of the Ten Year Childcare Strategy is increasing the use of formal care amongst disadvantaged families, with the ultimate aim of facilitating parents’ move into work and hence alleviating poverty.
Throughout the last decade, early years policy has emphasized the importance of reaching disadvantaged children with the entitlement to free early years provision (HM Government 2009), since its impact on their development is likely to be profound and long-lasting (Melhuish 2004; Leseman 2009).
The importance of early education as part of early years provision was reinforced in the Government’s Every Child Matters programme which aims to provide all children with the support they need to meet the five key objectives of being healthy, staying safe, enjoying and achieving, making a positive contribution, and achieving economic well-being. Research confirms a negative association between disadvantage and a range of Every Child Matters outcomes for children and the cumulative effect of multiple disadvantage (Cabinet Office 2007; Oroyemi et al. 2009).
The present report reflects the Coalition Government‘s commitment to identifying the continuing barriers to the uptake of early years provision among the most disadvantaged 3 and 4 year olds as an important means towards eliminating educational and
socio-economic inequality.
The research background: overview
The research evidence for the positive outcomes of good quality early education and childcare provision for children’s educational development and future economic and social wellbeing is compelling. It is usefully summarised in the latest review of the National Childcare Strategy (HM Government 2009). Among influential British research informing the early years policy emphasis on disadvantaged children are studies by Leon Feinstein and colleagues from the Centre for Longitudinal Studies at London University’s Institute of Education. An analysis of cognitive development among British children in the 1970 Birth Cohort Survey revealed that if at the age of 22 months children from disadvantaged backgrounds were already showing a cognitive deficit this would still be apparent at age 26. Even more striking was the finding that:
The children of educated or wealthy parents who scored poorly in the early tests had a tendency to catch up, whereas children of worse-off parents who scored poorly were extremely unlikely to catch up and are shown to be an at-risk group. There is no evidence that entry into schooling reverses this pattern.
(Feinstein 2003: 73)
While Feinstein did not draw any conclusions in this paper about the potential impact of early education, he did note strong evidence suggesting that programmes targeting resources directly at children were more successful than so-called two-generation programmes targeting children and their parents. Other studies by Feinstein and others focusing more explicitly on the role of early education in lessening the risk of lasting educational disadvantage also informed early years policy (Feinstein et al. 2008).
Interestingly, the most recent data from the Millennium Cohort Study (MCS) complement Feinstein’s basic finding: 3 year old MCS children from disadvantaged backgrounds who performed well intellectually at that point, are lagging behind by the time they reach age 5, as do children from average socio-economic backgrounds. In contrast, peers from higher socio-economic backgrounds who were not performing well intellectually at age 3 are not only catching up by this age, but even outperforming the other two groups (Blanden and Machin 2010: 163). Since other MCS findings confirm that disadvantaged children tended to receive better quality early education in group care settings (Robert et al. 2010) these findings point towards the crucial role of a comprehensive package of measures to address early inequality and disadvantage alongside high quality early education.
under the Childcare Act 2006. This duty links to others forming part of the Every Child Matters agenda codified in the Children Act 2004. In recent years the body of pertinent, well-designed and large-scale UK studies informing the Coalition Government’s early years policy has grown considerably. These studies now occupy the place once taken by studies of early childhood interventions from the USA, which have become less pertinent over time (Penn et al. 2006).
Outcome studies
In a review for the National Audit Office of international childcare research, Melhuish (2004) found consistent evidence that the more disadvantaged children aged 3 to 5 stood most to gain socially and educationally from good quality early years education. However, low income families, particularly Black and minority ethnic (BME) families, were more likely to access segregated and lower quality provision. Though findings were mostly from USA studies, only those from cost-benefit analyses of interventions with disadvantaged families could not be generalised to the UK. Socially mixed early years groups had a greater developmental effect than those targeted primarily at disadvantaged children. Leseman (2009) recently conducted a literature review of this area for the European Commission. He listed the numerous quality factors determining whether lasting positive effects would occur.
While most international studies of early childhood provision explored different types, sometimes integrated, of childcare, early education and family support provision for children from 0 to 6 years of age, some studies do allow the identification of the effects of early education for English 3 to 5 year olds per se.
Among British outcome studies, the Effective Provision of Pre-school Education (EPPE) longitudinal study proved a major source of evidence that the positive impact of 3 to 7 year old children’s early educational experience has been making itself felt in their educational performance at entry to school and at the end of Key Stage 1 of the National Curriculum (Sylva et al. 2004). This five year study was commissioned in 1997 to provide an ‘evidence base’ for early years policy decisions, but data collection for this study preceded many of the interventions and policies introduced since 1998.
Some 3000 children in 141 different early years settings in regions covering 36 local authorities took part in the study which not only explored their social and intellectual development, but also the impact of their home background and earlier childcare experience before age 3. Among the sample of regions included in the study, were socially disadvantaged and ethnically diverse ones. The effectiveness of different early years settings was compared, as well as the key aspects differentiating between them. A comparison group was included of ‘home’ children who had never attended a pre-school setting before school entry.
Though all EPPE findings are relevant to the present analysis, it is impossible to do justice to them all in this section; therefore only a few are summarised here. Apart from
demonstrating the impact of quality early years experience on educational performance at Key Stage 1, the age of starting and the type of setting also mattered. Starting after age 2 and before age 3 had a beneficial effect on children’s intellectual development. The most effective settings in promoting children’s intellectual and social development were
maintained nursery schools, nursery classes and – mostly publicly funded – centres integrating early education and childcare, whereas local authority day nurseries were the least effective. The effect of high quality early education and childcare persisted into the early primary years. Gender was a significant factor in intellectual attainment, with girls doing better than boys, while the effect of ethnicity was primarily mediated by language.
Needs (EYTSEN) project, a sub study within the EPPE project, aimed to identify children ‘at risk’ of developing Special Educational Needs when at primary school. At the time the research took place, children with disabilities and serious medical conditions were more likely to be found in segregated provision, so they were not included in this sample. The EYTSEN study explored the relationship between this risk, other background factors and the nature of the early years setting attended. According to the researchers:
As SEN is such a contentious issue the research chose to adopt a means of identification highlighting those children ‘at risk’ of developing SEN given their characteristics during pre-school. This ‘at risk’ status is more appropriate for very young children than diagnosed SEN, which rarely occurs for children during pre-school.
(Sylva et al. 2004: 46)
Important findings included that children from the ‘home’ group were more likely to be identified with SEN at school than children who had received early years education and that nursery schools and integrated centres were most likely to help children overcome their ‘risk’ status on a range of measures, especially cognitive ones. Research on the impact of early years education on children with disabilities or special needs has since lagged behind (Newman et al. 2009, Springate et al. 2008). However, several evaluations have been published of initiatives such as Aiming High for Disabled Children (HM
Treasury and DfES 2007) addressing the wider needs of these young children and their families in the early years (University of Manchester 2006, Jessiman et al. 2010). Uptake figures for this group remain unreliable, as at local authority level it is hard to establish percentages (Mooney et al. 2008). At national level the General Household Surveys estimate the incidence of children with a disability to be around 7% (Oppenheim 2007).
Recently, the EPPE findings on the superior impact of state funded provision on all children’s cognitive development have been reinforced by those of the Millennium Cohort Study. The state funded early years settings attended by this cohort’s children displayed the highest quality across the board, particularly where learning outcomes were
concerned (Mathers et al. 2007).
Uptake studies
Certain studies have focused more on the extent of uptake of early years provision in relation to parental education, socio-economic status and other background variables, as well as parental attitudes to such provision. For instance, Speight at al. (2010) found that children from families experiencing multiple disadvantage were much less likely to receive early years provision than those from families in better circumstances. In another UK study, although the poorest parents appeared keen on childcare for their children for social and educational, rather than primarily economic reasons, they often failed to access it (Ghate and Hazell 2002). Fortunately, the time series of surveys funded by the
Department for Education and conducted by the National Centre for Social Research (NatCen) confirm that the entitlement to free early years provision for this age group has proved increasingly popular with parents since its universal introduction and its uptake has increased in parallel (Butt et al. 2007).
Where barriers to the uptake of early year provision remained, these have been explored in a variety of qualitative studies, which will be referred to where relevant throughout this report. Roberts (2008) explicitly addressed the increase in take-up of the entitlement to free early years provision for 3 and 4 year old children as part of a small scale qualitative study that explored parents’ attitudes towards childcare, and the optimal language to use to talk about childcare. This study focused specifically on parents earning less than £20,000 annually, particularly among Bangladeshi and Pakistani parents.
Four main reasons were given by parents for why they welcomed the entitlement to free early years provision for 3 and 4 year old children, some of which relate to the age of the child and some of which relate to the availability of the entitlement to free early years provision through the maintained sector:
1. By the age of 3 children were perceived as able to express their feelings, wishes and experiences to parents and staff alike;
2. State nursery schools and classes were perceived as more trustworthy than private sector provision delivering both childcare and early education;
3. Cost was not an issue;
4. Children of this age were perceived as ready to enjoy play and social contact with peers (Roberts 2008).
In contrast, another DCSF commissioned project investigating how to promote the uptake of formal childcare among low income families did not distinguish between the take-up of the entitlement to free early years provision and other formal childcare (Andrew Irving Associates 2008). Hence its findings are less useful for the present report.
The issues surrounding the uptake of early education and childcare among BME families, who are overrepresented among disadvantaged families, has been more widely
researched. Even though they identified increasing use of early education and childcare among BME communities, two reports using data from the Childcare series carried out by NatCen (Bell et al. 2005, Kazimirski et al. 2006) concluded that early years policies needed to focus more on their specific needs and circumstances. An overview report of effective engagement with ethnic minority communities in wider children’s and parenting services not only came to a similar conclusion, but also reiterated the point that these needs differ substantially between communities (Page et al. 2007).
Finally, social class, too, has been proposed as an important factor influencing
preferences and attitudes relating to early education and childcare (Vincent et al. 2008). Vincent’s studies of working and middle class use of childcare in two London boroughs demonstrated heavy social segregation in provision and uptake, reflecting divergent parental attitudes within ‘local childcare cultures.’ The findings on the complex interplay between factors affecting parental childcare choices in these small-scale qualitative studies appeared to correspond to those in an analysis of the Family and Children Study data (D’Souza et al. 2008).
1.3
About the data
The Childcare and Early Years Survey of Parents series
The study uses data from the 2008 and 2009 surveys in the Childcare and Early Years Survey of Parents series. This series originated in two separate surveys (Stratford et al. 1997, La Valle et al. 2000), and has been carried out periodically by the National Centre for Social Research since 2004. The sample for the surveys is randomly selected from Child Benefit records, which, given its almost universal take-up, provide a comprehensive sampling frame for families with dependent children.
Just under 7,100 parents in England with children under 15 were interviewed for the survey in 2008 and just over 6,700 in 2009.1 Each parent was asked basic information about all children they had living with them (e.g. type of childcare they received), and then more detailed information about one randomly selected child (if there were two or more children in the household).
1
For the present study, we use data only on children aged 3 and 4 who were eligible for the entitlement to free early years provision.2 This decreased the size of the sample available for the analysis. However, for most of the analysis, we were able to use information about
all children in the families surveyed (and not just the ‘selected child’). In total, we were able to analyse data on just under 4,400 children. For the parts of the report that focus on highly disadvantaged families, we used a sub-set of this sample (28%), which was just over 1,300 children.
While the overall response to the surveys was relatively high (Speight et al. 2009, Smith et al. 2010), it is possible that families experiencing the highest levels of poverty and social exclusion were slightly underrepresented among those who completed the survey, as they are often missed in social surveys. These might be found among some ethnic minority groups (especially where parents did not speak English and there was no one available to translate for them), homeless families, mobile populations such as Travellers, and those on very low incomes (Levitas et al. 2007). Apart from the issue of non-response, it is also possible that some of these families were not receiving Child Benefit and therefore were not part of the sampling frame from which the survey samples were drawn.
Defining early years provision
The surveys in the series ask parents about their use of childcare and early years
education over the last year and during a reference term-time week (usually the last week before the interview). For this study, we use information about the reference term-time week only.
Parents are asked whether their children attended any of the providers of childcare and early years education listed on a show card. The early years providers listed included:
• Nursery school
• Nursery class attached to a primary or infants’ school • Day nursery
• Reception class
• Special day nursery or school or unit for children with special educational needs • Playgroup / pre-school
• Childminder
• Other nursery education provider.
Where the child attended any of the types of providers listed above, they were considered to be in receipt of early years provision.
It is worth noting that the surveys classify providers according to the service for which they were being used, e.g. daycare or early years education. Thus, we use – and classify according to – terminology such as ‘nursery schools’ and ‘day nurseries’, rather than include forms of integrated provision such as Children’s Centres. (For more information on these types of settings, see Appendix B.) Checks on respondents’ classifications of the childcare providers they used – via a telephone interview with the providers themselves – were an integral part of the survey process and improved the accuracy of the
classifications.
1.4
Measuring disadvantage
Experience of disadvantage can cover a broad range of concepts, which have been explored in a large body of research (Oroyemi et al. 2009, Cabinet Office 2007, Barnes et
2
al. 2008, Brooks-Gunn et al. 1997). Furthermore, Government initiatives that tackle disadvantage often leave the precise nature of the target groups up to individual Local Authorities. For instance, the autonomy provided to Local Authorities in the Early Education Pilot for Two Year Old Children meant that eligibility for the pilot was
determined by many different geographic and economic indicators of disadvantage (Smith
et al. 2009b).
For this study, we constructed an index of multiple disadvantage in the same way as in Speight et al. (2010). It incorporates the following risk factors:
1. Lone parent families
2. Non-working families (no parents in paid employment)
3. Families with an annual household income of under £20,000 (or, for families where income is unknown, being in receipt of Job Seeker’s Allowance, Income Support, Housing Benefit or Council Tax Benefit)
4. Families including three or more children aged 0-143
5. Families living in one of the 20% most disadvantaged areas of the country (as defined by the Index of Multiple Deprivation)
6. Families where all parents have no or low qualifications (no GCSE/ O Levels at grade A-C)
7. Families where at least one parent has a long-standing illness or disability 8. Families living in rented accommodation (as a proxy for social housing)
9. Families where at least one child in the household has a special educational need or long-standing illness or disability.
While it is clear that in many cases the factors above do not necessarily indicate that a family is disadvantaged, it is likely that an accumulation of such factors would indicate disadvantage. As such, the analysis in this report uses a sum of these factors as an indicator of families’ level of disadvantage. To create the sum, each factor was given a score of one, which means that the indicator ranges from 0-9. Since a variable with 10 categories was not a very useful analytical tool, the categories were combined in the following two ways:
1) Four levels of multiple disadvantage:
• No factors of disadvantage (28% of children in the study), • 1 factor of disadvantage (21%)
• 2-3 factors of disadvantage (22%)
• High level: 4-9 factors of disadvantage (28%).
2) Two levels of multiple disadvantage:
• No/low level: 0-3 factors of disadvantage • High level: 4-9 factors of disadvantage
Analysis in Chapter 3 focuses on families experiencing a high level of multiple
disadvantage (4-9 risk factors).4 In other chapters, either the first or the second variable was used as a break variable depending on the number of cases available for the analysis.
3
Since this report uses non-equivalised income, number of children has been included to capture the need for household income to spread further in larger families.
4
1.5
Interpreting results in the report
Weights
In most of the analysis, a ‘family-level’ weight was applied to the data, which ensures that the research findings are representative of 3 and 4 year old children in England who were eligible for the entitlement to free early years provision in 2008-2009. Where the analysis was limited to ‘selected children’ only (i.e. one child per household chosen randomly during the survey) – because particular survey questions were asked about the ‘selected child’ only and not about any other children in the family – a ‘child-level’ weight was applied to the data. The child-level weight combines the family-level weight with an adjustment for the probability of the child being selected for the additional questions. Full details of the weighting are provided in the main reports on the 2008 and 2009 surveys in the Childcare and Early Years Survey of Parents series (Speight et al. 2009, Smith et al. 2010).
Bases
The tables in this report contain the total number of cases in the whole sample (i.e. all eligible 3 and 4 year olds) or the number of cases in the particular sub-group being analysed (e.g. all eligible 3 and 4 year olds in families experiencing the highest level of multiple disadvantage). The total base figure includes all the eligible cases (i.e. all respondents or all respondents who were asked a particular question) minus cases with missing data (coded ‘don’t know’ or ‘not answered’). Thus, while the base description may be the same across several tables (e.g. all eligible 3 and 4 year olds), the base sizes may differ slightly due to the exclusion of those coded ‘don’t know’ or ‘not answered’.5
Percentages
Due to rounding, percentage figures may not add up to exactly 100%. Furthermore, where the information in tables is based on multi-coded questions (that is, respondents were allowed to give more than one response), the percentages in the table could add up to more than 100%.
Statistical significance
Throughout the report, whenever the text comments on differences between sub-groups of the sample, these differences have been tested for statistical significance using the survey commands in SPSS 15.0 or STATA 10.0, and found to be significant at the 95% confidence level or above. In the regression analysis limited to families experiencing the highest level of multiple disadvantage, differences between sub-groups are also
commented on if they are significant at the 90% confidence level only (as there were only 1309 cases used for that analysis).
Symbols in tables
The symbols below have been used in the tables and they denote the following:
[ ] percentage based on fewer than 50 respondents (unweighted) + percentage value of less than 0.5
0 percentage value of zero.
5
2
Receipt of the entitlement to free early years provision by
children from different backgrounds
2.1
Introduction
This chapter examines take-up of the entitlement to free early years provision by families with eligible 3 and 4 year old children.6 The data used are from two surveys (2008 and 2009) in the Childcare and Early Years Survey of Parents series and are for all children of eligible age in the families surveyed.
We explore whether take-up of the entitlement to free early years provision varies for children with different socio-demographic characteristics, and whether there are
associations between take-up, and characteristics of children’s families (and of mothers in particular) and of the areas where they live.
2.2
Take-up of early years provision and child’s age
Table 2.1 shows proportions of children aged 3 and 4 who were receiving early years provision and the entitlement to free early years provision in particular. The figures are based on whether the parent reported that their child received any early years provision, as well as a separate question specifically about whether they received any ‘free hours’ of early years provision. 7
Table 2.1 Receipt of the entitlement to free early years provision, by age of child
Base: All eligible 3 and 4 year olds
Age of child
3 years 4 years Total
Receipt of free early years provision % % %
Received free hours (or attended school) 77 94 86
Received early years provision but not free hours 7 2 4
Received early years provision but not sure about free hours 3 1 2
Did not receive any early years provision 13 3 8
Weighted base 1272 1565 2837
Unweighted base 1929 2462 4391
Overall, 92% of children eligible for the entitlement to free early years provision received some form of early years provision (i.e. some free hours; some early years provision but not any free hours; or some early years provision with uncertainty about free hours).8 The take-up varied by child’s age, being substantially higher for 4 year olds (97%) than for 3
6
Children are eligible for the entitlement to free early years provision from 1 April, 1 September or 1 January following their 3rd birthday, and are entitled to up to six terms of provision before reaching statutory school age, which is the first term following their 5th birthday. However, even though it is not compulsory for children to attend school until the first term following their 5th birthday, more than half of 4 year olds attend school full- or part-time (usually, a reception class). The base for the figures on the entitlement to free early years provision is all children who are eligible. To ensure that take-up of the entitlement to free early years provision does not appear artificially low, children attending school are included here in the proportion of children receiving their entitlement (even though parents of children who attended reception class only were not asked the question about free hours).
7
Early years provision is defined as: nursery school, nursery class, day nursery, reception class, special day school/nursery, playgroup, childminder and other nursery education provider. For more details about these types of providers, see section 1.3 and Appendix B.
8
The figures in are somewhat lower than the official statistics for January 2010 that 92% of 3 year olds and 98% of 4 year olds were receiving the entitlement to free early years provision (DfE 2010). It is likely that this is due to the survey being about a reference term-time week when some children might not have received their entitlement due to one-off circumstances such as being away on holiday, or being ill.
year olds (87%). As shown later in this chapter, this difference by age was in large part due to the role of reception classes in providing early years provision for 4 year olds.
With regard to the entitlement to free early years provision in particular, 77% of 3 year olds and 94% of 4 year olds were receiving their entitlement (or attending primary school), according to parents’ reports. Parents of 7% of 3 year olds and of 2% of 4 year olds said their children were receiving early years provision but not any free hours. In Chapter 4, we discuss our concerns around the survey estimates of how many children were receiving early years provision but not any free hours, as there is evidence suggesting that a substantial proportion of parents may have underreported their receipt of the entitlement to free early years provision.
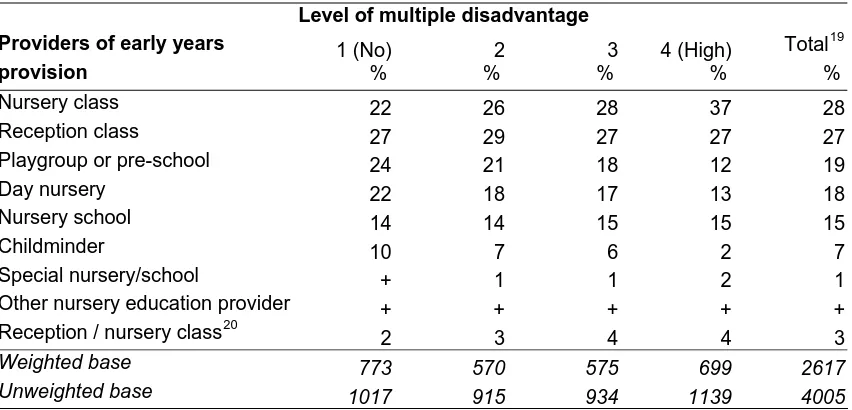
[image:20.595.83.512.375.585.2]Table 2.2 shows at which providers children received early years provision (regardless of whether they received any free hours there or not). Overall, children were receiving early years provision at a relatively wide range of providers, including nursery classes (28%), reception classes (27%), playgroups/pre-schools (19%), day nurseries (18%) and nursery schools (15%). However, for 4 year olds there was less variety of providers as about half of them (47%) were in reception classes at school.9 Consequently, they were less likely than 3 year olds to attend playgroups, day nurseries and nursery schools.
Table 2.2 Providers of early years provision attended by 3 and 4 year olds, by age of child
Base: All eligible 3 and 4 year olds who received early years provision
Age of child
3 years 4 years Total10
Providers of early years provision
Nursery class 29 27 28
Reception class + 47 27
Playgroup or pre-school 30 10 19
Day nursery 26 12 18
Nursery school 18 12 15
Childminder 7 7 7
Special nursery/school 1 1 1
Other nursery education provider + + +
Reception / nursery class11 0 5 3
Weighted base 1104 1513 2617
Unweighted base 1631 2374 4005
2.3
Take-up of early years provision by other child characteristics
Apart from child’s age, we examined whether take-up of early years provision was associated with the following child characteristics: sex, whether they had a long-standing illness or disability, and whether they had special educational needs (SEN). The findings are discussed in this section.
With regard to child’s sex, the level of take-up of early years provision by boys and girls was the same (see Table A2.1 in Appendix A).
9
The true estimate of the percentage of 4 year olds attending reception classes is somewhat higher than 47%, as for 5% of 4 year olds we know that they were also attending school but do not know whether it was a reception or nursery class (see Table 2.2).
10
Total includes 1% of children who received early years provision but provider could not be classified.
11
Table 2.3 and Table 2.4 show how the take-up varied depending on whether the child had a long-standing illness or disability12 and on whether they had special educational
needs.13 The small differences apparent in the tables were not statistically significant.
Table 2.3 Receipt of the entitlement to free early years provision, by whether child has a long-standing illness or disability
Base: All eligible 3 and 4 year olds
Whether child has an illness or disability
Yes No Total
Receipt of free early years provision % % %
Received free hours (or attended school) 87 86 86
Received early years provision but not free hours 5 4 4
Received early years provision but not sure about free hours 2 2 2
Did not receive any early years provision 7 8 8
Weighted base 200 2633 2833
Unweighted base 306 4078 4384
Table 2.4 Receipt of the entitlement to free early years provision, by whether child has special educational needs or other special needs
Base: All eligible 3 and 4 year olds
Whether child has a SEN
Yes No Total
Receipt of free early years provision % % %
Received free hours (or attended school) 81 87 86
Received early years provision but not free hours 6 4 4
Received early years provision but not sure about free hours 2 2 2
Did not receive any early years provision 11 8 8
Weighted base 133 2699 2832
Unweighted base 213 4168 4381
In Chapter 1 we briefly discussed the extent of research on impact and uptake of early years provision by children with disabilities and/or special needs. Given what is known from research about the beneficial impact of early years provision on such children, the finding that there were only small and non-significant differences in uptake in our sample is reassuring. This finding may reflect the growing range of practice interventions aimed at reducing this difference (Oppenheim 2007). However, it could also indicate that the survey measurements of children’s disability and SEN status were not sensitive enough to
identify those whose condition had a considerable impact on their ability to take part in early years provision.
12
Overall, 7% of 3 and 4 year old children eligible for the entitlement to free early years provision were identified by their parents as having a long-standing illness or disability (table not shown). This figure is slightly higher than the numbers for English local authorities. These have been estimated at 3-5%, but use of
definitions and practice in identification has been found to be quite variable between local authorities (Mooney
et al. 2008).
13
2.4
Take-up of early years provision by characteristics of family and mother
In this section, we examine whether take-up of early years provision by eligible 3 and 4 year olds varied depending on their social background and, in particular, on socio-demographic characteristics of their mothers. [image:22.595.82.504.292.509.2]Table 2.5 shows proportions of children receiving early years provision in different types of families. While the take-up was similar for children in two-parent and lone-parent families, there were substantial differences depending on the parents’ work status. Children from families where both parents were in paid employment (or where the lone parent worked) were much more likely to receive early years provision than children from families where none of the parents worked or where there were two parents and only one of them worked.
Table 2.5 Receipt of the entitlement to free early years provision, by family type and work status
Base: All eligible 3 and 4 year olds
Couple families Lone parents
Both working
One working
Neither working
All couples
Working Not
working
All lone parents
Receipt of free early years
provision % % % % % % %
Received free hours (or
attended school) 92 84 76 88 88 78 81
Received early years
provision but not free hours 3 4 5 4 7 6 6
Received early years provision but not sure about
free hours 1 1 3 1 2 4 3
Did not receive any early
years provision 4 11 16 7 3 12 9
Weighted base 1167 816 151 2134 236 467 703
Unweighted base 1727 1367 271 3365 308 718 1026
A similar picture emerges if we examine the take-up by mother’s work status, with children of mothers who were not in paid employment being much less likely to receive early years provision than children of mothers who were working.14 At the same time, the number of hours mothers worked did not make a difference to whether the child received early years provision (see Table A2.2 in Appendix A).
There was a strong association between the level of family income and how likely 3 and 4 year olds were to receive early years provision. Among children from the highest income group (family annual income of £45,000 or more) only 4% were not receiving early years provision, whereas this was the case for 13% of children from the lowest income group (income under £10,000, see Table 2.6).
14
Table 2.6 Receipt of the entitlement to free early years provision, by family income
Base: All eligible 3 and 4 year olds
Family annual income
Under £10,000
£10,000-19,999
£20,000-29,999
£30,000-44,999
£45,000
or more Total
Receipt of free early years
provision % % % % % %
Received free hours (or attended
school) 77 78 89 90 92 86
Received early years provision
but not free hours 7 6 3 3 3 4
Received early years provision
but not sure about free hours 2 3 1 1 1 2
Did not receive any early years
provision 13 12 7 5 4 8
Weighted base 337 626 484 521 703 2671
Unweighted base 451 1029 794 814 1052 4140
[image:23.595.84.511.132.336.2]As transport difficulties could be a potential barrier to taking up the entitlement to free early years provision, we examined whether family’s access to a car was associated with children’s attendance at early years provision. Table 2.7 shows that indeed, children from families where the main carer (usually mother) did not have a full driving licence or did not have access to a car, van or motorcycle were less likely to receive early years provision than those whose parents had a car at their disposal. (At the same time, as access to a car is strongly correlated with family income, it is important to look at these factors in conjunction with each other, which we do later in this chapter when using regression modelling techniques.)
Table 2.7 Receipt of the entitlement to free early years provision, by whether main carer has full driving licence and access to a car, van or motorcycle
Base: All eligible 3 and 4 year olds
Whether main carer has full driving licence and access to a car, van or motorcycle
Has licence and access to a car
Has no licence or
no access to a car Total
Receipt of free early years provision % % %
Received free hours (or attended school) 90 78 86
Received early years provision but not free
hours 3 7 4
Received early years provision but not sure
about free hours 1 2 2
Did not receive any early years provision 6 13 8
Weighted base 1965 869 2833
Unweighted base 3042 1342 4384
Table 2.8 Receipt of the entitlement to free early years provision, by mother's highest academic qualifications
Base: All eligible 3 and 4 year olds
Mother's educational level
First degree and higher A-level and equivalent
GCSE grade A-C/GCE O-level passes and equivalent Lower academic qualifications No academic qualifications Total15
Receipt of free early years
provision % % % % % %
Received free hours (or
attended school) 93 89 87 81 76 86
Received early years
provision but not free hours 3 5 4 6 5 4
Received early years provision but not sure about
free hours 1 1 2 3 3 2
Did not receive any early
years provision 4 5 7 10 16 8
Weighted base 649 496 825 281 460 2791
Unweighted base 942 740 1287 462 774 4323
The number of children in the family was another characteristic that was strongly
associated with children’s receipt of the entitlement to free early years provision.16 While having one or two children did not make a difference to whether the family was using early years provision for their 3 and 4 year old (only 5-6% of children in these families were not receiving any early years provision), the situation was different for families with three or more children, who were all less likely to take-up early years provision. For families with five or more children, as many as 19% of eligible children were not attending any early years provision (see Table 2.9).
Table 2.9 Receipt of the entitlement to free early years provision, by number of children aged 0-14 in the household
Base: All eligible 3 and 4 year olds
Number of children in household
1 2 3 4 5+ Total
Receipt of free early years provision % % % % % %
Received free hours (or attended school) 87 88 85 78 76 86
Received early years provision but not
free hours 5 4 4 4 3 4
Received early years provision but not
sure about free hours 3 1 2 2 2 2
Did not receive any early years provision 5 6 10 16 19 8
Weighted base 672 1366 564 165 70 2837
Unweighted base 543 2003 1175 439 230 4390
15
Total includes mothers who reported ‘other’ academic qualifications.
16
[image:24.595.80.517.546.719.2]Maternal employment rates decline in line with the number of children, while larger families also tend to have lower educational levels, lower parental earnings and lower family income than other families. So it is possible that it is not the size of the family as such but their socio-demographic profile that is the major influence on whether they take-up early years provision. We explore this issue later in this chapter using logistic
regression analysis, which allows us to explore the effect of the size of the family on children’s receipt of early years provision controlling for any differences in work status, income, education etc. between families of different size.
Recent findings from the Millennium Cohort Study confirm the trend for large families to be less likely to use any form of early years provision (Roberts et al. 2010). Despite concern about low levels of uptake of early education and childcare among large families having been raised previously (Dickens et al. 2005), our data suggest these problems persist. Given the body of evidence for the beneficial impact of early education on disadvantaged children’s educational trajectories (Sylva et al. 2004) and the longer-term poverty reducing effects of education and training (Machin and McNally 2006), it is important that
appropriate strategies for addressing the issue continue to be developed.
[image:25.595.78.516.462.706.2]Next our analysis explored the role of ethnic background in whether children were receiv