Faculty of Engineering and Surveying
Quantifying the Reduction in Hydraulic
Conductivity of Disturbed Soil Columns as a
Function of the Salinity and Sodicity of Applied
Water
A dissertation submitted by
Mr. Leigh Hansen
In fulfillment of the requirements of
Bachelor of Agricultural Engineering
Abstract
In recent years there has been increased concern within Australia’s agricultural
industry regarding water availability and quality for irrigation. Prolonged droughts and dwindling water storages have put the nation’s water resources under increased
pressure. As a result, Australia’s coal seam gas industry has been investigating the
utility of coal seam gas (CSG) product water for irrigation. However, CSG
by-product water comprises of high sodicity and salinity concentrations which are
potentially harmful to crops and soil structure if used for irrigation.
The aim of this project was to investigate the physical and chemical characteristics
involved with the determination of the electrolyte thresholds in soils, and their
interrelationships, with regard to the effects of sodium. This project also investigated these characteristics and their significance to Australia’s Coal Seam Gas mining
industry, with the ultimate aim of determining the utility of CSG by-product water
for irrigation.
The methodology for determining the threshold electrolyte concentration (TEC) in
soils was found to be appropriate for identifying differences between soils. In the
present study, soils subjected to water with high sodium concentrations were
generally found to have a substantial reduction in hydraulic conductivity compared
to soils leached with calcium-dominated water. However, the hydraulic
conductivities for two soils with low clay content were not affected by the
application of saline-sodic water.
A substantial variation in the TEC was found between soils and there was no clear
relationship between the TEC and the soil chemical or physical properties of the
soils. This suggests that there is a need to individually measure the TEC for each
soil and that it may not be possible to identify surrogate indicators of structural
stability to saline-sodic water application. While the TEC measurement methodology
appeared appropriate for the soils evaluated in this study, further research is required
University of Southern Queensland
Faculty of Engineering and Surveying
ENG4111 Research Project Part 1 & ENG4112 Research
Project Part 2
Limitations of Use
The Council of the University of Southern Queensland, its Faculty of Engineering and Surveying, and the staff of the University of Southern Queensland, do not accept any responsibility for the truth, accuracy or completeness of material contained within or associated with this dissertation.
Persons using all or any part of this material do so at their own risk, and not at the risk of the Council of the University of Southern Queensland, its Faculty of Engineering and Surveying or the staff of the University of Southern Queensland.
This dissertation reports an educational exercise and has no purpose or validity beyond this exercise. The sole purpose of the course "Project and Dissertation" is to contribute to the overall education within the student’s chosen degree programme. This document, the associated hardware, software, drawings, and other material set out in the associated appendices should not be used for any other purpose: if they are so used, it is entirely at the risk of the user.
Professor Frank Bullen
Dean
Certification
I certify that the ideas, designs and experimental work, results, analyses and conclusions set out in this dissertation are entirely my own effort, except where otherwise indicated and acknowledged.
I further certify that the work is original and has not been previously submitted for assessment in any other course or institution, except where specifically stated.
Leigh Allan Hansen
Student Number: 0050056469
_____________________________________Signature
Acknowledgements
Throughout the course of this project, I have been fortunate to receive the assistance
of many people. Many thanks go out to these people and deserve special recognition
for their technical support and willingness to share their ideas, knowledge and skills.
All staff at the National Centre of Engineering in Agriculture (NCEA), The
University of Southern Queensland (USQ),
Prof. Steven Raine (Project Supervisor, USQ) for his technical support and
much appreciated mentoring.
Mr. Younes Ezlit (PhD student, NCEA) for his assistance with technical
support and for sharing his research experience.
Mr. Dan Eising (Technical Officer) and Nishant Pradhan (Technical Officer)
for their cooperation and technical support during laboratory testing.
Miss Loretta McKeering (USQ, NCEA) for her endless guidance, mentoring
and technical support.
Finally, special thanks go to the National Centre for Engineering in Agriculture for
providing me with this project. Their support was greatly appreciated and the
Table of Contents
Abstract i
Acknowledgements iv
Table of Contents v
List of Figures vii
List of Tables viii
Chapter 1.Introduction 1
Chapter 2.Literature Review 4
2.1 Salinity and Sodicity 5
2.2 The Use of CSG Water for Irrigation 7
2.3 Previous Research 11
Chapter 3.Methodology and Preliminary Trials 15
3.1 Materials and Methods for Short Column Hydraulic Conductivities 15
3.2 Particle Size Analysis and Procedure 17
3.3 Results 19
3.4 Conclusion 20
Chapter 4.Characterizing Reduction in Ksat for Range of Soils 22
4.1 Introduction 22
4.2 Particle Size Analysis Results 23
4.3 Laboratory Chemical Assessment 24
4.4 Short Column Saturated Hydraulic Conductivity Results 25
4.6 Conclusion and Recommendations for Further Research 28
List of References 30
Appendix A. Project Specification 32
Appendix B. Particle Size Analysis Results 34
Appendix C. Comparison of Initial Saturated Hydraulic Conductivities 36
Appendix D. Relative Saturated Hydraulic Conductivities of Sample Soils 39
List of Figures
Figure 1 Comparison of produced water with Guideline values for irrigation and
stock watering 2
Figure 2 Change in infiltration with salinity (Ayers & Wescot 1985) 9
Figure 3 Range used for soil sensitivity tests 16
Figure 4 Apparatus for determination of particle size distribution 18
Figure 5 Topographic representation of soil locations (Google Earth 2007) 22
Figure 6 Summary of the TEC (i.e. 0.8Kca) curves for the soils 26
Figure D.1. Soil 1 relative saturated hydraulic conductivities over varying salt
concentrations 40
Figure D.2. Soil 2 relative saturated hydraulic conductivities over varying salt
concentrations 41
Figure D.3. Soil 2 Trial 2 relative saturated hydraulic conductivities over varying salt
concentrations 42
Figure D.4. Soil 3 relative saturated hydraulic conductivities over varying salt
concentrations 43
Figure D.5. Soil 4 relative saturated hydraulic conductivities over varying salt
concentrations 44
Figure D.6. Soil 5 relative saturated hydraulic conductivities over varying salt
concentrations 45
Figure D.7. Soil 5 Trial 2 relative saturated hydraulic conductivities over varying salt
concentrations 46
Figure D.8. Soil 6 relative saturated hydraulic conductivities over varying salt
concentrations 47
Figure D.9. Soil 7 relative saturated hydraulic conductivities over varying salt
concentrations 48
Figure D.10. Soil 8 relative saturated hydraulic conductivities over varying salt
concentrations 49
Figure D.11. Soil 9 relative saturated hydraulic conductivities over varying salt
List of Tables
Table 1 Classification of Salt-affected Soils (Pearson 2009) 6
Table 2 Selected chemical and physical properties of the soils 25
Table 3 Saturated hydraulic conductivity of the soils when 2 dS m-1 CaCl2 solution
applied 27
Table B.1 Particle Size Analysis Data 35
Table C.1 Comparison of Initial Saturated Hydraulic Conductivities 37
Table E.1. Soil 1 routine analysis data 52
Table E.2. Soil 2 routine analysis 55
Table E.3. Soil 2 Trial 2 routine analysis data 57
Table E.4. Soil 3 routine analysis data 60
Table E.5. Soil 4 routine analysis data 63
Table E.6. Soil 5 routine analysis 65
Table E.7. Soil 5 Trial 2 routine analysis data 68
Table E.8. Soil 6 routine analysis 71
Table E.9. Soil 7 routine analysis data 74
Table E.10. Soil 8 routine analysis data 77
1.
Introduction
The aim of this project was to investigate the physical and chemical characteristics
involved with the determination of the electrolyte threshold in soils and their
interrelationships, with particular interest in effects of sodium. This project also investigates these characteristics and their significance to the Australia’s Coal Seam
Gas mining industry and irrigation.
In recent years there has been increased concern within Australia’s agricultural
industry regarding water availability and quality for irrigation. Prolonged droughts and dwindling water storages have put the nation’s water resources under increased pressure. Australia’s coal seam gas industry has been investigating the use of coal
seam gas (CSG) by-product water for irrigation. However, CSG by-product water
has high sodicity and salinity concentrations which are potentially harmful to crops
and soil structure if used for irrigation.
Coal Seam Gas also commonly known as Coal Bed Methane is a naturally occurring
methane (CH4) gas is created through geological processes during the formation of
coal. Usually the methane is mixed with carbon dioxide, other hydrocarbons and
nitrogen. The methane that is produced during coalification is later extracted for
industrial and commercial use. Water is produced as a by-product to coal seam gas
production but its reuse is limited by the water quality and cost of treatment. Often
this water is poor quality and must be contained in storage ponds.
Extraction of coal seam gas has and continues to generate global controversy.
Phenomenal volumes of water are pumped from coal seams to release entrapped
methane within the saturated coal seam. The water quality and volume discarded
from each seam varies regionally, however, it can be expected to extract 20 to 80L
per minute of water. Generally the water quality is satisfactory for domestic purposes
and livestock watering, however high sodium levels threaten soil stability when
change the physical and chemical properties within the soil profile, inducing
prolonged degradation of soil.
Controversy has surrounded the disposal/beneficial use of coal seam gas product
water, a potentially viable irrigation source. The quality of CSG is highly variable
and can only be quantified after exploration and appraisal testing. However, total
dissolved salts from water extracted in the Surat Basin are typically 2260-5060
mg/L, whereas the upper limit for cotton salt tolerance is 1200 ppm as illustrated by
Figure 1. The apparent salinity of CSG water limits its potential uses.
Figure 1 Comparison of produced water with Guideline values for irrigation and stock watering
The Queensland Government is moving towards implementing legislation that forces
mining companies to discontinue use of evaporation ponds. The development of the
CSG water policy was initiated when in 2007, 12.5 GL of by-product water was
produced in Queensland (Department of Infrastructure and Planning 2009). Due to
industry expansion it has been projected to reach 200-500 GL of by-product water
per year. The managing director of Queensland Gas Company has disclosed to the
media that the company has the capacity to produce up to 17 ML of water every day
in the Surat basin.
This new legislation has forced mining industries to investigate alternate ways of
However, the soil tolerance to sodium is governed by the soil chemistry and physical
structural properties and is typically characterized by a reduction in the soil hydraulic
conductivity. The structural degradation is a function of both the salinity (i.e.
electrolyte concentration) and sodicity of the applied water.
The reuse of CSG water requires complete understanding of the physical and
chemicals of the soils before irrigation. However, there is currently no standardized
method for the routine determination of electrolyte thresholds to minimize structural
degradation in soils. Hence, this project developed a strategy for the routine
measurement of threshold electrolyte concentrations (TEC) and evaluated the
differences in TEC across a range of soils.
Correct management of this mining by-product could potentially supplement farmers
with an alternative resource base for water. Where available water from dams,
creeks, rivers, and underground aquifers are scarce, extraction of water saturating
coal seams may be utilized as an irrigable source of water. This would revolutionize
irrigation management practices in Australia.
For the application of coal seam gas water further research is required to determine
universal standards and regulations for appropriate treatment methods and mixing
2.
Literature Review
Salt affected soils occur both naturally and as a results of interference by man. This
interference by manipulating hydraulic process induces the accumulation of salts
within the soil profile. There are significantly large areas in Australia that are salt
affected by natural causes. However, there is an increasing landmass area that is becoming influenced by man’s activities. There are two broad classifications of
salinity. The first is saline soils which contain high levels of any salt, and the second
is sodic soils which contain high proportions of sodium ions relative to other cations
in the soil. This project primarily investigates the effects of sodium on the hydraulic
conductivity.
Sodic soils can be susceptible to clay dispersion especially when they have high
levels of exchangeable sodium and low levels of total soluble salts. As a results sodic
soils can seal, crust and have induced low permeability. Moreover, the dispersion of
sodic soils increases their susceptibility to erosion. Hence, it is imperative that
professionals working with irrigation of CSG water have familiarity of the chemical
and physical process involved with the degradation of sodic soils.
The objectives to this project are outlined below:
1. Evaluate the reduction in Ksat for nine soils across a range of EC/SAR water
combinations
Prepare soils by crushing and sieving the samples to the recommended
standard size.
Conduct short column saturated hydraulic conductivity tests on soils by preparing water solutions at varying concentrations of sodium and calcium
and treat each soil column (five columns per soil). Each soil column has a
Pre-Treatment (stable concentration) and Treatment water applied to it.
Analyse data determining the relative hydraulic conductivity of each soil.
2. Evaluate the factors influencing the reduction in Ksat within the soil columns
Conduct long column saturated hydraulic conductivity tests on selected soils
using selected water quality treatments;
Analyse data and model the results for each soil. Compare results to short
column tests identifying any discrepancies;
If appropriate, evaluate the soil chemistry at different locations in the
columns.
2.1 Salinity and Sodicity
Saline soils are simply soils containing a large amount of soluble salts. These salts
are predominantly sodium, calcium and magnesium coupled with chloride, sulfate or
bicarbonate. Concentrations of these salts are expressed as electric conductivity (EC)
of the soil’s saturation paste or saturation extract (Singer & Munns 2006). Electrical
conductivity is the measure of a material’s ability to conduct electricity by way of
ion movement. Water being a poor conductor, EC measurement is an accepted
measure and criterion for soil salinity.
Sodic soils contain Na as a significant proportion of their total exchangeable cations
(Singer & Munns 2006). Generally saline soils are sodic soils because sodium is
more abundant than others but not always. Useful indications of sodicity are
exchangeable sodium percentage (ESP) and sodium absorption ratio (SAR). The
ESP is the percentage of sodium expressed as a percentage of total exchangeable
cations (Singer & Munns 2006).
ESP = Na exch Ca + Mg exch
where Na, Ca, and Mg represent concentrations in milliequivalents per litre of the
respective ions (Davis & Dewiest 1996).
SAR = Na Ca + Mg2
where Na, Ca, and Mg refers to concentration in mmolc L-1. (Davis & Dewiest 1996).
Sodic and saline soils are generally alkaline and exhibit a pH ranging from 8.3-8.5,
at which the CaCO3 precipitates at atmospheric CO2 pressures (Singer and Munns
1996). The alkalinity and salt concentrations increase as water bodies transporting
the salts evaporate. Moreover, irrigating of saline water increases salt accumulation
in the soil profile due to evaporation and limited drainage.
It has been stated that salinity is the acute accumulation of salts within the soil
profile. Singer and Munns (1996) define sodicity as a soil harbouring high levels of
sodium, hence possessing a high exchangeable sodium percentage or high sodium
absorption ratio. Sodium within soil profiles readily reduces structure inducing
impermeability. Singer and Munns (1996) suggest critical values for ESP vary from
5 percent to 15 percent, depending on soil salinity. Table 1 illustrates the general
classification of salt-affected soils.
Table 1 Classification of Salt-affected Soils (Pearson 2009)
Classification Electrical
Conductivity
(dS/m)
Soil pH Sodium
Adsorption
Ration (SAR)
Soil Physical
Condition
Saline >4 <8.5 <13 Normal
Sodic <4 >8.5 ≥13 Poor
Saline-Sodic >4 <8.5 ≥13 Normal
High pH <4 >7.8 <13 Varies
The three principal physical effects of sodium are reductions in soil infiltration,
hydraulic conductivity and surface crusting. These effects are replacement of
2.2 The Use of CSG Water for Irrigation
Salinity inhibits plant development and growth however, the degree of severity is
dependent on the climatic conditions, existing soil water, salt concentration,
irrigation routines, plant variety and stage of development (Pearson K 2003). Plant
available water is at its highest straight after irrigation and soil water salinity is at its
lowest. However, the salts accumulate due to evaporation and plants withdrawing
down water in the soil profile. The soil salinity increases as salts become more
concentrated. Moreover, the osmotic potential decreases as the solute concentrations
increase. Hence water moves towards regions of high solute concentrations,
constricting the plant’s ability to extract water. Moreover, this lowers the amount of
available water regardless of the amount of water in the root zone (Pearson K, 2003).
For water to enter the plant’s roots the water potential must be less than the
surrounding soil. To absorb moisture in to the roots from a saline soil, the plant cells
must increase their solute concentration. Singer and Munns (1996) suggest that the
solutes inducing osmotic regulation are either organic components made by the plant
or salt ions taken from the soil.
Salt does not prevent plants from extracting water, plants are able to regulate their
own osmotic potential. Regulation of osmotic potential requires substantial energy
from the plant. Moreover, the plant succumbs to increased stress levels leading to the
deterioration of the plant. Plant symptoms of salt damage include; slow growth,
yellowing of leaves, death of leaves and tip, reduced germination and wilting of
leaves even though the soils appears to be adequately moist, (Bodman & Lubach
1982).
Sodium is toxic to plants when the calcium concentrations are low and the soils have
high clay percentages. The toxicity of sodium is dependent on the physical properties
of the soil. Sodic soils will readily lose their structure because of particle
deflocculation when salt concentrations in the soil solution are not high enough
salt concentrations cannot be maintained due to the top soil layer becoming
impermeable creating a barrier for water infiltration. In addition decreased
infiltration will cause erosion levels and runoff to increase. Sodic soils are generally
inhospitable to vegetation and are not sustainably manageable for agriculture.
Soils containing high levels of sodium and low levels of other salts readily disperse
clay in to individual hydrated particles of instead of remaining clustered. The
hydrated particles are surrounded by exchangeable cations that repel particles from
one another. Particles can lose their cohesion if these electrically repulsive forces
become strong enough. Soils abundant in salt cohere particles by pushing
exchangeable cations against clay particles, inducing minimal interference with
cohesion of particles (Singer and Munns 1996). High soil water salinity causing fine
particles to bind is known as flocculation (Pearson K 2003). Contrary to cations
being held closely to clay particles, sodium cations are held loosely where it is
hydrated and so the sodic colloids disperse. Despite soil aggregation and
stabalisation improving with increased soil solution salinity, it has detrimental
effects on plant growth. Moreover, soil salinity cannot be maintained to promote soil
structure without hindering plant health (Pearson K 2003).
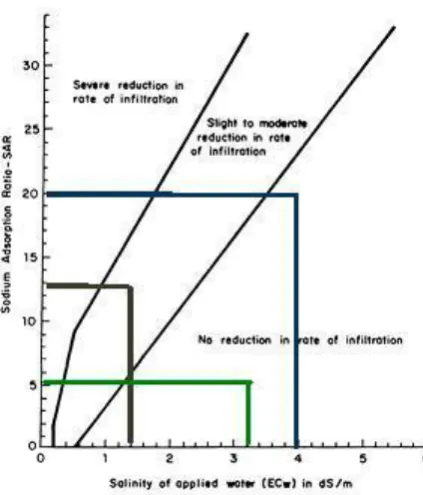
Figure 2 illustrates the transition from no reduction in saturated hydraulic
conductivity to severe reduction in saturated hydraulic conductivity. The reductions
are characterized by the positioning of the TEC curves. As the SAR increases and
the salt concentration decreases the soils become progressively more unstable due to
the soil solution becoming more dilute. This graphically illustrates the affects of
rainfall events after the application of a saline water quality; the saturated hydraulic
Figure 2 Change in infiltration with salinity (Ayers & Wescot 1985)
Bauder, J (2009) proposes that sprinkler irrigation and land spreading are two
alternatives for beneficially disposing of saline and sodic water. Feasibility of land
spreading is governed by the quality and degree of sodicity of irrigation water.
Execution of this scheme would be impractical in areas where scientific irrigation water management and monitoring weren’t previously practiced. Site selection for
land spreading of sodic water is imperative to sustainability of adequate soil
structure. Oster and Shainberg (2001) indicate a criterion for the application of sodic
and saline water while sustaining soil quality and plant production which includes
using saline and salt tolerant plants, maintaining yearly crop cover to minimize
effects of rain forcing the heavily sodic soils to become unstable, periodic
application of non-saline-sodic waters, monitoring applied water quality and soil
chemistry, and periodic applications of chemicals to amend salt and sodium damaged
soils.
Singer and Munns (1996) highlights, disturbance to the surface of soils susceptible to
dispersion are most at risk for losses in structure and permeability. Seal formation is
another process inducing reductions in hydraulic characteristics and is predominantly
soil aggregates break down and clog pores. Oster and Shainberg (2001) reported on
the sensitivity that sodium absorption ratio of applied water has on saturated
hydraulic conductivities. Hydraulic conductivity is the speed at which water moves
through a soil profile. This is a function of both soil properties and soil moisture
content (Raine 2008). Rainfall or irrigating with non-saline water on soils that have
previously been irrigated with saline or sodic water, will lower the EC to a greater
extent than lower the SAR. This disproportionate reduction in salinity will disrupt
the balance between flocculation promoted by the electrolyte concentration and
dispersion promoted by sodicity (Bauder J 2009).
Soils heavily leached with sodium were found to have a substantial reduction in
hydraulic characteristics than soils leached with calcium (Waldron et al. 1970). If the
electrolyte concentration is maintained at the critical threshold, then the hydraulic
conductivity will decrease as the exchangeable sodium percentage increases (Quirk
& Schofield 1955). Moreover, the soil aggregates disperse by increasing electrolyte
concentration because of the reduction in conductive porosity. This phenomenon is
most extreme in soils with high clay contents. It should also be noted that calcium is
immobolised when exposed to high pH levels and is precipitated out as calcium
carbonate (CaCO3).
It is preferable to irrigate less frequently with heavier quantities at each irrigation.
Under this type of irrigation management, the surface soil is more thoroughly
leached thus avoiding salt accumulation in the root zone. Leaching is the process of
washing salts downward out of the root zone through natural rainfall, or irrigation in
addition to that needed for plant growth. In a practical sense, most leaching is
achieved during wet seasons when deep water penetration is achieved. Combinations
of practices which encourage the rapid intake of rainfall will increase the leaching
potential. Such practices include deep ripping, heavy organic matter residues on
fallow ground, crop cover and gypsum applications. This is particularly important
during the heavy summer rainfall period. Sandy soils will require irrigation on a
more frequent basis than clay soils subjected to the same poor quality water and soil
salt content. The salinity of blended water will depend on the original salinity levels
The results in this project have a direct impact on water use in Australia. If coal seam
gas product water is recognized as a viable resource for irrigation, pressure will be relieved from Australia’s dwindling water resources. Correct management of this
mining by-product could potentially supplement farmers with an alternative resource
base for water. Where available water from dams, creeks, rivers, and underground
aquifers are scarce, extraction of water saturating coal seams may be utilized as an
irrigable source of water. This would revolutionize irrigation management practices
in Australia.
Correct management will adequately maintain soil permeability by selecting an
appropriate salinity level in the irrigation water, even at excessively high sodicity
levels. However, problems arise when non-saline waters are applied as they cause
potential crusting, poor aeration, ponding and reduced hydraulic conductivity. Poor
management will inevitably result in long-term damage to soil structure that may
take decades to recover depending on the severity of soil dispersion. Conclusions
from this project will deduce possible methodologies for determining the electrolyte
threshold in soils, preventing the application of wrong saline and sodic water
qualities.
2.3 Previous Research
Existing irrigation water quality criteria is determined using short term laboratory
column replications and analyzing variations in soil performance over time. Previous
studies utilized fully saturated disturbed soil columns and measured the hydraulic
conductivity to analyse soil performance. Comparatively, these studies do not
accurately model field conditions. They fail to consider such limitations as crusting,
impact of rain events, and wetting and drying conditions. There is currently no
standardised method for the routine determination of electrolyte thresholds to
minimise structural degradation in soils. This project developed a strategy for the
routine measurement of threshold electrolyte concentrations (TEC) and evaluated the
There has been extensive scientific research conducted surrounding the adverse
effects water quality has on the physical properties of soils. Majority of this research
analysed saturated hydraulic conductivities of disturbed soil columns under constant
flow. McNeal and Coleman (1966) conducted a number of studies characterizing the
effects of EC and SAR on soil hydraulic and physical properties. Their studies
concluded that soils high in kaolinite and sesquioxides were practically insensitive to
variations in solution composition (McNeal & Coleman 1966). No single property
was found to characterize a soils response to a given solution, although expressions
of exchangeable sodium percentages and total salt concentrations produced
comparable curves for soils with similar clay mineralogy (McNeal & Coleman
1966). McNeal and Coleman (1966) demonstrated a definite decrease in hydraulic
conductivity over an exchangeable sodium percentage range of 20 to 35 and at
concentrations of 3 to 50 meq/L. The process was irreversible with the reapplication
of high salt solutions. McNeal and Coleman also observed soils containing high
percentages of montmorillonite to be the least stable.
McNeal et al. (1966) analysed the effect of solution on the swelling of extracted soil
clays. The results indicated that the solutions correlated with the relative hydraulic
conductivity of the soils in the same solutions and with the domain model values
(McNeal et al., 1966). This model proposes that sodium and calcium clays consist of
distinct boundaries where only sodium regions swell at low salt concentrations
(McNeal et al., 1966). The correlations indicate that the most plausible physical
change inducing the reduction of hydraulic conductivity is the closing of conducting
pores by internal swelling.
Frenkel et al. (1978) analysed the hydraulic conductivities of three southern
California soils adjusted to different levels of exchangeable sodium at varying salt
concentrations. The soils tested were primarily montmorillonitic, vermiculitic, and
kaolinitic soils. The columns were initially leached with water qualities of SAR 10,
20 and 30, then leached with consecutively diluted water qualities of EC 10, 5 and 1
dS m-1 respectively, and finally distilled water. The montmorillonitic soil
experienced a decline in hydraulic conductivity at EC = 1 dS m-1 and SAR 10,
relative to the hydraulic conductivity at EC = 5. The kaolinitic soil experienced a
experienced a slight reduction in hydraulic conductivity at EC = 1 dS m-1 and a steep decline with distilled water. This study doesn’t critically analyze the response that
these soils have to varying exchangeable sodium percentages and salt concentrations
under EC = 1 dS m-1 and SAR 10.
There have been limited studies completed investigating the effects of rain or pure
water applied after the application of saline water. Shainberg et al. (1981a)
conducted experiments on the effects of low electrolyte concentrations on clay
dispersion and hydraulic conductivity of sodic soils. This study tested a Fallbrook
soil (fine-loamy, mixed, thermic Typic Haploxeralfs) and reported an 80% reduction
in hydraulic conductivity when deionised water was applied after infiltration of
water quality of SAR 5. Moreover, it was reported that a 90% reduction in hydraulic
conductivity occurred when deionised water was applied after infiltration of water quality of SAR 10. The soil’s response to the sequential solutions was exacerbated
by the sand-soil combination and high infiltration rates through the soil columns
(Shainberg et al., 1981a). However, higher infiltrations rates resulted in greater
detachment and dispersion of clay colloids. The sodic soils response to the deionised water was dependent of the soil’s capacity to maintain high EC levels due to mineral
dissolution, available calcium carbonate for reaction, exchangeable sodium and
salinity of the soil. The Fallbrook soil was extremely sensitive to the level of
exchangeable sodium and to the salt concentrations of the percolated solution
(Shainberg et al., 1981a). The results indicated that soils exceeding ESP of 12% and
soil solutions of 3 meq/L had reductions in both clay dispersion and hydraulic
conductivity. Moreover, there was also a reduction in hydraulic conductivity and
clay dispersion at ESP values of 1 and 2% when the soil solution was maintained at
0.5 meq/L effluent concentration after being leached with distilled water. Shainberg
et al., (1981a) hypothesized that the response of soils to low ESP less than 20 after
leaching with low electrolyte water is characterized by the maintained soil solution
concentration at the solid phase.
Shainberg et al., (1981b) tested three soils to investigate the differences in rates of
mineral dissolution and its influence on decreased hydraulic conductivity after the
with their hypothesis. It was concluded that differences in soils ability to undergo
dispersion is important in affecting crust formation under rainfall conditions. Soils
with higher dissolution rates were found to be less affected by exchangeable sodium
(Shainberg et al., 1981b). Clay dispersion induces particle movement and possible
lodgement in conducting pores is caused by low levels of electrolytes at even low
levels of exchangeable sodium (Shainberg et al., 1981b). It was found that soils
having moderate ESP could maintain their physical structure through majority of the
soil profile, however still be susceptible to dispersion at the surface (Shainberg et al.,
3.
Methodology and Preliminary Trials
There is currently no standardized method for determining the electrolyte threshold
to minimize structural degradation in soils. This project developed a strategy for the
routine measurement of threshold electrolyte concentrations (TEC) and evaluated the
differences in TEC across a range of soils. The soils used throughout
experimentation were obtained from two anonymous Coal Seam Gas extraction
companies. The exact location of the soils is subject to confidentiality.
3.1 Materials and Methods for Short Column Hydraulic Conductivities
Preparation of the soil required the sampled soil to be air-dried and crushed by
mortar and pestle then sieved to 2.36 mm. Buchner funnels were utilized to contain
the soil samples for individual testing. Variations in bulk density were controlled by
dropping the Buchner funnels from a height of 3 cm consecutively for three times on
a hard surface. Filter paper was inserted in the bottom of the Buchner funnels to
prevent soil loss through the perforated base. They were also layered on the soil
surface to eliminate soil disturbance during solution application.
Each soil column had two separate pre-treatments applied on consecutive days. The
purpose of consecutive pre-treatments was to allow for any initial consolidation
errors from the first application. Pre-treatment solutions were a blend of deionised
water and calcium chloride dihydrate (CaCl2.H2O). Pre-treatment solutions were
selected at a sodium absorption ratio (SAR) and electrical conductivity (EC) that
would not cause the soil samples to disperse. It was found that an EC of 2 dS and
SAR of 0 were sufficient. To ensure complete saturation of the soil profile before the
initial pre-treatment, the buchner funnels were immersed in the pre-treatment
solution.
After the application of two pre-treatments, each soil was tested for various sodium
absorption ratios over a range of electrical conductivities from 0.5 dS to 8 dS.
accurately measured on laboratory scales (Sartorius BP2105) to produce a bulk
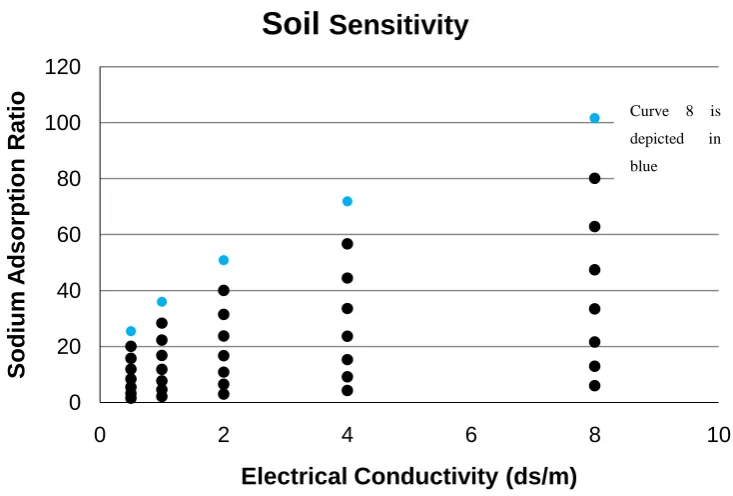
solution. Bulk solutions were made up for each individual curve. A curve represents
a single group of five dots in the horizontal/diagonally positive direction as
illustrated in figure 1. Five SAR solutions were tested at EC’s 0.5, 1, 2, 4 and 8
using five columns for each soil. The respective solutions for EC’s 0.5, 1, 2 and 4
[image:25.595.125.492.243.491.2]were produced by diluting the bulk solution by half each time.
Figure 3 Range used for soil sensitivity tests
During treatments, each column was sequentially leached ensuring seven times the
pore volume had been applied to guarantee equilibrium. Volumetric measurements
of leachate were recorded in ten minute intervals until the water head was no long in
contact with the inverted bottle of solution. Water head and soil depth were
measured during experimentation to calculate the hydraulic conductivity. The last
two readings of leachate volume were averaged and accepted as the final hydraulic
conductivity for that soil. 0
20 40 60 80 100 120
0 2 4 6 8 10
S
odium
A
dsor
pt
ion
Ratio
Electrical Conductivity (ds/m)
Soil
Sensitivity
Curve 8 is
depicted in
Treatments were progressively applied to the same soil column until enough data had
been collected to acquire data points for at least 60% reduction in saturated hydraulic conductivity. It was imperative that applied solutions had higher SAR’s than the
previous treatment otherwise the experiment was aborted.
Post-treatments were applied to each soil where only sodium chloride was added to
the solutions. In many cases it is assumed that SAR infinity results in a saturated
hydraulic conductivity of zero, hence a high SAR solution was applied to confirm or
reject this condition.
All results were collaborated and imported into modeling software to perform
three-dimensional analysis on the soils to acquire a representative graph of percentage
reductions in saturated hydraulic conductivities.
3.2 Particle Size Analysis and Procedure
The particle size distribution is an important soil characteristic that has direct
correlations with a many chemical and physical soil properties. The size, shape and
coherence of these particles vary extensively from region to region and their
respective climates. Quantity of particles will correlate with the strength of particle
bonding and how much energy is required to break these bonds. However, sufficient
energy needs to be applied to separate aggregates but not facture the primary
particles. Often pre-treatments of soil are conducted to soften aggregates, however
the introduction of ultrasonic equipment for particle size analysis has eliminated the
need for pre-treatments.
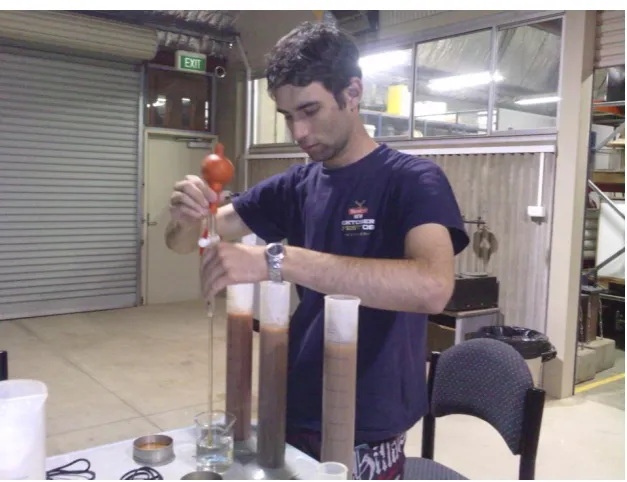
Particle size analyses are conducted by firstly accurately weighing 25g of air-dried
soil into a 250mL glass beaker, and then add 100mL of deionised water. Place the
beaker under the ultrasonic probe so that the probe is inserted to a depth of 25mm
into the suspension while leaving a finger width between the stand and the probe tip.
The sonifier utilised for particle size analysis was a Branson Sonifier. Ultrasonic
minutes. Appropriate safety equipment was used to prevent injury including gloves,
earmuffs and safety glasses. The suspension was removed and contents emptied in to
a sedimentation cylinder. The sedimentation cylinder was accurately fill with
deionised water to a predetermined volume of 500mL and allowed to reach room
temperature.
To determine the amount of material <20µm, the suspension was stirred with a
plunger until the sedimentation cylinder was evenly mixed, allowed to settle for 4
minutes, 48 seconds then subsampled 10mL of suspension at 100mm with a
volumetric pipette. The sample was transferred to a pre-weighed container where the
contents were deposited and volumetric pipette rinsed twice inside with deionised
[image:27.595.163.477.357.598.2]water and also deposited into the container.
Figure 4 Apparatus for determination of particle size distribution
To determine the amount of material <2µm, the suspension was stirred again with a
plunger until the sedimentation cylinder was evenly mixed, allowed to settle for 1
hour, 35 seconds then subsampled 10mL of suspension at 20mm with a volumetric
where the contents were deposited and volumetric pipette rinsed twice inside with
deionised water as above.
Both containers were then placed into an oven (105°C) for a minimum period of 48
hours. After this period the contents of the containers were weighted total mass of
sample determined. Percentages of sand silt and clay were calculated using the over
dried masses, volume removed by pipette and total volume in sedimentation
cylinder. This particle size analysis methodology was repeated for each soil.
Equations used in particle size analysis:
Oven dried mass = air dried mass × (percent water content / 100)
% Mass <20 µm = ((Mass <20µm dried container / Mass empty container) / 1
0mL) × ((500 / Oven dried mass) × 100)
% Mass <2 µm = ((Mass <2µm dried container / Mass empty container) / 10mL)
× ((500 / Oven dried mass) × 100)
3.3 Results
Various factors affecting the measurement of the TEC in soil columns were
evaluated. The key issues associated with routine analysis involved the selection of
the soil column length, pre-wetting and consolidating the soil column and the
sequential application of water with increasing sodium adsorption ratio on individual
columns.
Determination of an effective routine analysis procedure was obtained via trial and
error. In the initial stages there were discrepancies between the relative hydraulic
conductivities of the curves. This methodology only used a single pretreatment with
calcium chloride dihydrate (CaCl2.H2O) and each soil column was confined to a
single water quality, e.g. each point on the graph was independent from any other
point. This caused inconsistencies as the SAR increased. Naturally the relative
saturated hydraulic conductivity reduces as the SAR increases, however initially the
promote consistency and to reduce soil consumption for laboratory testing, each
column was confined to water qualities in a vertical direction. Providing that a single
column of soil consistently has a higher SAR water quality than the previous applied
to it, then the overall system will not be affected. However, this still did not produce
enough consistency to produce a theoretical surface that decreased as SAR increased.
The problem lied within the application of only a single pretreatment. The data
indicated that the soil was slumping significantly after the pretreatment application.
The data illustrated a reduction of 20 – 30% relative saturated hydraulic conductivity
due to slumping and rearranging of soil particles (See Table C.1 Comparison of
Initial Saturated Hydraulic Conductivities). Moreover, a second pretreatment of the
same water quality was applied on consecutive days to combat this problem.
The data indicated that soils dried out quite significantly when left for days. The high
clay content of some soils and their susceptibility to shrink and swell behavior meant
that the application of water qualities must occur on consecutive days to prevent
drying out. It was observed that when the soils dried out too much they cracked away
from the wall. This could induce tunneling, and hence an increased saturated
hydraulic conductivity as the SAR increases. Often 2 days was sufficient time to
drastically affect results. In this case the test was aborted and then repeated.
An appropriate soil column height was investigated. The results for this project
indicate that the height utilized for routine analysis of 2.5 – 3.0 cm was sufficient
however, further study after completion of the experiments questioned whether these
heights were acceptable for all soils. Finer textured soils in shallower soil columns
may be subject to tunneling around the walls. This phenomenon was demonstrated in
this project however, the results were inconclusive.
3.4 Conclusion
The methodology for determining the TEC in soils was found to be able to identify
concentrations were generally found to have a substantial reduction in hydraulic
conductivity compared to soils leached with calcium dominated water.
A substantial variation in the TEC was found between soils and there was no clear
relationship between the TEC and the soil chemical or physical properties of the
soils. This suggests that there is a need to individually measure the TEC for each
soil and that it may not be possible to identify surrogate indicators of structural
stability to saline-sodic water application. While the TEC measurement methodology
appeared appropriate for the soils evaluated in this study, further work is needed to
4.
Characterizing Reduction in Ksat for Range of
Soils
4.1 Introduction
This section contains a discussion on the graphical results from the routine analysis
of soils and investigates relationships between the physical and chemical properties
of soils and their responses to varying electrolyte concentrations. Visual inspection
indicated that soils 1 to 3 were red sandy loam surface soils that transition through
light clay to silty clay below 500 mm. Soil 3 appeared to be slightly heavier in
texture. Soils 4 to 6 are slightly lighter, red sandy loam surface soils that transition
through light clay to silty clay below 500 mm. Finally soils 7 to 9 are clay loams to
light clay surface soils, that transition from light clay to silty clay below 500 mm.
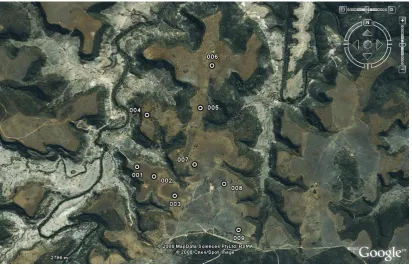
[image:31.595.115.528.434.699.2]Glen Dale confirmed the above visual inspection by email on 17 November 2008.
Figure 5 illustrates the geographic locations of the soils. The exact location of these
soils is restricted due to confidentiality. It should be noted that the area enclosed
within points 3, 7, 8 and 9 is a hill comprised of Hutton Sandstone that rises above
the general plateau level.
4.2 Particle Size Analysis Results
The results from the particle size analysis demonstrated a large range of soil texture
compositions. The IUSS system was utilized to classify the sample soils.
Soils 1 and 5 were classified as loamy sand being coherent with medium sized sand
granules and not easily sheared into a ribbon between the thumb and forefinger (See
Appendix B. Particle Size Analysis Results). Loamy sands have clay contents less
than 5% which is consistent with the particle size analysis results. However Soil 5
demonstrated a clay content of 9% but was deemed acceptable.
Soils 2 and 7 were classified as silty loam (See
Appendix B. Particle Size Analysis Results). They have a coherent bolus and are
very smooth and often silky when worked. Silty loams can form ribbons of
approximately 25 mm and have clay content of approximately 25% and silt content
in excess of 25%. However, both soils 2 and 7 were not consistent with the field
texture classification grade. They both had a negative clay content of -1.8% after the
particle size analysis. The inconsistency could be explained by not rinsing the pipette
sufficiently between consecutive sampling. The Branson Sonifier may also not have
been inserted close enough to the bottom of the beaker to ensure that the sonifier
sufficiently separated aggregates but not facture the primary particles.
Soils 3 and W3 were classified as light medium clay which produces a plastic bolus
Appendix B. Particle Size Analysis Results). It has slight resistance to ribboning
shear and can form a ribbon of approximately 75 mm. Light medium clays possess
clay contents ranging from 40-45%, which is consistent with the results.
Soils 4, 6 and W1 were classified as a loam because it produces a coherent bolus that
is rather spongy (See
Appendix B. Particle Size Analysis Results). Loams have a smooth feel when
manipulated but with no obvious sandy or silky textures. They can often be greasy
due to high organic matter present and produce a ribbon of approximately 25 mm.
Loams have clay contents around 25%. However, Soil 6 demonstrated a clay content
of only 12%. This discrepancy is too low to be ignored. The inconsistency could be
explained by not rinsing the pipette sufficiently between consecutive sampling. The
Branson Sonifier may also not have been inserted close enough to the bottom of the
beaker to ensure that the sonifier sufficiently separated aggregates but not facture the
primary particles. They sampling may not have been taken exactly from the correct
depth. Temperature may also have contributed to the discrepancy as the temperature
variation
Soil 8 was classified as light clay due to it producing a plastic bolus and being
smooth to touch (See
Appendix B. Particle Size Analysis Results). There is slight resistance to shearing
between the forefinger and thumb. Light clays will form a ribbon of 50 – 75 mm in
length and possess clay contents of approximately 35 – 40%.
The greatest discretion of the particle size analysis results was soils 2 and 7. The
particle size analysis was not repeated to investigate failed procedures, however the
4.3 Laboratory Chemical Assessment
SGS Agritech conducted a chemical analysis and produced the following data
illustrated in Table 1. Note that none of the soils can be classified as sodic as they all
possess an exchangeable sodium percentage less than six. It should also be noted that
none of the soils are particularly saline. The chemical compositions illustrated below
do not drastically reflect the results obtained from the particle size analysis. No clear
conclusion can be drawn from this information that there are direct links between the
[image:34.595.80.561.312.523.2]physical and chemical properties of soils.
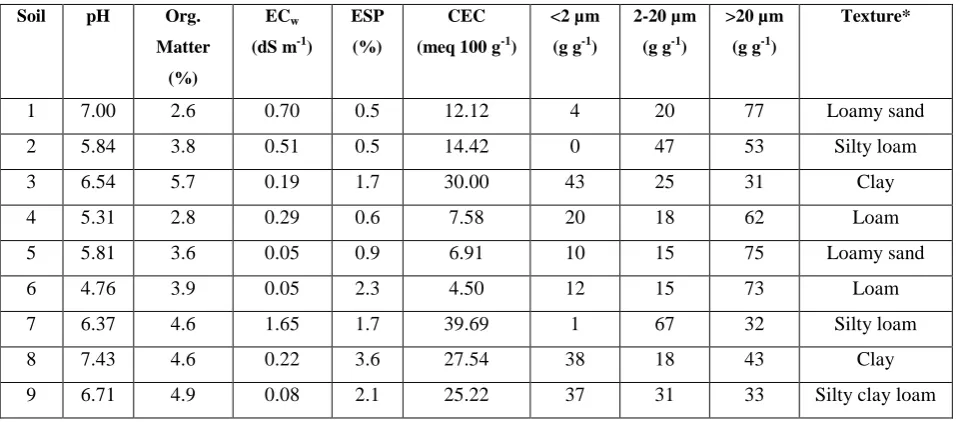
Table 1 Selected chemical and physical properties of the soils
Soil pH Org. Matter
(%)
ECw
(dS m-1)
ESP (%)
CEC (meq 100 g-1)
<2 µm (g g-1)
2-20 µm (g g-1)
>20 µm (g g-1)
Texture*
1 7.00 2.6 0.70 0.5 12.12 4 20 77 Loamy sand
2 5.84 3.8 0.51 0.5 14.42 0 47 53 Silty loam
3 6.54 5.7 0.19 1.7 30.00 43 25 31 Clay
4 5.31 2.8 0.29 0.6 7.58 20 18 62 Loam
5 5.81 3.6 0.05 0.9 6.91 10 15 75 Loamy sand
6 4.76 3.9 0.05 2.3 4.50 12 15 73 Loam
7 6.37 4.6 1.65 1.7 39.69 1 67 32 Silty loam
8 7.43 4.6 0.22 3.6 27.54 38 18 43 Clay
9 6.71 4.9 0.08 2.1 25.22 37 31 33 Silty clay loam
* Indicative texture according to the PSA and IUSS texture triangle
4.4 Short Column Saturated Hydraulic Conductivity Results
The methodology for determining the TEC in soils was found to be able to identify
differences between the soils. Soils subjected to water with high sodium
concentrations were generally found to have a substantial reduction in hydraulic
conductivity compared to soils leached with calcium dominated water. However, the
hydraulic conductivities for two soils (Soils 2 and 5) with low clay content were not
analysis data for complete tabulated results for the short column saturated hydraulic
conductivity.
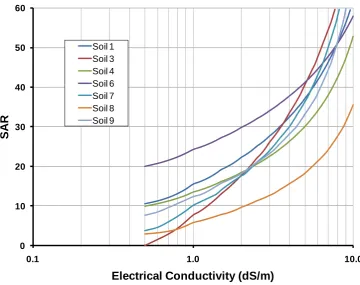
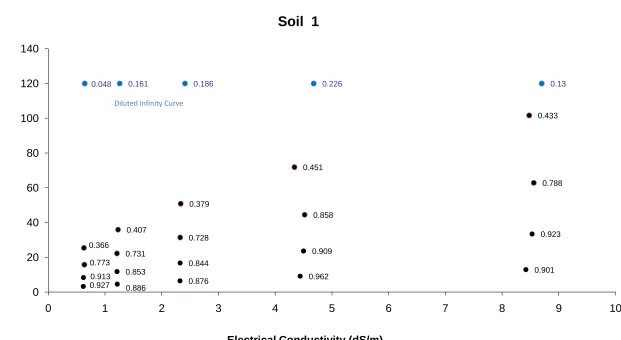
Figure illustrates a summary of the threshold electrolyte concentrations for the soils
tested. Note that the industry standard for acceptable irrigation conditions is a
maximum of 20% reduction in saturated hydraulic conductivity. Moreover, Figure
illustrates the threshold electrolyte concentrations for a 80% relative hydraulic
conductivity curves.
These are the maximum concentrations to which these soils can sustain an acceptable
soil structure. However, on the occasion of a rainfall event the soil solution becomes
diluted and forces the soil to become unstable however, an appropriate concentration
for irrigation that will not induce a maximum reduction in hydraulic conductivity of
20% is subject to further research.
0 10 20 30 40 50 60
0.1 1.0 10.0
SA
R
Electrical Conductivity (dS/m) Soil 1
[image:35.595.120.481.409.694.2]Soil 3 Soil 4 Soil 6 Soil 7 Soil 8 Soil 9
A substantial variation in the TEC was found between soils and there was no clear
relationship between the TEC and the soil chemical or physical properties of the
soils. This suggests that there is a need to individually measure the TEC for each
soil and that it may not be possible to identify surrogate indicators of structural
stability to saline-sodic water application. While the TEC measurement methodology
appeared appropriate for the soils evaluated in this study, further work is needed to
confirm that it is appropriate across a broader range of soils.
The data indicated that the soil was slumping significantly after the pretreatment
application. The data illustrated a reduction of 20 – 30% relative saturated hydraulic
conductivity due to slumping and rearranging of soil particles (See Table C.1
Comparison of Initial Saturated Hydraulic Conductivities). An appropriate number
of pretreatment applications required to achieve a steady infiltration rate was
inconclusive due to the soil particles continuously rearranging within the soil
column.
Table 2 provides an indication of the saturated hydraulic conductivity of soils when a
2 dS/m CaCl2 pretreatment water quality is applied. Note a broad range of saturated
hydraulic conductivities. High infiltration rates indicate that the soil is predominantly
sand and the lower infiltrations rates are indicative of a finer textured soil. These
results correlate with the particle size analysis to some degree however, the
determining exact saturated hydraulic conductivities that are expected for the various
field texture grades is difficult due to slight transitions between grades.
Table 2 Saturated hydraulic conductivity of the soils when 2 dS m-1 CaCl2 solution applied
Soil Kca
(cm h-1) 1 6.48 (±0.48)
2 4.42 (±0.46)
3 4.12 (±0.63)
4 7.86 (±0.51) 5 3.10 (±0.17)
7 5.92 (±1.07)
8 5.83 (±0.13) 9 6.06 (±0.56)
The methodology for routine analysis was utilized to evaluate the TEC by measuring
the reduction in hydraulic conductivity across a range of EC/SAR water quality
combinations. The chemical properties of these soils were obtained and a particle
size analysis conducted using a ultrasonic and pipette withdrawal method.
Various factors affecting the measurement of the TEC in soil columns were
evaluated. The key issues associated with routine analysis involved the selection of
the soil column length, pre-wetting and consolidating the soil column and the
sequential application of water with increasing sodium adsorption ratio on individual
columns.
4.5 Conclusion and Recommendations for Further Research
Coal seam methane by-product water has high sodicity and salinity concentrations
which are potentially harmful to crops and soil structure. The soil tolerance to
sodium is governed by the soil chemistry and physical structural properties and is
typically characterised by a reduction in the soil hydraulic conductivity. The
structural degradation is a function of both the salinity (i.e. electrolyte concentration)
and sodicity of the applied water.
There is currently no standardised method for determining the electrolyte threshold
to minimise structural degradation in soils. Hence, this project developed a strategy
for the routine measurement of threshold electrolyte concentrations (TEC) and
evaluated the differences in TEC across a range of soils.
Various factors affecting the measurement of the TEC in soil columns were
the soil column length, pre-wetting and consolidating the soil column and the
sequential application of water with increasing sodium adsorption ratio on individual
columns.
The methodology for routine analysis was utilised to evaluate the TEC for nine soils
by measuring the reduction in hydraulic conductivity across a range of EC/SAR
water quality combinations. The chemical properties of these soils were obtained
and a particle size analysis conducted using a ultrasonic and pipette withdrawal
method.
The methodology for determining the TEC in soils was found to be able to identify
differences between the soils. Soils subjected to water with high sodium
concentrations were generally found to have a substantial reduction in hydraulic
conductivity compared to soils leached with calcium dominated water. However, the
hydraulic conductivities for two soils with low clay content were not affected by the
application of saline-sodic water. These soils had very low clay contents according
to the particle size analysis, hence minimal dispersion occurred during the
application of highly saline water.
A substantial variation in the TEC was found between soils and there was no clear
relationship between the TEC and the soil chemical or physical properties of the
soils. This suggests that there is a need to individually measure the TEC for each
soil and that it may not be possible to identify surrogate indicators of structural
stability to saline-sodic water application. While the TEC measurement methodology
appeared appropriate for the soils evaluated in this study, further work is needed to
confirm that it is appropriate across a broader range of soils.
Further work is required to identify appropriate sustainable water qualities for
irrigation that minimises the effects of rain forcing soils irrigated with mining
List of References
Australian Bureau of Statistics 2002, Directory of Mining Statistics, Cat. No. 1144.0, Australian Bureau of Statistics, Canberra, viewed 14 September 2009,
<http://www.abs.gov.au>
Ayers, RS & Westcot, DW 1985, ‘Water for agriculture’, Food and Agriculture Organization (FAO) of the United Nations, Rome, Italy.
Bauder, J 2009, ‘Quality and characteristics of saline and sodic water affect
irrigation suitability’, Montana State University, Montana, viewed 15 May 2009,
<http://waterquality.montana.edu/docs/methane/irrigation_suitability.pdf>
Bodman, K & Lubach, G 1982, Management of saline irrigation water in the Lockyer Valley, Queensland Department of Primary Industries, Gatton.
Chambers, M 2009, ‘Santos’ Green Plan for CGS Project’, The Australian, 16 May 2009,
<
http://www.theaustralian.news.com.au/business/story/0,28124,25489718-643,00.html>
Davis, S, & Dewiest, R 1966, Hydrogeology, John Wiliey & Sons Inc, New York.
Department of Infrastructure and Planning 2009, ‘The Department of Infrastructure and Planning’, Brisbane, Queensland, viewed 13 September 2009,
<http://www.dip.qld.gov.au/>.
Raine, S 2008, AR3304Soil science selected readings, University of Southern Queensland, Toowoomba.
Frenkel, H, Goertzen, JO & Rhoades, JD 1978, ‘Effects of clay type and content, exchangeable sodium percentage, and electrolyte concentration on clay dispersion and soil hydraulic conductivity’, Soil Science Society of America Journal, vol. 42, pp. 32-39.
Google Earth 2007, Google, ver. 5, computer program, Google.
McNeal, BL & Coleman, NT 1966, ‘Effect of Solution on Soil Hydraulic Conducitivity’, Soil Science Society of American, vol. 30, pp. 308-312.
McNeal, BL, Norwell, WA & Coleman, NT 1966, ‘Effect of solution on the swelling of extracted soil clays’, Soil Science Society of America Journal, vol. 30, pp. 308-317.
Pearson K, 2003, The basics of salinity and sodicity effects on soil physical
properties, Montana State University, Montana, viewed 22 November 2009, <http://waterquality.montana.edu/docs/methane/basics_highlight.shtml>.
Quirk, JP & Schofield, RK 1955, ‘The effect of electrolyte concentration on soil permeability’, Soil Science, vol. 6, pp. 163-178.
Raine S 2008, AGR3304Soil Science Study Book, University of Southern Queensland, Toowoomba.
Rural Liquid Fertilisers 2007, The Trace Element Company, Perth, viewed 1 May 2009, <http://www.rlf.com.au/Home/tabid/36/Default.aspx>
Shainberg, I, Rhoades, JD & Prather, RJ 1981a, ‘Effect of low electrolyte
concentration on clay dispersion and hydraulic conductivity of a sodic soil’,
Soil Science Society of America Journal, vol. 45, pp. 273-277.
Shainberg, I, Rhoades, JD, Suarez, DL & Prather, RJ 1981b, ‘Effect of mineral weathering on clay dispersion and hydraulic conductivity of sodic soils’, Soil Science Society of America Journal, vol. 45, pp. 287-291.
Sharples, B 2009, ‘Santos to plants forests using water from Queensland Gas Project’, Bloomberg Press, viewed 15 May 2009,
<http://www.bloomberg.com/apps/news?pid=20601130&sid=a0QG6OQ8cQ Mo>
Singer, MJ & Munns, DN 2006, Soils: an introduction, 6th edn, Pearson Prentice Hall, New Jersey.
University of Southern Queensland
FACULTY OF ENGINEERING AND SURVEYING
ENG4111/4112 Research Project
PROJECT SPECIFICATION
FOR: Leigh Hansen
TOPIC: Quantifying the reduction in hydraulic conductivity of
disturbed soil columns as a function of the salinity and
sodicity of applied water.
SUPERVISOR: Prof Steven Raine/Mr Erik Schmidt
SPONSORHSIP: National Centre of Engineering in Agriculture/Faculty of
Engineering and Surveying
PROJECT AIM: To determine the electrolyte threshold in soils.
PROGRAMME: (Issue A, date 23/03/09)
5. Evaluate the reduction in Ksat for nine soils across a range of EC/SAR water combinations
Prepare soils by crushing and sieving the samples to the recommended standard size.
Conduct short column saturated hydraulic conductivity tests on soils by preparing water solutions at varying concentrations of sodium and calcium and treat each soil column (five columns per soil). Each soil column has a Pre-Treatment (stable concentration) and Treatment water applied to it.
Analyse data determining the relative hydraulic conductivity of each soil. 2. Evaluate the factors influencing the reduction in Ksat within the soil columns
Perform a particle size analysis on the selected soils to identify relationships with the saturated hydraulic conductivity
Conduct long column saturated hydraulic conductivity tests on selected soils using selected water quality treatments;
Analyse data and model the results for each soil. Compare results to short column tests identifying any discrepancies;
If appropriate, evaluate the soil chemistry at different locations in the columns.
AGREED (student) (supervisor)
Date: / / 2009 Date: / / 2009
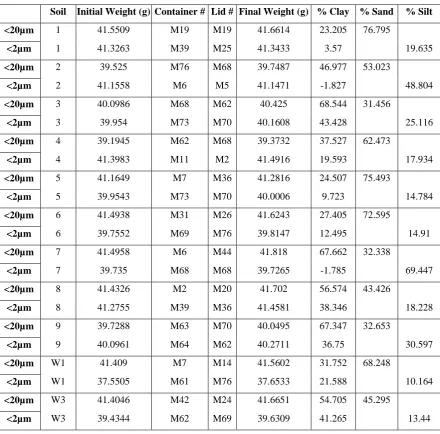
Table B.1 Particle Size Analysis Data
Soil Initial Weight (g) Container # Lid # Final Weight (g) % Clay % Sand % Silt
<20µm 1 41.5509 M19 M19 41.6614 23.205 76.795
<2µm 1 41.3263 M39 M25 41.3433 3.57 19.635
<20µm 2 39.525 M76 M68 39.7487 46.977 53.023
<2µm 2 41.1558 M6 M5 41.1471 -1.827 48.804
<20µm 3 40.0986 M68 M62 40.425 68.544 31.456
<2µm 3 39.954 M73 M70 40.1608 43.428 25.116
<20µm 4 39.1945 M62 M68 39.3732 37.527 62.473
<2µm 4 41.3983 M11 M2 41.4916 19.593 17.934
<20µm 5 41.1649 M7 M36 41.2816 24.507 75.493
<2µm 5 39.9543 M73 M70 40.0006 9.723 14.784
<20µm 6 41.4938 M31 M26 41.6243 27.405 72.595
<2µm 6 39.7552 M69 M76 39.8147 12.495 14.91
<20µm 7 41.4958 M6 M44 41.818 67.662 32.338
<2µm 7 39.735 M68 M68 39.7265 -1.785 69.447
<20µm 8 41.4326 M2 M20 41.702 56.574 43.426
<2µm 8 41.2755 M39 M36 41.4581 38.346 18.228
<20µm 9 39.7288 M63 M70 40.0495 67.347 32.653
<2µm 9 40.0961 M64 M62 40.2711 36.75 30.597
<20µm W1 41.409 M7 M14 41.5602 31.752 68.248
<2µm W1 37.5505 M61 M76 37.6533 21.588 10.164
<20µm W3 41.4046 M42 M24 41.6651 54.705 45.295
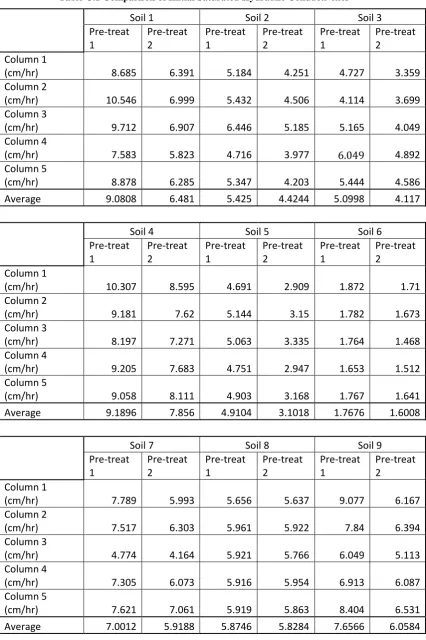
Table C.1 Comparison of Initial Saturated Hydraulic Conductivities
Soil 1 Soil 2 Soil 3
Pre-treat 1 Pre-treat 2 Pre-treat 1 Pre-treat 2 Pre-treat 1 Pre-treat 2 Column 1
(cm/hr) 8.685 6.391 5.184 4.251 4.7