Home Office Statistical Bulletin
The Research, Development and Statistics Directorate exists to improve policy making, decision taking and practice in support of the Home Office purpose and aims, to provide the public and Parliament with information necessar y for informed debate and to publish information for future use.
Statistical Bulletins are produced by the Research, Development and Statistics Directorate. For further copies contact:
s d r / k u . v o g . e ci ff o e m o h . w w w
© Crown Copyright 2008 ISSN 1358-510X
Young people and crime:
findings from the 2006 Offending,
Crime and Justice Survey
Stephen Roe and Jane Ashe
Acknowledgements
Many people have been involved in the 2006 Offending, Crime and Justice Survey, from its design through to the production of this report. The efforts of everyone involved are appreciated by the authors.
Special thanks are due to John Flatley and Alison Walker who provided advice throughout the production of this report, and to Sian Moley, Rachel Murphy and Alison Patterson, who provided invaluable assistance in data checking.
We are also grateful to all the research teams and interviewers at the National Centre for Social Research and BMRB Social Research, and to the members of the public who kindly agreed to take part in this survey.
Contents
Acknowledgements 2
List of figures and tables 4
Summary 6
1. Introduction 8
Aims of the survey 8
The Offending, Crime and Justice Survey design 8
2. Extent of offending 10
Extent of offending in the last 12 months 11
Changes over time 13
Other offences 14
3. Anti-social behaviour 24
Extent of anti-social behaviour 24
4. Personal victimisation 28
Extent of personal victimisation 28
List of figures and tables
Chapter 2 Extent of Offending
Figure 2.1 Frequent offending amongst 10- to 25-year-olds who committed each offence category, 2006 OCJS
Figure 2.2 Proportion of 10- to 25-year-olds committing an offence in the last 12 months, by sex, 2006 OCJS
Figure 2.3 Proportion of 12- to 25-year-olds buying or selling stolen goods in the last 12 months, by offending status, 2006 OCJS
Table 2.1 Offending in the last 12 months by core offence type, age and sex
Table 2.2 Frequency of offending in the last year among those who had committed each offence
Table 2.3 Proportion of last 12 months offenders defined as serious/frequent
Table 2.4 Offending in the last 12 months by age and sex
Table 2.5 Serious and frequent offending in the last 12 months by age and sex
Table 2.6 Trends in offending in the last 12 months, by age group
Table 2.7 Proportion of 10- to 25-year olds carrying a knife in the last 12 months
Table 2.8 Details of knives carried in the last 12 months
Table 2.9 Proportion of 12- to 25-year olds buying/selling stolen goods in the last 12 months
Chapter 3 Anti-social behaviour
Figure 3.1 Proportion of 10- to 25-year olds who committed anti-social behaviour in the last 12 months, by offending status, 2006 OCJS
Table 3.1 Prevalence of anti-social behaviours in the last 12 months, by age and sex
Table 3.2 Proportion of 10- to 25-year olds who committed anti-social behaviour in the last 12 months, by offending status and by age
Chapter 4 Personal victimisation
Figure 4.1 Proportion of offenders who were victims in the last 12 months, by age
,
2006 OCJSFigure 4.2 Proportion of victims who offended in the last 12 months, by age,
2006 OCJS
Table 4.1 Proportion of young people who were victims once or more in the last 12 months, by age and sex
Table 4.2 Proportion of offenders who were victims in the last 12 months, by age
Table 4.3 Proportion of victims who offended in the last 12 months, by age
Table 4.4 Where the incident took place, by age of victim
Table 4.5 How well victim knew perpetrator(s)
Summary
This report presents the headline findings from the 2006 Offending, Crime and Justice Survey (OCJS). It describes levels and trends in youth offending, anti-social behaviour (ASB) and victimisation among young people aged from 10 to 25 living in private households in England and Wales.
The focus of the survey is on the 20 core offences that are covered in the most detail. Although all of these core offences are legally defined offences, many of the cases identified by the OCJS will not have been serious enough to come to police attention.
The findings from the 2006 OCJS showed that the majority of young people were law-abiding.
• Over three-quarters (78%) of young people aged from 10 to 25 had not committed any of the 20 core offences covered by the survey in the last 12 months.
Amongst those that did break the law, many did so only occasionally or committed relatively trivial offences.
• Just over a fifth (22%) of young people aged from 10 to 25 reported that they had committed at least one of the 20 core offences in the previous 12 months.
• Six per cent of 10- to 25-year-olds had committed an offence six or more times in the past 12 months and were classified as frequent offenders.
• Ten per cent of 10- to 25-year-olds had committed at least one of the serious offences measured in the survey.
• These groups of serious and frequent offenders overlapped so that four per cent of 10- to 25-year-olds were both frequent and serious offenders while one per cent had committed serious offences frequently.
• The most commonly reported offence categories were assault (committed by 12% overall within which assault with injury and without injury were each committed by 8%) and other thefts (10%). Criminal damage (4%), drug selling offences (3%) and vehicle-related thefts (2%) were less common while only one per cent or less had committed burglary or robbery in the last 12 months.
There has been no change in levels of offending (including serious and frequent offending) since the survey started in 2003.
Just over a fifth (22%) of young people aged from 10 to 25 had committed at least one of the four anti-social behaviours measured in the OCJS in the last 12 months.
Those who offended were also likely to commit anti-social behaviour.
anti-social behaviours measured in the OCJS in the previous 12 months compared to 15 per cent of non-offenders.
Offenders were also more likely to be victims.
• Half (50%) of those who had committed any offence in the previous 12 months had also been victims of a personal crime in the same time period compared to about a fifth (19%) of those who had not committed any offence.
Other offences (including carrying weapons) are also included in the survey but are asked about in less detail. Only a small minority (3%) of young people reported carrying a knife with them in the previous 12 months.
Being noisy or rude in public (13%) and behaving in a way that caused a neighbour to complain (11%) were the most common anti-social behaviours committed. Graffiti and racial/religious motivated abuse were relatively rare (4% and 2% respectively).
The peak age of offending was 14 to 17 and the peak age for committing ASB was 14 to 15. Males were more likely than females to have offended and to have committed ASB in the previous 12 months.
Younger respondents aged from 10 to 15 were more likely than those aged 16 to 25 to report being a victim of a personal crime. Many of the incidents experienced by younger
respondents took place at school or college and would be unlikely to come to the attention of the police.
• Just over a quarter (26%) of young people aged from 10 to 25 had been a victim of either personal theft or of assault in the last 12 months.
• 10- to 15-year-olds were more likely to have been a victim of a personal crime in the past 12 months than 16- to 25-year-olds.
• The most common location for victimisation incidents amongst 10- to 15-year-olds was in school or college. For 16- to 25-year-olds incidents were generally most likely to take place at a pub, bar or nightclub or in the street.
1 Introduction
This bulletin presents the headline findings from the 2006 Offending, Crime and Justice Survey. It focuses on levels and trends in youth offending, anti-social behaviour and victimisation among young people aged from 10 to 25 living in private households in England and Wales. Comparisons are made, where relevant, with the results from previous waves of the OCJS. The survey was conducted between 2003 and 2006 and reports from previous surveys can be found on the Home Office RDS website at
http://www.homeoffice.gov.uk/rds/offending_survey.html. These reports are restricted to cross-sectional analysis from each round of the survey. The Home Office have recently commissioned longitudinal analyses of cases included in the 2003 to 2006 OCJS and no fresh data collection is planned until the results of this work are available.
Aims of the survey
Self-report offending surveys, such as the OCJS, are primarily designed to provide a better measure of the extent and nature of offending than can be obtained through official records. Data from the criminal justice agencies only provide a partial measure of offending because many offenders (and offences) are never formally processed. Self-report offending surveys ask people directly about their offending and therefore include offenders and offences that are not dealt with by the criminal justice system. They also enable patterns of offending and the factors associated with different forms of offending behaviour to be examined. However, there are some limitations and key methodological issues that need to be considered in interpreting the findings presented in this report. These are described in Box 1.1.
The Offending, Crime and Justice Survey design
The 2006 OCJS sample comprised ‘panel’ respondents, who had been interviewed in one or more previous waves of the survey, and an additional ‘fresh’ sample of 10- to 25-year-olds, who had not been interviewed before. The total sample in 2006 consisted of 4,554 panel respondents followed up from previous waves of the survey and 799 new respondents in the fresh sample, resulting in 5,353 interviews overall. The analysis for this report focuses on 10- to 25-year-olds and therefore excludes 402 panel respondents who were aged over 25 at the time of their 2006 interview.
As in previous years, data for the 2006 survey were collected by Computer-Assisted Personal Interviewing (CAPI), with around half the interview (the more sensitive questions) being conducted via respondent self-completion (Computer-Assisted Self-Interviewing or CASI). The OCJS was one of the first large-scale surveys in Britain to utilise audio-CASI, whereby respondents were able to listen to questions and possible answers via headphones, thus ensuring the survey was accessible to younger respondents and others with literacy problems. In addition, this method improved confidentiality as only the respondent could hear the questions being asked. This feature was used for the key self-reported offending sections.
Box 1.1 Key methodological issues
The OCJS was designed to take on board lessons from previous self-report offending surveys and incorporates some innovative techniques to improve the quality of the data collected. However, it is subject to the following design and methodological issues which should be considered when interpreting the findings.
Sampling variability. A sample, as used in the OCJS, is a small-scale representation of the population from which it is drawn. As such, the sample may produce estimates that differ from the figures that would have been obtained if the whole population had been interviewed. The size of the difference depends on the sample size, the size of the estimate and the design of the survey. Sampling variability is also taken into account in tests of statistical significance. Throughout this report differences are reported which are statistically significant at the five per cent level (i.e. the level at which there is a one in twenty probability of an observed difference being solely due to chance) unless otherwise specified.
Non-response bias. Despite the high response rate (85% for the panel sample; 67% for the fresh), it may be that non-respondents differ in key respects from those who took part. For example, those with particularly chaotic lifestyles or more serious offenders might be difficult to contact and more likely to refuse.
Exclusions from the sample. The results relate to the general household population aged from 10 to 25 only. People in institutions (including prisons) or who are homeless are not covered in the OCJS sample. As such there will be relatively few ‘serious’ offenders included in the sample.
Offence coverage. The survey does not cover all offences. In particular very serious offences including homicide and sexual offences are omitted. The main focus of the OCJS was on the 20 core offences, and the wording of these questions was carefully considered to reflect legal definitions in simple, understandable language which was suitable for a survey including respondents aged as young as ten.
2
Extent of offending
This chapter examines the extent and trends of offending among young people aged from 10 to 25 in the private household population in England and Wales. The focus is on the 20 core offences that are covered in most detail in the Offending, Crime and Justice Survey. Information about other offences which are included in the survey but in less detail, for instance carrying weapons, racially/religiously motivated assault and handling stolen goods, are also presented in this chapter.
The 20 core offences are grouped into the following offence categories.
Property-related offences
• Burglary: domestic burglary; commercial burglary.
• Vehicle-related thefts: theft of a vehicle; theft of parts off outside of a vehicle; theft of items inside a vehicle; attempted theft of a vehicle; attempted theft from a vehicle.
• Other thefts: theft from place of work; theft from school; theft from shop; theft from the person; miscellaneous thefts.
• Criminal damage: damage to a vehicle; damage to other property.
Violent offences
• Robbery: robbery of an individual; robbery of a business.
• Assault: assault resulting in injury; non-injury assault.
Drug selling
• Selling drugs: selling Class A drugs; selling other drugs.
Although the core offences all pertain to legal offences, some of the incidents reported to interviewers, while unlawful, will be relatively minor transgressions (e.g. a low value theft from the workplace or a child stealing a small item from school).1 It is less likely that such incidents will come to police attention and those which do may not result in a formal sanction2.
Where the term ‘offender’ is used throughout this report, it refers to young people who have committed at least one of the 20 core offences.
In order to distinguish between young people who occasionally transgress and those who may have more problematic patterns of offending, this chapter also identifies frequent offenders and those committing more serious offences.
1
There is value in collecting information about lower level offending or offending which is less likely to be detected by the police. Exploring the full range of offending behaviour can throw light on what differentiates serious and frequent offenders.
2
Guidance for police officers working in schools, issued in July 2007, states that ‘it remains the responsibility of school managers and staff, not police officers, to deal with and record behavioural incidents involving children and young people on a school site in the first instance’. See Annex E at
Frequent offenders; those young people who committed six or more offences, including the less serious, in the last 12 months.3
Serious offenders include those young people who committed one or more of the following offences in the last 12 months4:
- theft of a vehicle; - burglary;
- robbery;
- theft from the person; - assault resulting in injury; - selling Class A drugs.
Frequent serious offenders; those young people who committed a serious offence at least six times in the last 12 months.
Extent of offending in the last 12 months
Respondents were asked about offending in the 12 months prior to interview (interviews took place between January and October 2006).
Just over a fifth (22%) of young people aged from 10 to 25 reported that they had committed at least one of the 20 core offences in the previous 12 months (Table 2.1).
• Many young people who had committed an offence had offended on only a few occasions. Almost a third of young people (31%) who reported offending said they had committed only one offence in the last 12 months, and a further 28 per cent had committed two or three offences. Over a quarter (29%) of offenders (equating to 6% of all 10- to 25-year-olds) reported committing six or more offences in the last 12 months and were classified as frequent offenders (Table 2.2 and 2.5).
• Of those young people who had committed a core offence in the last 12 months, around half (49%) reported committing a serious offence (assault with injury, theft from a person, theft of a vehicle, burglary, selling Class A drugs or robbery) (Table 2.3). This equates to ten per cent of all 10- to 25-year-olds (Table 2.5).
• Nineteen per cent of offenders were both serious and frequent offenders and six per cent had committed a serious offence six or more times in the past 12 months (Table 2.3). Serious and frequent offenders represented four per cent of all 10- to 25-year-olds, while frequent serious offenders represented one per cent (Table 2.5).
• The most commonly reported offence categories were assault (committed by 12% of all 10- to 25-year-olds) and other thefts (10%). Criminal damage (4%), drug selling offences (3%) and vehicle-related thefts (2%) were less common. Only one per cent or less had
3
The decision to use six or more offences to define frequent offenders was based on the need to have a cut-off that differentiated offenders while also ensuring there were a sufficient number of frequent offenders for subsequent analysis.
4
committed burglary or robbery in the last 12 months (Table 2.1). These patterns reflect those seen in previous OCJS reports.
• More detailed figures for the individual offence types show that within the ‘Assault’ category, assaults with injury and assaults without injury were equally prevalent at eight per cent each. Within the ‘Other thefts’ category, thefts from work (4%) and from school (4%) were most common. The selling of Class A drugs (1%) was less common than selling other drugs (3%), a pattern which mirrors that seen in the previous surveys (Table 2.1).
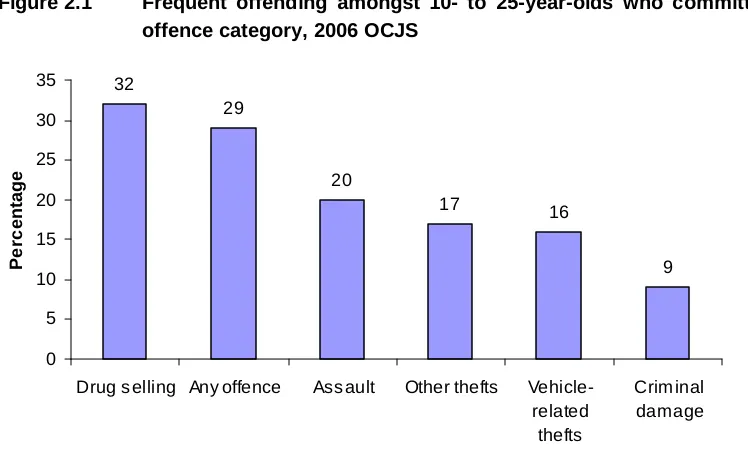
[image:12.595.91.465.341.570.2]Within offence categories, repeat offending was particularly common for selling drugs. Among the three per cent (Table 2.1) of young people who said they had sold drugs in the last 12 months, 82 per cent had done so more than once, with 32 per cent reporting doing so six or more times (Figure 2.1). Frequent offending was also relatively common for assault without injury and thefts from shops. Amongst those who had committed these offences, 18 per cent and 17 per cent respectively had done so six or more times in the last 12 months contributing to overall frequent offending levels of 20 per cent for assault and 17 per cent for other thefts (Figure 2.1, Table 2.2).
Figure 2.1 Frequent offending amongst 10- to 25-year-olds who committed each offence category, 2006 OCJS
32
29
20
17 16
9
0 5 10 15 20 25 30 35
Drug s elling Any offence Ass ault Other thefts Vehicle-related thefts
Crim inal damage
Pe
rc
entage
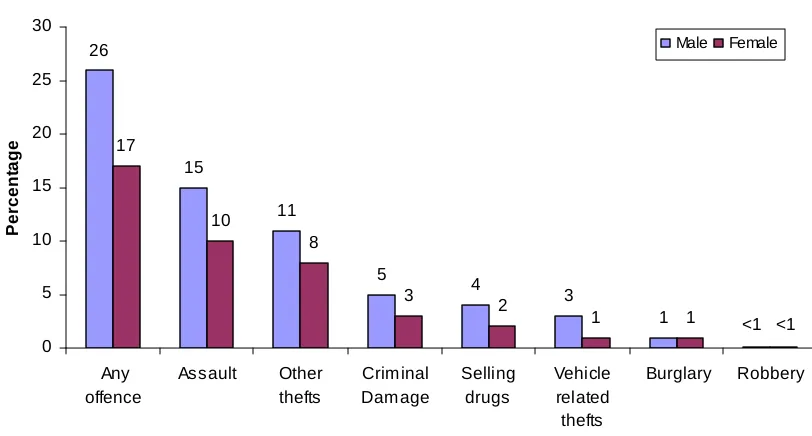
Figure 2.2 Proportion of 10- to 25-year-olds committing an offence in the last 12 months, by sex, 2006 OCJS
26 15 11 5 4 3 1 17 10 8 3 2
1 1 <1 <1
0 5 10 15 20 25 30 Any offence Assault Other thefts Crim inal Dam age Selling drugs Vehicle related thefts Burglary Robbery P e rcent a ge Male Female
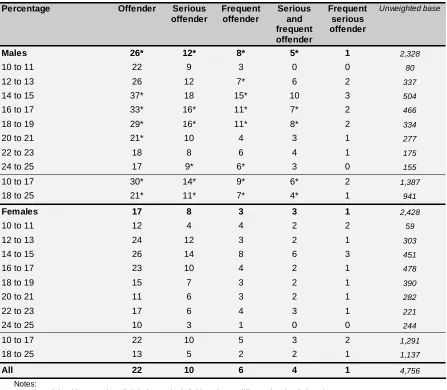
• Overall, 12 per cent of males aged from 10 to 25 said they had committed an offence designated as serious, eight per cent were classified as frequent offenders, and five per cent as serious and frequent offenders. These figures were lower for females (8%, 3% and 3% respectively, Table 2.5).
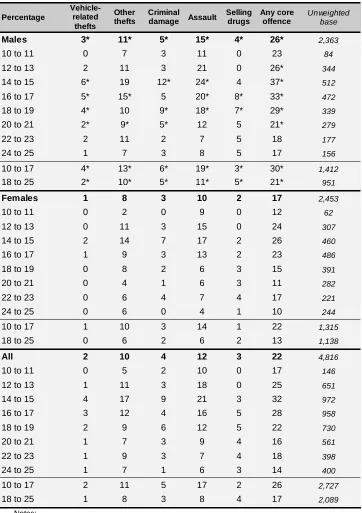
• Offending rates were higher amongst 10- to 17-year-olds compared to 18- to 25-year-olds overall and for each offence category apart from drug selling offences (committed by 4% of 18- to 25-year-olds and 2% of 10- to 17-year-olds, Table 2.1). The peak age of committing any offence was 14 to 17 overall and also for males while the peak age of offending amongst females ranged from 12 to 17 (Table 2.4).
Changes over time
The 2006 results on levels of offending were compared with those from previous waves of the survey. For comparative purposes, the 2004, 2005 and 2006 results are based on ‘fresh’ sample respondents only. 5
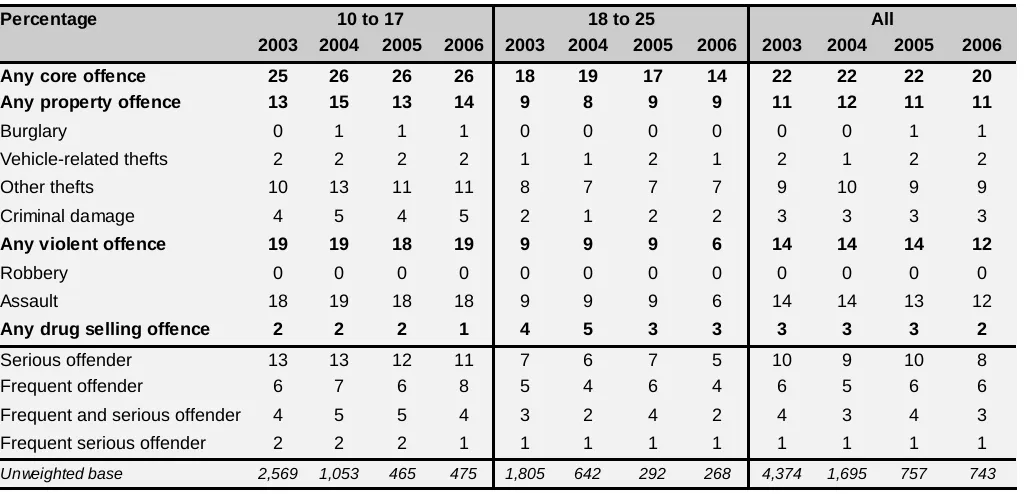
The proportion of young people who reported committing an offence showed no change across all four waves of the survey (the apparent difference between 2005 and 2006 was not statistically significant). This pattern held for all offence categories (Table 2.6).
• Similarly, there was no statistically significant change in the proportion of 10- to 17-year-olds and 18- to 25-year-17-year-olds who reported committing an offence (Table 2.6).
• The proportion of young people who were serious or frequent offenders also showed no change across all four waves (Table 2.6).
5
Other offences
In addition to asking respondents whether they had committed any of the twenty core offences covered in the survey, the OCJS also asked respondents about other activities that are classified as offences, these included having:
• carried a knife or gun with them for their own protection, for use in crimes or in case they got into a fight;
• physically attacked someone because of their skin colour, race or religion;
• bought or sold anything that they knew or thought had been stolen.
Carrying weapons
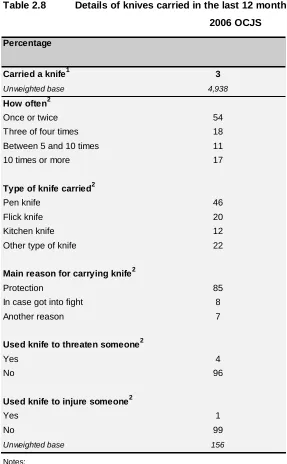
Overall, three per cent of young people had carried a knife with them in the last 12 months (Table 2.7). The majority (85%) of this group said the main reason for doing so was for protection; eight per cent said it was in case they got into a fight and seven per cent mentioned another reason (Table 2.8).
• Over half (54%) of the young people who had carried a knife in the last 12 months had only carried a knife once or twice during this period (Table 2.8).
• Amongst the three per cent of young people that had carried a knife, the most commonly carried knife was a pen knife (46%). The carrying of flick knives (20%) and kitchen knives (12%) was less common (Table 2.8).
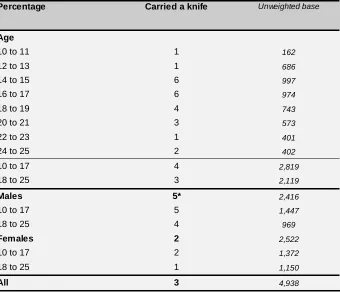
• Males were more than twice as likely than females to have carried a knife (5% versus 2%). For knife carrying the peak age was 14 to 17 (6% of this age group, Table 2.7).
• A very small minority of the three per cent of young people who had carried a knife reported using the knife to threaten or injure someone (4% and 1% respectively, Table 2.8).
Less than one per cent of 10- to 25-year-olds reported having carried a gun in the last 12 months.
Racially or religiously motivated assaults
The proportion of 10- to 25-year-olds who said they had physically attacked someone because of their skin colour, race or religion in the last 12 months (racially/religiously motivated assault) was relatively low, at less than one per cent. This was the same as the proportion found in both the 2004 and 2005 waves of the survey. (The 2006 OCJS also included questions on racial/religious abuse committed by respondents; see Chapter 3 on Anti-social behaviour).
Handling stolen goods
Overall, nineteen per cent of 12- to 25-year-olds had handled (bought or sold) stolen goods in the previous 12 months. Nineteen per cent had bought stolen goods and four per cent had sold stolen goods (Table 2.9).
• Similar to the pattern for offending, males were more likely than females to have handled stolen goods in the last 12 months (22% compared to 16%, Table 2.9).
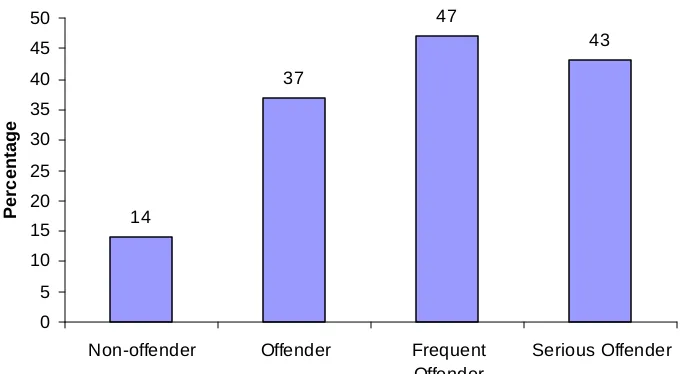
[image:15.595.91.431.274.461.2]• Offenders and, in particular, frequent or serious offenders were more likely than non-offenders to have handled stolen goods (37%, 47% and 43% compared to 14%, Figure 2.3, Table 2.9).
Figure 2.3 Proportion of 12- to 25-year-olds buying or selling stolen goods in the last 12 months, by offending status, 2006 OCJS
14
37
47
43
0 5 10 15 20 25 30 35 40 45 50
Non-offender Offender Frequent
Offender
Serious Offender
Perc
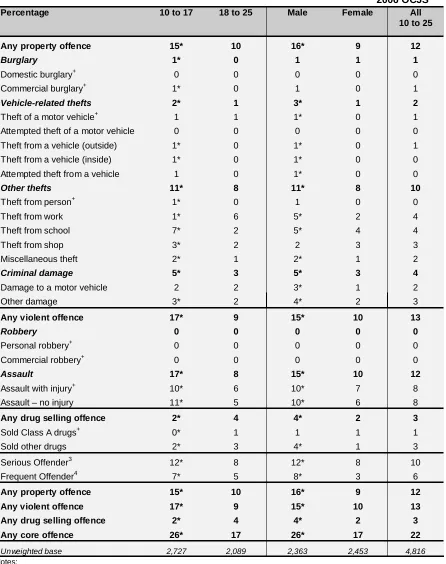
Table 2.1 Offending in the last 12 months by core offence type, age and sex
2006 OCJS
Percentage 10 to 17 18 to 25 Male Female All
10 to 25
Any property offence 15* 10 16* 9 12
Burglary 1* 0 1 1 1
Domestic burglary+ 0 0 0 0 0
Commercial burglary+ 1* 0 1 0 1
Vehicle-related thefts 2* 1 3* 1 2
Theft of a motor vehicle+ 1 1 1* 0 1
Attempted theft of a motor vehicle 0 0 0 0 0
Theft from a vehicle (outside) 1* 0 1* 0 1
Theft from a vehicle (inside) 1* 0 1* 0 0
Attempted theft from a vehicle 1 0 1* 0 0
Other thefts 11* 8 11* 8 10
Theft from person+ 1* 0 1 0 0
Theft from work 1* 6 5* 2 4
Theft from school 7* 2 5* 4 4
Theft from shop 3* 2 2 3 3
Miscellaneous theft 2* 1 2* 1 2
Criminal damage 5* 3 5* 3 4
Damage to a motor vehicle 2 2 3* 1 2
Other damage 3* 2 4* 2 3
Any violent offence 17* 9 15* 10 13
Robbery 0 0 0 0 0
Personal robbery+ 0 0 0 0 0
Commercial robbery+ 0 0 0 0 0
Assault 17* 8 15* 10 12
Assault with injury+ 10* 6 10* 7 8
Assault – no injury 11* 5 10* 6 8
Any drug selling offence 2* 4 4* 2 3
Sold Class A drugs+ 0* 1 1 1 1
Sold other drugs 2* 3 4* 1 3
Serious Offender3 12* 8 12* 8 10
Frequent Offender4 7* 5 8* 3 6
Any property offence 15* 10 16* 9 12
Any violent offence 17* 9 15* 10 13
Any drug selling offence 2* 4 4* 2 3
Any core offence 26* 17 26* 17 22
Unweighted base 2,727 2,089 2,363 2,453 4,816
Notes:
1. * indicates a significant difference between 10- to 17-year-olds and 18- to 25-year-olds and between males and females.
2. + indicates a serious offence.
3. Serious offences: those committing theft of a vehicle; burglary; robbery; theft from the person; assault resulting in injury; selling Class A drugs.
4. Frequent offenders are those committing six or more offences, of any type, in the last 12 months.
[image:16.595.77.523.85.649.2]Table 2.2 Frequency of offending in the last year among those who had committed each offence
2006 OCJS
Percentage Once Twice Three
times Four times Five times Six or more times Unweighted base
Vehicle-related thefts 48 20 8 4 5 16 93
Theft from work 37 26 11 2 10 14 171
Theft from school 46 30 7 2 6 10 286
Theft from shop 40 25 8 6 3 17 149
Miscellaneous thefts 44 24 12 4 8 8 80
Other thefts 40 21 9 6 7 17 522
Vehicle damage 76 9 3 3 1 8 89
Other damage 58 17 9 7 4 6 157
Criminal damage 57 17 9 4 4 9 207
Assault – with injury 57 14 9 4 5 11 441
Assault – no injury 47 18 11 3 4 18 446
Assault 39 20 10 6 4 20 652
Drug selling 18 15 18 11 6 32 155
Any core offence 31 16 12 7 5 29 1,046
Notes:
1. Based on respondents aged from 10 to 25 who reported committing each offence.
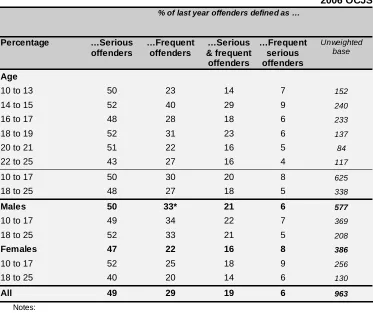
Table 2.3 Proportion of last 12 months offenders defined as serious/frequent
2006 OCJS
% of last year offenders defined as …
Percentage …Serious
offenders …Frequent offenders …Serious & frequent offenders …Frequent serious offenders Unweighted base Age
10 to 13 50 23 14 7 152
14 to 15 52 40 29 9 240
16 to 17 48 28 18 6 233
18 to 19 52 31 23 6 137
20 to 21 51 22 16 5 84
22 to 25 43 27 16 4 117
10 to 17 50 30 20 8 625
18 to 25 48 27 18 5 338
Males 50 33* 21 6 577
10 to 17 49 34 22 7 369
18 to 25 52 33 21 5 208
Females 47 22 16 8 386
10 to 17 52 25 18 9 256
18 to 25 40 20 14 6 130
All 49 29 19 6 963
Notes:
1. Based on respondents aged from 10 to 25 who reported committing any offence. 2. * indicates the figure for males is significantly higher than the figure for females.
[image:17.595.77.521.109.343.2] [image:17.595.77.450.399.712.2]Table 2.4 Offending in the last 12 months by age and sex 2006 OCJS Percentage Vehicle-related thefts Other thefts Criminal
damage Assault
Selling drugs Any core offence Unweighted base
Males 3* 11* 5* 15* 4* 26* 2,363
10 to 11 0 7 3 11 0 23 84
12 to 13 2 11 3 21 0 26* 344
14 to 15 6* 19 12* 24* 4 37* 512
16 to 17 5* 15* 5 20* 8* 33* 472
18 to 19 4* 10 9* 18* 7* 29* 339
20 to 21 2* 9* 5* 12 5 21* 279
22 to 23 2 11 2 7 5 18 177
24 to 25 1 7 3 8 5 17 156
10 to 17 4* 13* 6* 19* 3* 30* 1,412
18 to 25 2* 10* 5* 11* 5* 21* 951
Females 1 8 3 10 2 17 2,453
10 to 11 0 2 0 9 0 12 62
12 to 13 0 11 3 15 0 24 307
14 to 15 2 14 7 17 2 26 460
16 to 17 1 9 3 13 2 23 486
18 to 19 0 8 2 6 3 15 391
20 to 21 0 4 1 6 3 11 282
22 to 23 0 6 4 7 4 17 221
24 to 25 0 6 0 4 1 10 244
10 to 17 1 10 3 14 1 22 1,315
18 to 25 0 6 2 6 2 13 1,138
All 2 10 4 12 3 22 4,816
10 to 11 0 5 2 10 0 17 146
12 to 13 1 11 3 18 0 25 651
14 to 15 4 17 9 21 3 32 972
16 to 17 3 12 4 16 5 28 958
18 to 19 2 9 6 12 5 22 730
20 to 21 1 7 3 9 4 16 561
22 to 23 1 9 3 7 4 18 398
24 to 25 1 7 1 6 3 14 400
10 to 17 2 11 5 17 2 26 2,727
18 to 25 1 8 3 8 4 17 2,089
Notes:
1. Unweighted base varies slightly for each ‘definition’ due to different levels of ‘don’t know’ responses. 2. * indicates the figure for males is significantly higher/lower than for females in the same age group.
[image:18.595.76.438.89.602.2]Table 2.5 Serious and frequent offending in the last 12 months by age and sex
2006 OCJS
Percentage Offender Serious
offender
Frequent offender
Serious and frequent offender
Frequent serious offender
Unweighted base
Males 26* 12* 8* 5* 1 2,328
10 to 11 22 9 3 0 0 80
12 to 13 26 12 7* 6 2 337
14 to 15 37* 18 15* 10 3 504
16 to 17 33* 16* 11* 7* 2 466
18 to 19 29* 16* 11* 8* 2 334
20 to 21 21* 10 4 3 1 277
22 to 23 18 8 6 4 1 175
24 to 25 17 9* 6* 3 0 155
10 to 17 30* 14* 9* 6* 2 1,387
18 to 25 21* 11* 7* 4* 1 941
Females 17 8 3 3 1 2,428
10 to 11 12 4 4 2 2 59
12 to 13 24 12 3 2 1 303
14 to 15 26 14 8 6 3 451
16 to 17 23 10 4 2 1 478
18 to 19 15 7 3 2 1 390
20 to 21 11 6 3 2 1 282
22 to 23 17 6 4 3 1 221
24 to 25 10 3 1 0 0 244
10 to 17 22 10 5 3 2 1,291
18 to 25 13 5 2 2 1 1,137
All 22 10 6 4 1 4,756
Notes:
[image:19.595.76.523.94.484.2]Table 2.6 Trends in offending in the last 12 months, by age group
2006 OCJS
Percentage 10 to 17 18 to 25 All
2003 2004 2005 2006 2003 2004 2005 2006 2003 2004 2005 2006
Any core offence 25 26 26 26 18 19 17 14 22 22 22 20
Any property offence 13 15 13 14 9 8 9 9 11 12 11 11
Burglary 0 1 1 1 0 0 0 0 0 0 1 1
Vehicle-related thefts 2 2 2 2 1 1 2 1 2 1 2 2
Other thefts 10 13 11 11 8 7 7 7 9 10 9 9
Criminal damage 4 5 4 5 2 1 2 2 3 3 3 3
Any violent offence 19 19 18 19 9 9 9 6 14 14 14 12
Robbery 0 0 0 0 0 0 0 0 0 0 0 0
Assault 18 19 18 18 9 9 9 6 14 14 13 12
Any drug selling offence 2 2 2 1 4 5 3 3 3 3 3 2
Serious offender 13 13 12 11 7 6 7 5 10 9 10 8
Frequent offender 6 7 6 8 5 4 6 4 6 5 6 6
Frequent and serious offender 4 5 5 4 3 2 4 2 4 3 4 3
Frequent serious offender 2 2 2 1 1 1 1 1 1 1 1 1
Unweighted base 2,569 1,053 465 475 1,805 642 292 268 4,374 1,695 757 743
Notes:
1. Based on respondents aged from 10 to 25. 2004, 2005 and 2006 results based on fresh sample only. 2. Unweighted base numbers based on ‘any core offence’ data.
3. * indicates significant difference between surveys.
4. ‘0’ indicates less than 0.5% or no response in that particular category. No significance testing was undertaken where both figures were less than 0.5%.
Table 2.7 Proportion of 10- to 25-year olds carrying a knife in the last 12 months
2006 OCJS
Notes:
1. Based on respondents aged from 10 to 25.
2. Question asked: “In the last 12 months, have you carried a knife with you for your own protection, for use in crimes or in case you got into a fight?”.
3. * indicates significant difference between males and females.
Percentage Carried a knife Unweighted base
Age
10 to 11 1 162
12 to 13 1 686
14 to 15 6 997
16 to 17 6 974
18 to 19 4 743
20 to 21 3 573
22 to 23 1 401
24 to 25 2 402
10 to 17 4 2,819
18 to 25 3 2,119
Males 5* 2,416
10 to 17 5 1,447
18 to 25 4 969
Females 2 2,522
10 to 17 2 1,372
18 to 25 1 1,150
Table 2.8 Details of knives carried in the last 12 months
2006 OCJS
Notes:
1. Based on respondents aged from 10 to 25.
2. Based on respondents aged from 10 to 25 who reported carrying a knife for their own protection, for use in crimes or in case they got into a fight.
Percentage
Carried a knife1 3
Unweighted base 4,938
How often2
Once or twice 54
Three of four times 18
Between 5 and 10 times 11
10 times or more 17
Type of knife carried2
Pen knife 46
Flick knife 20
Kitchen knife 12
Other type of knife 22
Main reason for carrying knife2
Protection 85
In case got into fight 8
Another reason 7
Used knife to threaten someone2
Yes 4
No 96
Used knife to injure someone2
Yes 1
No 99
Table 2.9 Proportion of 12- to 25-year olds buying/selling stolen goods in the last 12 months
2006 OCJS
Notes:
1. Based on respondents aged from 12 to 25.
2. * indicates significant differences between males and females, and between offenders and non-offenders. 3. Non-offenders are those who reported committing none of the 20 core offences.
Percentage Buying Selling Buying or selling Unweighted base
Age
12 to 13 17 4 18 662
14 to 15 21 6 21 962
16 to 17 22 5 22 959
18 to 19 23 5 23 730
20 to 21 16 3 17 565
22 to 23 17 2 17 394
24 to 25 15 3 15 402
12 to 17 20 5 21 2,583
18 to 25 18 4 18 2,091
Males 22* 6* 22* 2,253
12 to 17 22 6 23 1,305
18 to 25 21 5 22 948
Females 16 3 16 2,421
12 to 17 18 4 18 1,278
18 to 25 14 2 15 1,143
Non-offender3 14 3 14 3,506
Offender 35* 10* 37* 1,065
Frequent offender 45* 16* 47* 297
Serious offender 42* 13* 43* 502
[image:23.595.92.535.111.451.2]3 Anti-social
behaviour
All crime can be thought of as anti-social but the term anti-social behaviour tends to be used to refer to a range of criminal and non-criminal activities, which are likely to cause harassment, alarm or distress and impact on people’s quality of life. However, people have different expectations and levels of tolerance and what one person may find offensive or distressing, another person might view as innocuous
.
Therefore attempting to measure anti-social behaviour is challenging. Anti-anti-social behaviour as measured by the OCJS covers:• being noisy or rude in a public place so that people complained or the individual got into
trouble with the police;
• behaving in a way that resulted in a neighbour complaining;
• graffiti in a public place (spraying paint or writing on a building);
• threatening or being rude to someone because of their race or religion (racial/religious
motivated abuse).
This chapter describes the extent of these four anti-social behaviours committed by young people aged from 10 to 25.
Extent of anti-social behaviour
Just over a fifth (22%) of young people aged from 10 to 25 had committed at least one of the four anti-social behaviours measured in the OCJS in the last 12 months (Table 3.1).
• Being noisy or rude in public (13%) and behaving in a way that caused a neighbour to complain (11%) were the most common anti-social behaviours committed. Graffiti and racial/religious motivated abuse were relatively rare (4% and 2% respectively, Table 3.1). This pattern reflects that found in the 2004 and 2005 OCJS.6
• Twenty-six per cent of males aged from 10 to 25 had committed at least one anti-social behaviour in the previous 12 months, a higher proportion than females (18%). This was true for each of the four anti-social behaviours with the exception of graffiti where similar levels were found for males and females (Table 3.1).
• Those aged between 10 and 17 were more likely than 18- to 25-year-olds to have committed any anti-social behaviour in the previous 12 months (27% compared to 18%). Ten- to 17-year-olds were also more likely to have committed each of the four anti-social behaviours with the exception of racial/religious motivated abuse where there was equally low prevalence among the two age groups (Table 3.1).
• The proportion of young people committing any anti-social behaviour at the age of 10 to 11 was 20 per cent, with anti-social behaviour peaking in early adolescence at the age of 14 to 15 (36%). The level then decreased to around one in five of those aged from 18 to 23 and 13 per cent of those aged from 24 to 25 (Table 3.1). This pattern was consistent with that found in the 2005 and 2004 OCJS findings. The peak age of 14 to 15 for committing any anti-social behaviour was evident for both males and females.
6
Just over half of both offenders (52%) and frequent offenders (53%) and 58 per cent of serious offenders in the 10 to 25 age group had committed anti-social behaviour in the previous 12 months compared to 15 per cent of non-offenders (Figure 3.1, Table 3.2).
• Conversely, around half (49%) of those aged from 10 to 25 who committed anti-social behaviour had also committed a core offence in the last 12 months. This compares with 13 per cent of those who had not committed any anti-social behaviour. Serious and frequent offending was also higher amongst those who had committed anti-social behaviour in the past 12 months (Table 3.3).
[image:25.595.103.449.335.531.2]• Younger offenders aged from 10 to 17 were more likely than older offenders aged from 18 to 25 to have also committed anti-social behaviour in the past 12 months (Table 3.2).
Figure 3.1 Proportion of 10- to 25-year olds who committed anti-social behaviour in the last 12 months, by offending status, 2006 OCJS
15
52
58
53
0 10 20 30 40 50 60 70
Non-offender Offender Serious Frequent
Pe
rc
e
n
ta
g
Table 3.1 Prevalence of anti-social behaviours in the last 12 months, by age and sex
2006 OCJS
Percentage Any ASB2 Noisy/rude Neighbour
complaint
Graffiti Racial/religious
abuse
Unweighted base
Males *26 *17 *13 4 *3 2,360
Females 18 10 9 3 1 2,455
Age
10-11 20 10 13 2 2 151
12-13 22 13 11 5 0 662
14-15 36 26 14 12 4 964
16-17 28 19 12 6 3 951
18-19 22 15 10 2 2 731
20-21 18 9 10 2 2 565
22-23 19 9 9 1 1 396
24-25 13 5 9 0 2 395
10-17 *27 *17 *13 *6 2 2,728
18-25 18 10 10 1 2 2,087
All 22 13 11 4 2 4,815
Notes:
1. Based on respondents aged from 10 to 25.
2. ASB measure includes noisy/rude, neighbour complaint, graffiti and racial/religious abuse. 3. * indicates significant differences between groups.
4. ‘0’ indicates less than 0.5% or no response in that particular category.
5. Unweighted base numbers based on ‘Any ASB’ data.
Table 3.2 Proportion of 10- to 25-year olds who committed anti-social behaviour in the last 12 months, by offending status and by age
2006 OCJS
Notes:
1. Based on respondents aged from 10 to 25.
2. Non-offenders are those who reported committing none of the 20 core offences.
3. * indicates significant differences between offenders and non-offenders aged 10 to 25 and between offenders aged 10 to 17 and 18 to 25.
Percentage ASB Unweighted base
10 to 17
Non-offender2 17 1,913
Offender 57* 731
Serious offender 65* 182
Frequent offender 63* 202
18 to 25
Non-offender2 13 1,693
Offender 44* 362
Serious offender 48* 166
Frequent offender 49* 100
All 10 to 25
Non-offender2 15 3,606
Offender 52* 1,093
Serious offender 58* 508
Table 3.3 Proportion of 10- to 25-year olds who offended in the last 12 months, by whether committed anti-social behaviour or not and by age
2006 OCJS
Percentage 10 to 17 18 to 25 All 10 to 25
ASB Non-ASB ASB Non-ASB ASB Non-ASB
Offender 54 15 42 12 49 13
Serious offender 30 6 22 5 26 5
Frequent offender 18 4 10 3 14 4
Unweighted base 674 1,846 357 1,668 1,031 3,814
Notes:
4 Personal
victimisation
This chapter examines the extent and nature of young people's personal victimisation in the last 12 months. The main focus is on personal crimes among those aged from 10 to 15 as the national victimisation survey in England and Wales, the British Crime Survey (BCS), does not currently provide information on personal victimisation for this age group, though this is being considered.7
The definition of personal victimisation is shown in Box 4.1 and is broadly consistent with the British Crime Survey. However, victimisation covered by the OCJS is less detailed than in the BCS, and uses questions adjusted in light of the OCJS feasibility studies to be suitable for asking younger respondents. Importantly, the context of the questions differs between the two surveys. This means it is not possible to draw direct comparisons between the OCJS and the BCS measures of victimisation.
Box 4.1: Personal victimisation measured in the OCJS
Personal thefts Assaults
Robbery8 Assault resulting in injury Theft from the person9 Assault without injury Other personal thefts10
Extent of personal victimisation
Just over a quarter (26%) of young people aged from 10 to 25 had been a victim of either personal theft or of assault in the last 12 months (Table 4.1).
• Males were more likely than females to have been a victim of a personal crime in the last 12 months (31% versus 21%, Table 4.1).
• Those aged between 10 and 15 were more likely to have been a victim than 16- to 25-year-olds (30% versus 24%). The difference between the two age groups was statistically significant for males but not for females (Table 4.1).
Twelve per cent of young people had experienced at least one personal theft (robbery, theft from the person, other personal thefts) in the last 12 months.
• The most common type of personal theft was other personal theft (where there is no direct contact between the victim and offender) at seven per cent (Table 4.1).
• Males aged from 10 to 15 were more likely than those aged 16 to 25 to have been a victim of all personal theft categories, except for robbery which was rare for both groups.
7 See http://www.homeoffice.gov.uk/rds/pdfs08/bcs-consultation-0508.pdf. 8
Definition of robbery: when force or the threat of force is used either during or immediately prior to a theft or attempted theft. Due to the small number of robbery incidents these are not analysed in detail in the nature section.
9
Definition of theft from the person: thefts (including attempts) of an item directly from the person (e.g. an item that the victim was carrying or wearing). Physical force or threats are not used.
10 Definition of other personal theft: theft of personal property where there is no direct contact between victim and
There were no differences in the victimisation rates between younger and older females for personal thefts (Table 4.1).
Seventeen per cent of 10- to 25-year-olds had experienced an assault.
• Males were more likely than females to have been a victim of an assault (22% versus 12%) and 10- to 15-year-olds were more likely to have experienced an assault in the previous 12 months than 16- to 25-year-olds (22% versus 14%). This pattern is true for both assault with injury and without injury (Table 4.1).
Offenders were more likely to be victims of crime than non-offenders.
• Half (50%) of those who had committed any offence in the previous 12 months had also been victims of a personal crime in the same period compared to about a fifth (19%) of those who had not committed any offence (Figure 4.1, Table 4.2).
• Conversely, levels of offending were higher amongst those who had been a victim (42%) compared with those who had not been a victim in the previous 12 months (14%) (Figure 4.2, Table 4.3).
• These patterns held for both 10 to 15 year olds and 16 to 25 year olds (Tables 4.2 and 4.3).
Figure 4.1 Proportion of offenders who were victims in the last 12 months 2006 OCJS
0% 10% 20% 30% 40% 50% 60% 70% 80% 90% 100%
Offender Non-offender
P
er
cen
tag
e
Non-victim
Figure 4.2 Proportion of victims who offended in the last 12 months 2006 OCJS
Nature of personal victimisation
The 2006 OCJS collected details about the nature of incidents victims had experienced. There were two sets of questions – one pertaining to personal theft incidents and another covering assault. Victims who had experienced more than one offence type within the two groupings were asked about one offence type only, selected in priority order11. In addition, respondents who had experienced the same offence type on more than one occasion in the last 12 months were only asked about the most recent incident.
• For victims aged from 10 to 15 the most commonly cited location for any personal incident was at school/college (for example, 60% for both theft from a person and for assault without injury). For victims aged from 16 to 25 incidents were generally most likely to take place at a pub, bar or nightclub or in the street (Table 4.4).
• Assault victims aged from 10 to 15 were more likely than those aged from 16 to 25 to know their perpetrator (88% compared with 53% for assault with injury, Table 4.5).
• For incidents where the perpetrator was known, the most common perpetrators of assault against respondents aged from 10 to 15 were other pupils (56% for assault with injury and 60% for assault without injury), followed by friends (24% for assault with injury and 28% for assault without injury). For those aged from 16 to 25, the most common perpetrators were someone who the respondent had seen around (25% for assault with injury and 22% for assault without injury) or friends (21% for assault with injury and 29% for assault without injury, Table 4.6).
• The findings above reinforce the point that the incidents reported within the OCJS include a significant number of incidents, particularly amongst the younger 10 to 15 year old age range, that are minor transgressions and, while technically illegal, it is unlikely that such incidents will come to police attention.
11 The priority order for personal theft incidents was robbery, theft from the person and other personal thefts. For
assault incidents the priority order was assault with injury and assault without injury. For example, a respondent who had been the victim of a robbery and a theft from the person would only be asked about the robbery incident.
0% 10% 20% 30% 40% 50% 60% 70% 80% 90% 100%
Victim Non-victim
Per
c
en
ta
ge
Non-of fender
Table 4.1 Proportion of young people who were victims once or more in the last 12 months, by age and sex
2006 OCJS Percentage
10 to 15 16 to 25 Male Female
Male 10 to 15
Male 16 to 25
Female 10 to 15
Female 16 to 25
All 10 to 25
Any personal theft 13 11 13* 10 17* 11 8 11 12
Robbery 1 2 2* 1 2 3 1 1 2
Theft from the person 5 5 5 4 7* 5 3 5 5
Other personal thefts 8 7 8 6 11* 6 5 7 7
Any assault 22* 14 22* 12 28* 18 15* 11 17
Assault (no injury) 16* 9 14* 8 21* 10 11* 7 11
Assault (with injury) 10* 8 12* 6 14 11 7 5 9
Any personal
victimisation 30* 24 31* 21 38* 27 22 20 26
Unweighted base 1,851 3,100 2,426 2,525 973 1,453 878 1,647 4,951
Notes:
1. Based on all respondents aged from 10 to 25.
2. * indicates significant differences within the columns e.g. differences between 10- to 15-year-olds and 16- to 25-year olds.
Table 4.2 Proportion of offenders who were victims in the last 12 months, by age 2006 OCJS
Percentage 10 to 15 16 to 25 All 10 to 25
Offender Non-offender2 Offender Non-offender2 Offender Non-offender2
Victim 55* 22 47* 18 50* 19
Non-victim 45 78 53 82 50 81
Unweighted base 485 1,284 647 2,400 1,132 3,684
Notes:
1. Based on all respondents aged from 10 to 25.
2. Non-offenders are those who reported committing none of the 20 core offences. 3. * indicates significant difference between offenders and non-offenders.
Table 4.3 Proportion of victims who offended in the last 12 months, by age
2006 OCJS
Percentage 10 to 15 16 to 25 All 10 to 25
Victim Non-victim Victim Non-victim Victim Non-victim
Offender 46* 16 39* 14 42* 14
Non-offender2 54 84 61 86 58 86
Unweighted base 489 1,280 699 2,348 1,188 3,628
Notes:
1. Based on all respondents aged from 10 to 25.
Table 4.4 Where the incident took place, by age of victim
2006 OCJS
Percentage Theft from the
person
Other personal
thefts Assault with injury Assault without injury
10 to 15 16 to 25 10 to 15 16 to 25 10 to 15 16 to 25 10 to 15 16 to 25
Home 12 3 33 27 9 9 12 9
Someone else’s home2 3 1 7 6 1 5 6 6
School/college 60 14 45 16 51 7 60 6
Work 0 9 0 12 0 6 0 6
Pub/bar/nightclub 0 24 1 9 1 31 0 32
Public place3 0 8 4 2 1 5 1 3
Shop/shopping centre 5 8 0 5 2 2 0 5
Street 14 18 4 4 23 21 18 20
Car park 0 0 0 4 0 0 0 0
Park/other open space 4 1 4 4 8 7 1 6
Public transport 0 7 0 1 1 4 0 1
At station 1 2 1 3 3 2 0 5
Other 1 5 2 8 1 0 0 3
Unweighted base 66 101 133 172 195 271 159 177
Notes:
1. Based on incidents against 10- to 25-year-olds who were victimised in the last 12 months. 2. Someone else’s home includes home of perpetrator.
Table 4.5 How well victim knew perpetrator(s)
2006 OCJS
Percentage Assault with injury Assault without injury
10 to 15 16 to 25 10 to 15 16 to 25
How well perpetrator known
Knew at least one well 58 28 60 31
Knew at least one by name 22 15 19 13
Knew at least one by sight 8 10 9 8
Not at all 12 47 12 48
Unweighted base 196 272 159 180
Notes:
[image:33.595.91.444.291.525.2]1. Based on incidents against 10- to 25-year-olds who were victimised in the last 12 months.
Table 4.6 Relationship between victim and perpetrator(s) where known 2006 OCJS
Percentage Assault with injury Assault without injury
10 to 15 16 to 25 10 to 15 16 to 25
Perpetrator
Partner of victim 0 14 1 14
Sibling 10 3 11 1
Parent of victim 1 5 1 3
Other relative 1 1 0 7
Friend of victim 24 21 28 29
Pupil (same or other school) 56 18 60 10
Neighbour 7 5 2 3
Someone seen around 8 25 5 22
Someone at work 0 9 0 2
Teacher 0 0 0 0
Another friend/relative 0 3 0 0
Other 0 2 0 8
Unweighted base 171 159 140 100
Notes:
1. Based on incidents against 10- to 25-year-olds who were victimised in the last 12 months and who knew their perpetrator(s) in some way.
2. More than one response could be given.