The circumstances of
persistently poor families
with children: Evidence
from the Families and
Children Study (FACS)
Matt Barnes, Anne Conolly and Wojtek TomaszewskiFirst Published 2008.
ISBN 978 1 84712 366 4
Contents
Acknowledgements ... ix
The Authors ... x
Glossary ... xi
A guide to methods used in the charts and tables ...xiii
Summary ...1
1 Introduction ...5
1.1 Poverty among families with children ...5
1.2 Aims of the report ...6
1.3 The Families and Children Study ...7
2 The incidence of persistent poverty among families with children ...11
2.1 Using low income as an indicator of poverty ...11
2.2 Measuring total family income in FACS ...13
2.3 Measuring income poverty in FACS ...15
2.4 Measuring persistent poverty in FACS ...16
2.5 Summary ...18
3 The financial circumstances of persistently poor families with children ...19
3.1 Income levels and sources of income ...19
3.2 Current and savings accounts ...21
3.3 Borrowing and debt ...23
3.4 Managing family money ...26
3.5 Financial worries now and in the future ...28
4 The outcomes for children living in persistently poor families ...33
4.1 Be healthy ...35
4.2 Stay safe ...37
4.3 Enjoy and achieve ...39
4.4 Making a positive contribution ...41
4.5 Achieve economic well-being ...43
4.6 Multiple negative outcomes ...46
4.7 Summary ...48
5 The factors associated with persistent poverty among families with children ...51
5.1 Work status and attitudes to work ...51
5.2 The risk of persistent poverty ...58
5.3 Modelling the key risk factors of poverty persistence ...60
5.4 Summary ...67
6 Summary and discussion of main findings ...69
Appendix Logistic regression statistics ...73
References ...81
List of tables
Table 2.1 Longitudinal poverty status of families with children, 2001/04 ....18Table 4.1 Longitudinal poverty status of children, 2001/04 ...34
Table 5.1 Characteristics of families with children that are statistically significantly associated with the odds of persistent, rather than temporary, poverty ...63
Table A.1 The association of socio-demographic and economic characteristics of lone mothers to persistent poverty: Variables that are significant in the logistic regression model (MODEL: persistently poor compared to temporarily poor, work status from 2004 included) ...73
Table A.3 The association of socio-demographic and economic
characteristics of lone mothers to persistent poverty: Variables that are significant in the logistic regression model (MODEL: persistently poor compared to temporarily poor, longitudinal
work status included)...75
Table A.4 The association of socio-demographic and economic characteristics of couple families to persistent poverty: Variables that are significant in the logistic regression model (MODEL: persistently poor compared to temporarily poor, longitudinal work status included)...76
Table A.5 The association of socio-demographic and economic characteristics of lone mothers to persistent poverty: Variables that are significant in the logistic regression model (MODEL: persistently poor compared to temporarily poor, work status in 2004 combined with job readiness included) ...77
Table A.6 The association of socio-demographic and economic characteristics of couple families to persistent poverty: Variables that are significant in the logistic regression model (MODEL: persistently poor compared to temporarily poor, work status in 2004 combined with job readiness included) ...78
Table A.7 The association of socio-demographic and economic characteristics of lone mothers to persistent poverty: Variables that are significant in the logistic regression model (MODEL: persistently poor compared to non-persistently poor, work status from 2004 included) ...79
Table A.8 The association of socio-demographic and economic characteristics of couple families to persistent poverty: Variables that are significant in the logistic regression model (MODEL: persistently poor compared to non-persistently poor, work status from 2004 included) ...80
List of figures
Figure 2.1 Percentage of families with children living in income poverty 2001/04, according to the Households Below Average Income series (DWP, 2007a) ...15Figure 2.2 Number of times families with children were living in poverty, 2001/04 ...17
Figure 3.1 Median total weekly amount of equivalised income, 2001/04 ...20
Figure 3.2 Access to a current or savings account, by poverty status, 2001/04 ...22
Figure 3.3 Saving behaviour, by poverty status, 2001/04 ...23
Figure 3.4 Behind with household bills, by poverty status, 2001/04 ...24
Figure 3.6 Falling behind with loan repayments, by poverty status,
2001/04 ...27 Figure 3.7 Running out of money by the end of the week, by poverty
status, 2001/04 ...28 Figure 3.8 Money worries, by poverty status, 2001/04...29 Figure 3.9 Number of years in which families said they thought their
financial situation would improve in the future, by poverty
status, 2001/04 ...30 Figure 4.1 Children with a long-standing illness or disability (in 2004) by
poverty status (2001/04) ...36 Figure 4.2 Children who spent less than an hour on physical activity in
the last week (in 2004) by poverty status (2001/04) ...37 Figure 4.3 Children who have been bullied in a frightening or upsetting
way at least three times in the past year (in 2004) by poverty status (2001/04) ...38 Figure 4.4 Children who have been offered illegal drugs in the past year
(in 2004) by poverty status (2001/04)...39 Figure 4.5 Children who were below average in English and maths
(in 2004) by poverty status (2001/04)...40 Figure 4.6 Children who were expelled or suspended from secondary
school (in 2004), by poverty status (2001/04) ...41 Figure 4.7 Children who have been in trouble with the police in the last
year (in 2004), by poverty status (2001/04) ...42 Figure 4.8 Children who had not seen friends in last week and did not
go to organised activities (in 2004) by poverty status (2001/04) ..43 Figure 4.9 Children living in bad housing (in 2004), by poverty status
(2001/04) ...44 Figure 4.10 Mean number of items children in families did not have
(in 2004), by poverty status (2001/04)...46 Figure 4.11 Number of negative outcomes secondary school children face
(in 2004) by poverty status (2001/04)...48 Figure 5.1 Family work status, 2004 ...52 Figure 5.2 Risk of being persistently poor, by family work status (2004) ...53 Figure 5.3 Risk of being persistently poor, by longitudinal family work
status ...55 Figure 5.4 Persistently poor mothers’ job readiness, by work status of
mother (and partner in couple families)...56 Figure 5.5 Risk of being persistently poor, by family work status in 2004
combined with job readiness ...57 Figure 5.6 Risk of being persistently poor, by socio-demographic
characteristics of family (1)...58 Figure 5.7 Risk of being persistently poor, by socio-economic
Figure 5.8 Factors that increase the likelihood of persistent, rather than temporary, poverty among families with children, odds ratios, model with a point-in time work status measure ...64 Figure 5.9 The impact of longitudinal work status on factors that increase
the likelihood of persistent, rather than temporary, poverty
Acknowledgements
This report was undertaken by the National Centre for Social Research (NatCen). The authors take responsibility for any errors or omissions in this report.
We are grateful to the Department for Work and Pensions (DWP) for funding this project and for their continued support of the Families and Children Study (FACS).
The FACS is commissioned by the DWP, and sponsored by HM Revenue & Customs (HMRC), Department for Children, Schools and Families (DCSF), Department for Communities and Local Government (DCLG) and Department for Transport (DfT). We would like to thank these organisations for their continuing support of the study.
The Authors
Matt Barnes is a Research Director at NatCen. He joined NatCen having completed a Ph.D. on social exclusion at the University of Bath. His main research interests are the measurement of poverty and social exclusion and issues of work-life balance. Matt also works part-time at the Social Exclusion Task Force, Cabinet Office.
Anne Conolly is Researcher at NatCen. She joined NatCen having studied Combined Social Sciences at the University of Durham. She works on a number of research projects, including the FACS.
Glossary
BME Black and minority ethnic people and covers
all minority ethnic groups other than white.
Couple family A family with dependent children that was headed by one natural or adoptive parent, and a partner.
Dependent children Children aged 16 years or younger, or 17 or 18 years and in full-time education.
Dual earners A couple family where the mother and her partner both worked for 16 or more hours per week.
Equivalised income The equivalisation of income is the process by which total income is adjusted for family size (number of family members) and composition (number of parents and number and age of children).
FACS The acronym used to describe the FACS.
Family (unit) Comprises two generations of people; at least one dependent child and at least one adult who is responsible for this child.
Income AHC Income after housing costs are deducted.
Income BHC Income before housing costs are deducted.
Lone father A male lone parent.
Lone-parent family A family with dependent children that was headed by one natural or adoptive parent only. Lone parents may be male or female.
Mother Used to refer to the person who took part in the main FACS interview. This person was usually the family’s ‘mother figure’ – an adult with the main responsibility for looking after the children in the family. In the vast majority of couple families this person was female. In lone-parent families this person was either the lone mother or the lone father.
Not working No work (i.e. working zero hours).
Parent The adult responsible for the child. This can be the child’s natural or adoptive parent or the legal guardian(s) to whom Child Benefit is paid. In couple families both adults are referred to collectively as the parents.
Partner The person with whom the mother shares a
home.
Persistent poverty Income below 60 per cent of median equivalised total disposable income, before housing costs, for three or four out of four years.
Poverty Income below 60 per cent of median
A guide to methods used in
the charts and tables
The charts and tables reproduced in this report share a general pattern and their presentation follows a number of widely shared conventions. The majority of findings in the report are presented as charts to provide the reader with a visual representation of the main findings. The sub-group analysis presented in the charts is based on at least 50 cases, unless otherwise stated. Analyses based on a small number of cases may limit the robustness and validity of the statistics produced. As such, results based on less than 50 cases should be treated with caution. In fact, analyses based on less than 25 cases are not presented in this report.
The majority of tables that appear in the appendices use row percentages and present the circumstances of persistently poor families compared to families with other histories of low income. In these tables the percentages sum to 100. Some tables present multiple responses (the respondent could choose a number of responses rather than just one) and hence, percentages will not sum to 100, for example, the percentage of persistently poor families who have a list of debts (where the family could have more than one type of debt). Tables do not necessarily contain just percentages; sometimes they contain a measure of the average – for example, the median weekly income that the family receives. These statistics are made clear in the appropriate tables.
In charts and tables the following conventions are used:
Base The unweighted count of the base is presented in all tables, usually the number of respondents in the relevant family characteristic sub-group.
* Percentage value is greater than 0 but less than 0.5, which is rounded down.
. Figures are based on less than 25 cases and are not robust; therefore, the results are not presented in this report.
Summary
While most research and Government interest about poverty has focused on people who are currently experiencing low income, those who have a history of low-income experience have received less attention1. This report presents analysis of the persistence of low income from a large-scale longitudinal study of families with children.
The research was carried out by Matt Barnes, Anne Conolly and Wojtek Tomaszewski from the NatCen. It uses data from four waves (2001/04) of FACS, which is a Government-funded survey of families with dependent children living in Britain. The broad aim of the research was to use FACS to strengthen existing knowledge about families with children who experience persistent poverty. The main objective was to understand the nature of persistent poverty for families with children and to examine the key risk factors. This report presents the results of this analysis and provides some interpretations.
How is persistent poverty measured?
In this report poverty is considered as a relative measure of living standards. A family’s living standards is estimated according to levels of disposable income. Total disposable family income is calculated by adding together all of the family’s sources of income and then deducting taxes, National Insurance and pension contributions. Rent and mortgage interest payments are not subtracted from the overall amount, meaning the measure provides an amount of income that a family has to spend before housing costs (BHC). To ensure income reflects the family’s financial resources it is then adjusted for family size (number of family members) and composition (number of parents and number and age of children) using the modified Organisation for Economic Cooperation and Development (OECD) equivalence scale.
In the light of no true consensus on how the poverty threshold should be identified internationally, this project defines poverty according to the Government’s most often used poverty indicator – that is, income below 60 per cent of total equivalised disposable family income before housing costs.
Persistent poverty is measured using methodology adopted in the Government’s HBAI series. This defines persistent poverty as being below a low-income threshold in at least three of four annual observations (the FACS interviews). The longitudinal element of FACS is used to observe poverty status at four annual observations from 2001 to 2004.
One of the main objectives of the report is to investigate whether a different policy response is necessary for targeting persistently poor families compared to poor families, per se. Hence, the report also defines families who were temporary poor as those who were poor in one or two of the four annual observations. The data is then used to discuss how the circumstances of the persistently poor differ from those of the temporary poor.
How many families with children experience persistent
poverty?
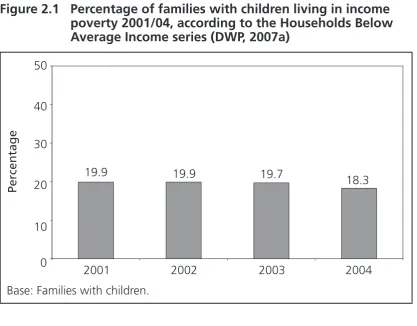
On average, around one-fifth of families with children were below the low-income threshold at each of the four years under investigation – this point-in-time measure of low income ranged from 18.3 per cent (in 2004) to 19.9 per cent (in 2001 and 2002). Approximately two-fifths (38 per cent) of families with children experienced at least one year of low income during this period. Over one in ten (12 per cent) of families with children experienced persistent poverty during the period 2001 to 2004. One-quarter (26 per cent) of families were temporary poor, that is poor in one or two of the four-year period.
What are the financial resources of persistently poor families
with children?
Persistently poor families received markedly less average income (under £200 equivalised income per week) than temporary poor families (£245), and only slightly more than half of this income came from earnings. Persistently poor families were significantly more likely than temporary poor families to have difficulties saving regularly, paying household bills and making money last. Indeed, persistently poor families had a significantly higher risk of repeatedly experiencing a range of disadvantaged financial circumstances, including:
• having no access to a current or savings account (ten per cent of persistently poor families and four per cent of temporary poor families);
• not saving regularly (65 per cent and 51 per cent);
• being in debt (38 per cent and 24 per cent);
• being behind with loan repayments (seven per cent and four per cent); • running out of money (27 per cent and 16 per cent);
• having financial worries (23 per cent and 14 per cent).
What are the living standards of persistently poor families
with children?
The financial problems that persistently poor families face are likely to have repercussions for all members of the family, including children. Children in persistently poor families were more likely than children in temporary poor households to be at risk of poor outcomes across a number of Every Child Matters
domains2, including:
• going without regular physical exercise (12 per cent compared to eight per cent);
• being suspended or expelled from school (11 per cent compared to six per cent);
• being in trouble with the police (five per cent compared to three per cent); • living in bad housing (48 per cent compared to 33 per cent);
• lacking a number of material deprivation items (3.9 items compared to 2.6 items);
• facing multiple (three or more) negative outcomes (28 per cent compared to 18 per cent).
It should also be noted that certain child outcomes did not appear significantly more likely for children in persistently poor families. These include being bullied and being offered illegal drugs (this information was collected from secondary school children only).
What are the characteristics of persistently poor families
with children?
The types of families with children at risk of persistent poverty, rather than temporary poverty, was explored using characteristics from the most recent wave of FACS (2004). This provided evidence that attempts to explain the key factors associated with longer-term, rather than shorter-term, experiences of low income. Certain families with children were more likely than others to experience persistent,
rather than temporary, poverty. Predictably, work was seen as a good protective factor from persistent poverty for both lone-parent and couple families. However, the risk of persistent poverty was high for couple families where only one parent worked for 16 or more hours per week, particularly if it was the mother working. Being without work for a number of years increased the risk of persistent poverty even further. Other factors that were associated with an increased likelihood of persistent, rather than temporary, poverty include not having access to a car (for a lone mother) and, for couple families having a Black or Minority Ethnic (BME) mother and parents with no qualifications.
What are the implications of this research for policy?
The evidence from FACS suggests that outcomes for persistently poor families are particularly adverse – almost one-half of children in these families live in bad housing and one in five have a long-standing illness or disability. Despite this evidence, there are no concerted policy measures to tackle persistent poverty above those designed to tackle poverty in general. One reason for this is because poverty is still commonly viewed from a point-in-time perspective, that treats the poor as an homogenous group. Policy clearly needs to adapt to the diverse experiences of poverty.
Although many of the determinants of transient poverty are linked to persistent poverty, there is a danger that more general policies may not work for families with the most entrenched problems. It is generally acknowledged in the poverty literature that there are certain factors that increase and maintain the risk of persistent poverty. This research has validated that often sited finding that being without regular work is a key influence on poverty. Given that families without work are also likely to experience the range of other disadvantages listed above, employment policy needs to work alongside policies designed to contend with these other hardships. Policy also needs to ensure that when work is found it is secured and sustained.
This research has also shown that temporary, or short-term, work is also an important employment outcome that reduces a family’s propensity to experience persistent poverty (when compared to a family with no worker). One-half of lone-parent families and two-fifths of couple families who experienced persistent worklessness, also experienced persistent poverty; for families temporarily in work over the period, rates of persistent poverty reduce substantially.
1 Introduction
The aim of this project is to gain a fuller understanding of the circumstances of families with children that experience persistent poverty. This introductory chapter provides the rationale for the project and begins with a succinct account of the current research evidence on families with children in poverty – with particular focus on families in persistent poverty. The chapter then moves on to describe how this project will add to the current evidence on persistent poverty by outlining the main research questions the project will investigate. The project uses data from the FACS and the final part of this chapter briefly discusses the content of FACS and its analytical capabilities.
1.1
Poverty among families with children
The Government has made a commitment to end child poverty by 2020 (HM Treasury, 2004) and also to focus effort on improving the lives of the most disadvantaged members of society (Cabinet Office, 2006). The Government’s latest statistics on child poverty reveal that approximately 20 per cent of families with children are living below the low-income threshold – set at 60 per cent of total equivalised disposable household income before housing costs3 (DWP, 2007a). The Government has succeeded in arresting and reversing the long-term trend in rising child poverty, lifting approximately 600,000 children out of relative poverty since 1998, and the UK made the biggest improvement since 1997 of any EU country (DWP, 2007b).
However, there are some commentators who predict that the Government will fail to meet its commitment to end child poverty by 2020 (Hirsch, 2006). Brewer
et al. (2007) estimate that the Government is falling behind in attempts to meet a provisional target to reduce child poverty by half by 2010. One of the reasons that the Government may fail to eradicate child poverty is that current social and economic policies are failing to reach families with the most severe and persistent (or recurrent) economic problems.
The Government’s own figures show that between 1991 and 2004, around one-fifth of families spent five or more years in poverty (DWP, 2007a). Indeed, over the period the incidence of persistent low income – defined as living below 60 per cent of median income for three or more years of any four-year period – has changed little for the whole population. However, there has been a reduction in persistent low income for households with children and for pensioners (DWP, 2007a), and income growth has been most marked amongst lone parents – although they remain, on average, poorer than couple families with children (Brewer et al., 2005). In fact the incidence of persistent low income for children has fallen by six percentage points since 1999/2002, and at 11 per cent over the latest recorded period (2002/05), was lower than it was at any time during the 15-year period since 1991 (DWP, 2007c).
At the heart of the Government’s target to eradicate child poverty is the evidence that living in poverty is linked to detrimental outcomes for families with children, both now and in the future. There is a wealth of evidence that links living on a low income to other disadvantages. For example, the latest Opportunity for All report shows that children born into poverty are more likely to have a lower birth weight, higher infant mortality and poorer health than better off children (DWP, 2007b). Research has shown a relationship between poverty in childhood and well-being as adults, demonstrating that child poverty can leave a damaging long-term legacy, regardless of other family circumstances (Blanden and Gibbons, 2006).
1.2
Aims of the report
The project will seek to answer a number of distinct research questions: • How many families with children experience persistent poverty?
Persistently poor families will be defined using methodology adopted in the Government’s HBAI series (DWP, 2007b). This will be used to count the prevalence of persistently poor families with children and also provide comparison groups for analysis in the rest of the report.
• What are the financial resources of persistently poor families with children? The prevalence and financial resources of persistently poor families will be
explored, including their income levels, main sources of income and amount of debt. The project will look at how persistently poor families manage their money and how they feel about their financial situation.
• What are the living standards of persistently poor families with children?
• What are the characteristics of persistently poor families with children?
The project will explore a variety of characteristics of persistently poor families with children and how they compare to other families with children, notably those in temporary poverty and those who avoid poverty. Various circumstances of the parents and children in these families will be explored, including work status, education and health, plus attitudes of parents to work and poverty.
1.3
The Families and Children Study
The report uses data from the 2001 to 2004 waves of the FACS. FACS is a series of annual surveys to investigate the circumstances of British families with dependent children4. The study began in 1999 with a survey of all lone-parent families and low-to-moderate income couples. In 2001, the third annual study was enlarged to be representative of all families with dependent children.
The FACS surveys are carried out via a face-to-face interview with the mother (and her partner in couple families). In 2003 and 2004 the surveys included a self-completion questionnaire that was completed by dependent children aged 11 to 15 years. One of the main objectives of FACS is to provide information on general family welfare issues, including the Government’s long-term targets to eradicate child poverty. Some of the main themes covered in the survey are presented in Box 1.1.
One of the most important features of FACS is that it is a panel study. This means that the same families are interviewed year on year. This provides a number of approaches to interrogate the data. The survey can be used as a standard cross-sectional survey to look at estimates of family behaviour in a particular year5 and repeated waves of the survey mean these cross-sectional estimates can be compared from one year to the next to create a trend analysis. However, the greatest benefit
4 A family comprises of at least one dependent child and at least one adult who is responsible for this child. A dependent child is defined as any resident child aged 16 years or under, or aged 17 or 18 and in full-time education. The adult responsible for the child can be the child’s natural or adoptive parent, or the legal guardian(s) to whom Child Benefit is paid. The definitions used in FACS mean that families cannot span more than two generations, so, for example, children, parents and grandparents living together are not considered to belong to the same family – the grandparents would form a separate family unit. However, the exception to this is where the grandparents are responsible for looking after the grandchildren; in which case the parents are likely to be deceased or living outside the household and are not part of the family unit.
of panel surveys such as FACS is that by returning to the same families year after year, they allow observations of dynamic behaviour and experiences. It is this type of analyses that is particularly useful for this project, as it can be used to answer questions such as: how many persistently poor families had consistent money worries over the period 2001 to 2004? Did the intention to find a job reduce the longer a parent experienced poverty? and so on.
The analysis presented in this report uses information from FACS 2001 to 20046. There are two main reasons why information from FACS 1999 and 2000 is excluded from this report: First, FACS 1999 and 2000 included only lone-parent families and low/moderate-income couple families with children7. It was only in 2001 that FACS covered all families with children and from this point comparisons between lone-parent and all couple families were possible. Secondly, the majority of FACS fieldwork takes place in winter each year (between September and January), meaning year-on-year analysis is based on observations approximately 12 months apart. However, in 1999 and 2000, FACS fieldwork took place in the summer, which meant that for some families, interviews in 2001 took place up to 18 months after the 2000 interview. Such a gap can substantially affect analysis, particularly analysis that uses information from subsequent waves.
The majority of analysis in this report uses information from families that took part in FACS continuously from 2001 through to 2004. There are various reasons why families drop out of FACS. Some drop out of the study through choice, some because of non-contact (attempts to trace and re-contact these families are made in the following wave) and some because they are no longer eligible for the study (for example, because the youngest child in the family has reached ‘adult’ status).
The process of dropping out of FACS is not random, certain groups or types of families are more likely to leave the panel than others – most notably those with younger parents and lone parents (Phillips et al., 2003). Failure to take this sample attrition into account will mean that longitudinal analysis of year-on-year change will not be representative of all families with children. Consequently, the longitudinal analysis presented in this report uses the longitudinal weight constructed to account for attrition amongst panel cases from 20018.
6 Data from FACS 2005 was not available at the time of this research.
7 Longitudinal analysis of lone-parent families and low/moderate-income families can, of course, benefit from the extra two years of information. 8 For further information on the weighting procedure applied to FACS, see the
Box . Main themes covered in FACS 004 Mother’s interview
Information about the family unit: • family composition;
• relationship histories and contact with non-resident parents; • housing;
• receipt of social security benefits;
• receipt and the renewal process of New Tax Credits; • other income and savings; and
• expenditure and hardship.
Information about the main respondent herself: • education and training;
• health;
• caring responsibilities;
• employment and self-employment; • work history; and
• unemployment and job search.
Information about each specific dependent child: • health;
• school and education;
• problems and use of local services; • parental aspirations for children; and • childcare arrangements.
Partner’s interview
For couple families, a short interview was carried out with the partner, including questions on:
• education and training; • health;
• employment and self-employment; • earnings;
• unemployment and job search; and • caring responsibilities.
A proxy interview was carried out with the mother if the partner was not available for interview. The proxy partner interview collected information on:
• current or recent work status, including industrial and occupational classification;
• earnings; • qualifications.
Child self-completion questionnaire
In 2003 and 2004 all children aged 11 to 15 in the family were invited to complete a short self-completion questionnaire, which included questions on:
• activities in spare time; • visiting friends;
• cigarette, alcohol and drug use; • school life; and
2 The incidence of
persistent poverty among
families with children
This chapter sets out how this project defines persistently poor families using FACS data. The chapter begins with a brief discussion of using low income as an indicator of poverty and describes how family income is collected in FACS. There follows a description of the poverty threshold used in this project and how persistent poverty is defined. The chapter concludes with an analysis of the prevalence of persistently poor families with children over the period 2001 to 2004.
2.1
Using low income as an indicator of poverty
Traditionally, the understanding of poverty has focused upon distributional issues: the lack of resources at the disposal of an individual or household to ensure a suitable standard of subsistence or living. Despite the abundance of theoretical work in the conceptualisation of poverty, it is only relatively recently that the British Government has adopted an official low-income threshold (for children).
This ‘official’ conceptualisation of poverty is provided in the Government published annual series of statistics called HBAI, first published in 19889 (for the latest version see the DWP, 2007a). The concept of poverty used in the HBAI series is regarded primarily according to living standards. The HBAI series presents ‘attempts to measures people’s potential living standards as determined by disposable income’ (DWP, 2007a). The HBAI series acknowledges that income is not always a complete reflection of actual or potential living standards and, more recently, the Government has incorporated material deprivation in its measure of child poverty (DWP, 2003).
Income is used as the primary indicator of resources in contemporary research for a number of reasons: Income is a resource that individuals, and households, have a reasonable amount of control over how to use and, although perhaps to a lesser agree, to acquire. It is also a resource that governments, usually through the workings of the welfare state, can administer to individuals and households in an attempt to maintain reasonable levels of subsistence in the population10. In addition, income is well understood, and can also be used to compare groups and countries.
Critics of the income measure argue that it is problematic to determine what is meant by a minimum level of subsistence, or living standards, and to equate this with a sum of money from which this can be achieved (Gordon et al., 2000). Others point to the many other factors beside income that provide resources, including the ability to borrow money and participation in the informal economy (Ringen, 1985). Even amongst those that agree that income is an adequate indicator of resources, there are many who note the measurement of income is fraught with problems, including what to count as income and what not, and the fact that particular sources of income are likely to face differential measurement error in surveys (Taylor et al., 1994). There has also been much research that has questioned the way in which income measures generally account for needs of households by assuming income is shared amongst household members (for example, Millar and Glendinning, 1989 and Middleton et al., 1997).
Probably the most common method of measuring poverty according to income levels is through the construction of purely relative poverty lines. In this approach, those who fall a certain distance below the average income level are understood to live in income poverty. Relative income levels are particularly relevant for cross-country comparisons or for measuring poverty over time for a particular cross-country. However, the method discounts improvements in living standards of low-income groups that are shared by the rest of the population or differences in average living conditions across countries (Callan and Nolan, 1994). Veit-Wilson (1998) argues that relative income poverty lines represent nothing more than an abstract statistical construct that have no independent validity as an empirical indicator of poverty. Despite this criticism, the Government’s measuring child poverty consultation found that it was clear that income was central to most people’s understanding of poverty (DWP, 2003).
Despite the criticisms of adopting a relative measure of poverty and in the light of no true consensus on how poverty should be measured, this project will define poverty according to the Government’s most often used poverty indicator – that is, low income or, more precisely, below 60 per cent of median total equivalised
disposable household income before housing costs. The construction of this measure using FACS data is explained in the following sections.
2.2
Measuring total family income in FACS
FACS measures family income via a number of questions asked to the main respondent (and her partner, in couple families) that cover all of the family’s sources of income. A measure of total disposable family income is calculated by adding together these sources and then deducting taxes, National Insurance and pension contributions. Council Tax payments (seen as an unavoidable tax) are also deducted. Total family income, therefore, includes the following components: • usual net pay from employment;
• all social security payments (including Housing Benefit (HB), but not any elements of the Social Fund);
• Working Tax Credit (WTC) and Child Tax Credit (CTC); • income from occupational and private pensions; • imputed income from investments;
• child maintenance payments;
• the value of benefits passported with Income Support (IS) and tax credits, if claimed.
Total family income provides an amount of income that a family has to spend before housing costs. In other words, gross housing costs, defined in the study as rent and mortgage interest payments, are not subtracted from the overall amount.
FACS does not collect information for household members outside the immediate family unit, and so here we use total family income rather than total household income11. This report does not consider the income of families where at least one parent was self-employed. Income is not currently derived for the self-employed in the FACS survey. Some low-income studies have noted issues relating to the findings among the self-employed group, which can be anomalous in relation to living standards. The HBAI, 2005 report states: ‘…it should be noted that a significant proportion of this group [self-employed] are believed to report incomes that do not reflect their living standards and that there are recognised difficulties in obtaining timely and accurate income information from this group’ (DWP, 2005)12.
11 Here there is a slight inconsistency with the HBAI statistics, which are based on households rather than families.
A problem with this measure of family income is that the size and composition of the family is not taken into account and therefore, total family income is not necessarily a true reflection of the family’s financial resources and hence, its living standards. For example, a couple family with four children that receives £200 per week is unlikely to have the same living standards as a lone-parent family with one child that receives the same amount – the couple family has £200 to resource six people whilst the lone-parent family has the same money to resource just two people.
The equivalisation of income is the process by which total income is adjusted for family size (number of family members) and composition (number of parents and number and age of children). There are a number of equivalisation methods and the one used in this report is the modified OECD equivalence scale, which is also now used in the HBAI series.
Box . The modified OECD equivalence scale
The main equivalence scales used in HBAI are the modified OECD scales. Two separate scales are used, one for income BHC and one for income After Housing Costs (AHC). The BHC scale is used in this study and the values of the scales are shown in the table below.
Equivalence scale values (BHC)
Person Equivalence scale
Couple 1.5
Lone parent 1.0
Children aged under 14 years 0.3
Children aged 14 years and over 0.5
The construction of household equivalence values from these scales is straightforward. The equivalence scales take a single person as the reference point, with an equivalence value of 1.0. Each child aged under 14 is given a weight of 0.3 and each child aged 14 years and over is given a weight of 0.5 (as is the spouse in a couple family). For example, the equivalence value for a family containing a lone parent with a four-year-old and a 14-year-old child would be 1.8 from the sum of the scale values:
1.0 + 0.3 + 0.5 = 1.8
This implies that this family needs 80 per cent more income than a single person without children to have the same standard of living.
2.3
Measuring income poverty in FACS
This study uses the same definition of poverty as used by the Government in its child poverty Public Service Agreement (PSA) target – which states that a household is deemed to be poor if its equivalised weekly net household income before housing costs falls below 60 per cent of the whole population median income. This definition also matches the agreement reached at the Statistical Program Committee of the European Union in 1998, which recommended preference for the use of the 60 per cent of median income as the indicator of income poverty. To ensure that the proportion of families with children in FACS matches those produced in official Government statistics, estimates from the Government’s HBAI series were applied to the FACS dataset. This was done by ordering the FACS data on the basis of family income, once the self employed were excluded13, and determining the level of income in the FACS data equivalent to the proportions in poverty in HBAI. These levels of income are used to identify poor families in FACS. For example, HBAI estimates for 2001 indicate that 19.9 per cent of households with children were living in income poverty. Consequently, in this study, the poverty threshold for 2001 is drawn at a point that identifies 19.9 per cent of families14 with children in FACS as living in poverty. The poverty rates for families with children for 2001 to 2004 are presented in Figure 2.1.
Figure . Percentage of families with children living in income poverty 00/04, according to the Households Below Average Income series (DWP, 007a)
13 As discussed in Section 2.2.
[image:29.595.91.509.433.759.2]2.4
Measuring persistent poverty in FACS
Various research on low income has found that individuals experience different durations of low income (DWP, 2007b; Smith and Middleton, 2007, which includes a summary of ways in which persistent poverty is measured). This implies that the cross-sectional low-income population is heterogeneous, comprised of those who experience low income for varying lengths of time. This report uses four years of FACS data to investigate issues of persistent poverty.
The choice of the length of period over which to observe family income is restricted by the availability of FACS data. At the time of the research, six waves of FACS data were available, covering the period from 1999 to 2004. However, as the first two waves of FACS cover only lone-parent and low/middle-income couple families, the latest four waves of FACS are used in this research. Hence, this data covers all families with children from 2001 to 2004.
Having a short observation period means that there is relatively little information from which to categorise patterns of low income. Categorising patterns of low income is complicated by the fact that some starts and ends of poverty spells are not observed in the data (the problem of ‘censoring’). However, having a shorter observation period means that attrition is less of an issue and the sample for whom four waves of data are available are more representative (and larger) than samples using longer observation periods.
This research, therefore, uses a relatively straightforward summary measure of persistent poverty. The methodology used to identify persistently poor families mirrors that developed for the HBAI series (DWP, 2007a) and used in Opportunity for All (DWP, 2007b). This methodology counts the number of times a family was observed to be poor at the four consecutive annual FACS interviews15. Family longitudinal poverty status classifies individuals into three categories:
• ‘Not poor’ – Not poor at any of the four annual interviews; • ‘Temporary poor’ – Poor at one or two interviews; and • ‘Persistently poor’ – Poor at three or four interviews.
Persistent poverty, therefore, is defined as having income, before housing costs, below 60 per cent of the median (the low-income threshold) at three or four of the four annual FACS interviews from 2001 to 200416.
15 As the observations are annual it is possible that a family could have been poor in between interviews.
Figure 2.2 presents a count of the number of times a family had income below the low-income threshold between 2001 and 2004 – from a minimum of zero (not below the low-income threshold in any of the four years) to a maximum of four (below the low-income threshold in all of the four years).
Figure . Number of times families with children were living in poverty, 00/04
Over one in ten (12 per cent) families with children were in persistent poverty during the period 2001 to 2004. Over six in ten (62 per cent) families with children did not record income below the low-income threshold in any of the four years and a quarter (26 per cent) were poor in one or two years – the temporary poor. Comparisons of persistently poor families with families who were not poor and families who were temporary poor, are used throughout the report to help highlight the circumstances of persistently poor families17. Particular focus is given to investigating how persistently poor families are different from temporary poor families. We also look at how these families compare to those poor in the latest wave of FACS (2004), as it is families defined as poor at a point in time that traditional measures of poverty focus on.
The actual number of families in FACS in each of the longitudinal poverty categories is given in Table 2.1.
Table . Longitudinal poverty status of families with children, 00/04
Longitudinal poverty status Per cent Unweighted count
Persistently poor 12 461
Temporary poor 26 909
Not poor 62 2,123
All families with children 100 3,493
Base: Families with children who took part in all waves of FACS from 2001 to 2004, excluding families with a self-employed parent.
2.5
Summary
Approximately one in five families with children are income poor at any one point but taking a dynamic approach to measuring poverty reveals that point-in-time measures underestimate the number of families who experience poverty over a four-year period. Almost two in five (38 per cent) families with children experienced poverty at least once in four annual FACS interviews from 2001 to 2004.
3 The financial
circumstances of
persistently poor families
with children
This chapter explores the financial circumstances of persistently poor families with children, looking at the average amount of income families have per week and the sources of this income – for example, how much of it is made up of wages, benefits and tax credits. The chapter then focuses on subjective measures of how families cope on low income, looking at the use of current and savings accounts, debts, financial management and money worries.
Throughout the chapter the main comparisons of financial circumstances are made between families in persistent poverty and families in temporary poverty. This is to help determine the key distinctions between persistent and temporary poor families. Unless otherwise mentioned in the text, the proportion of families in persistent poverty with disadvantaged financial circumstances (e.g. without a bank account) is significantly different (p<0.05) than the proportion of families in temporary poverty with the same circumstance. For example, ten per cent of families in persistent poverty did not have access to a bank account throughout the four-year period. This is higher than, and significantly different from, the four per cent of families in temporary poverty that had no access to a bank account over the same period.
3.1
Income levels and sources of income
income has been uprated in line with prices and averaged over the four years of the study. It is also equivalised to take into account family size and composition.
Figure . Median total weekly amount of equivalised income, 00/04
It is clear from Figure 3.1 that persistently poor families had a markedly lower family income over the four-year period than other families. The average weekly income for persistently poor families was less than £200 per week (equivalised income). This compares to an average weekly income of over £290 for families who avoided poverty over the period.
makes up only slightly more than half of the income of persistently poor families, compared to nearly 80 per cent of the income of families who avoided poverty over the period. A greater proportion of the income of persistently poor families is provided by tax credits and benefits.
It is evident from Figure 3.1 that families measured as income poor at a point in time sit somewhere between persistently poor and temporary poor families. This is because the longitudinal information available in FACS allows the categorisation of income poor families into those that have experienced low income temporarily and those that have experienced low income persistently. The point-in-time measure is, therefore, a combination of families with these different experiences.
3.2
Current and savings accounts
Access to current and savings accounts can provide persistently poor families with the means to manage and utilise financial resources. Kempson et al. (2004) suggest that savings can also be a key protective factor in preventing people going into debt. This section examines whether families have access to a current or savings account and looks at their reasons for saving. It also explores the borrowings of families in the last 12 months and the overall management of their finances. Figure 3.2 illustrates the proportion of families that had access to a current or savings account according to their poverty status across the four-year period. Research by Jones (2001) has shown that financially excluded families typically lack the range of choice of credit options available to most people. One in ten (ten per cent) persistently poor families did not have access to a bank account throughout the four-year period. Over the same period, four per cent of families in temporary poverty had no access to a bank account.
Figure . Saving behaviour, by poverty status, 00/04
Approximately two-thirds of persistently poor families did not regularly save over the period. This is 14 percentage points higher than families in temporary poverty (65 per cent compared to 51 per cent). Only one in ten (nine per cent) persistently poor families saved regularly for three or four years over the period.
3.3
Borrowing and debt
Families who struggle financially are likely to find themselves in debt and having to borrow money to meet the need for necessities such as food and clothing, or to pay household bills. Having to borrow money or falling behind with payments can mean families face additional worries associated with increased financial deficits and liabilities.
[image:37.595.93.504.112.545.2]• rent or mortgage payments;
• electricity, gas or other fuel bills like coal or oil; • Council Tax;
• water rates; • insurance policies; • telephone bill;
• television/video rental or other HP payments; • catalogue payments.
[image:38.595.93.505.330.750.2]In line with the above findings, families who experienced persistent poverty were more likely to be behind with household bills. A third (32 per cent) of persistently poor families were behind with household bills in three or four out of the four-year period. This compares to a quarter (26 per cent) of families who were poor in 2004, a fifth (21 per cent) of temporary poor families and just four per cent of families who were not poor.
Figure 3.5 moves the focus on to debt. Families are asked whether they use, and have outstanding debt, on any of the following ways to borrow money:
• bank overdraft;
• fixed term loan from a bank or building society; • loan from a finance company;
• loan from a money lender or ‘tally man’; • loan from a friend or relative;
• loan, or advance on wages, from employer; • Social Fund loan;
• remortgage house/equity release/increase mortgage; • student loan.
Figure . Debt by poverty status, 00/04
3.4
Managing family money
Living on a low income can result in a greater need for loans to subsidise household income. Loans and savings can provide families with the means to pay for unexpected bills and other living costs, as well as provide a means of purchasing one-off costly items. Previous research has shown that there is little evidence of financial mismanagement among poor families (Millar and Ridge, 2001). But changes in circumstances, inadequate incomes, accumulated debts and different approaches to managing incomes all place a strain on families’ capacity to manage.
[image:40.595.91.505.110.540.2]Figure . Falling behind with loan repayments, by poverty status, 00/04
Although falling behind with loan repayments was relatively uncommon – only two per cent of all families with children fell behind with loan repayments for two or more years of the four years – persistently poor families were the most likely to do this. One in five (20 per cent) persistently poor families fell behind with loan repayments in at least one year and seven per cent fell behind in two or more years.
Respondents were asked how often they ran out of money before the end of the week18. Families experiencing persistent poverty were most likely to say that they ran out of money either ‘every week’ or ‘most weeks’ in at least three of the four-year period under investigation. Over one-quarter (27 per cent) of persistently poor families did so compared to just six per cent of families who avoided poverty.
[image:41.595.91.503.133.549.2]Figure .7 Running out of money by the end of the week, by poverty status, 00/04
3.5
Financial worries now and in the future
[image:42.595.91.505.124.565.2]Figure .8 Money worries, by poverty status, 00/04
Families living in persistent poverty were the most likely to report that they were worried about money ‘almost all the time’. Over the four years, a quarter (23 per cent) of persistently poor families were worried about money in three or four years compared to 14 per cent of temporary poor families and four per cent of families not in poverty.
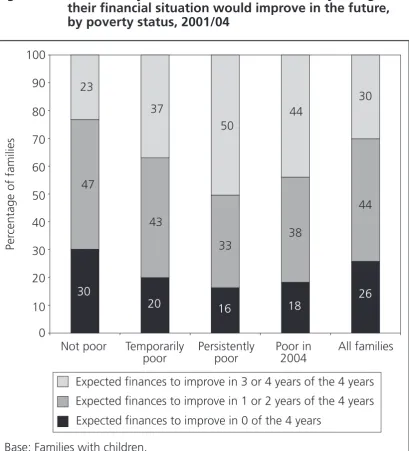
There was no significant difference in the proportion of persistently and temporary poor families who did not think that their financial situation would improve (around one-fifth). However, families experiencing persistent poverty were more likely to anticipate an improvement at three or more of the annual interviews (50 per cent compared to 37 per cent of temporary poor families).
[image:43.595.94.504.113.548.2]However, these families were not more likely to say that their finances would get worse. Only a very small proportion of families across the income distribution expected their financial situation to worsen (not shown in Figure 3.9).
Figure . Number of years in which families said they thought their financial situation would improve in the future, by poverty status, 00/04
3.6
Summary
[image:44.595.94.504.188.640.2]• no access to a current or savings account (ten per cent of persistently poor families and four per cent of temporary poor families);
• did not save regularly (65 per cent and 51 per cent); • behind with household bills (32 per cent and 21 per cent); • in debt (38 per cent and 24 per cent);
• behind with loan repayments (seven per cent and four per cent); • ran out of money (27 per cent and 16 per cent);
• financial worries (23 per cent and 14 per cent).
4 The outcomes for children
living in persistently poor
families
There is a wealth of information on the living standards of families with children who are in poverty but rather less evidence on the association between living standards and persistent poverty. The analysis presented in this chapter looks directly at these issues and pays particular attention to the likely impact of living in persistent poverty on outcomes for children.
Outcomes for children are presented according to the five Every Child Matters
domains. Every Child Matters is the Government’s approach to the well-being of children and young people from birth to age 19 (Department for Education and Skills (DfES), 2004). The Government’s aim is for every child, whatever their background or their circumstances, to have the support they need to:
• be healthy; • stay safe;
• enjoy and achieve;
• make a positive contribution; and • achieve economic well-being.
It is natural that the analysis in this chapter should be performed at the child-level – in other words, to count the number of children rather the number of families with children. This is because the majority of information used in this chapter is collected in the survey about each individual child in the family, rather than the family as a whole. For example, FACS asks about the health of each child in the family and hence, we can count the number of children living in persistently poor families that have poor health. This is an approach similar to that adopted in DWP’s analysis of material deprivation amongst families with children (Willitts, 2006) and the Britain’s Poorest Children reports, commissioned by Save The Children (Magadi and Middleton, 2005; and, Adelman et al., 2003).
There were 18 per cent of children living in poor families in 2004 (this represents 2,237 of the 10,793 children in the FACS dataset). The actual number of children in each of the longitudinal poverty categories, using the 2001 to 2004 waves of FACS, is given in Table 4.1.
Table 4. Longitudinal poverty status of children, 00/04
Longitudinal poverty status Per cent Unweighted count
Persistently poor 15 1,006
Temporary poor 28 1,894
Not poor 58 3,937
All dependent children 100 6,837
Base: Dependent children who took part in FACS in all years from 2001 to 2004.
There is a higher proportion of children, than families with children, living in persistent poverty (15 per cent compared to 12 per cent) because family size is one of the factors that contributes to persistent poverty status – with larger families with children being at greater risk of persistent poverty.
The charts in this chapter present statistics for five groups of children. Three of the groups are based on the longitudinal sample of children who took part in all waves of FACS from 2001 to 2004:
• ‘Not poor’ – Children who were not living in a poor family at any of the four annual interviews;
• ‘Temporary poor’ – Children who were living in a poor family at one or two interviews; and
• ‘Persistently poor’ – Children who were living in a poor family at three or four interviews.
The other two groups are based on the cross-sectional sample from the latest wave of FACS (2004):
Throughout the chapter the main comparisons of child outcomes are made between children living in families in persistent poverty and children living in families in temporary poverty. This is to help determine the key distinctions between persistent and temporary poor children19. Unless otherwise mentioned in the text, the proportion of children in persistent poverty with negative outcomes (e.g. with poor health) is significantly different (p<0.05) than the proportion of children in temporary poverty with the same circumstance. For example, 12 per cent of children from persistently poor families had spent less than an hour on physical activity in the last week. This is higher and significantly different than the eight per cent of children in temporary poverty who had spent less than an hour on physical activity in the last week.20
4.1
Be healthy
Poverty is generally regarded as one of the contributing factors leading to poor health, mortality and morbidity affecting the population21. In FACS the mother is asked whether each of her children has a long-standing illness or disability.
Figure 4.1 shows that approximately one in five (19 per cent) children from persistently poor families had a long-standing illness or disability. There are small, but still significant, differences when compared with children in temporary poverty (17 per cent).
19 Using the latest wave of FACS to identify child outcomes means that there may be some blurring of the relationship with the longitudinal poverty groups. This is because some of the persistently poor children, as defined in this research, may not be living in a poor family in 2004 (the definition states that to be persistently poor a child has to be living in a poor family for three or more out of four years). Likewise, a temporary poor child may be living in a poor family in 2004. However, these potential inconsistencies are likely to average out and not have a major effect on the analysis.
20 Note that because the longitudinal sample (2001/04) of children is different to the cross-sectional sample (2004), the ‘all children’ category is not a simple average of the three mutually exclusive longitudinal categories. The ‘all children’ category refers to all children in the 2004 survey only. This category is included in the charts to present the general incidence of the outcome amongst all children.
Figure 4. Children with a long-standing illness or disability (in 004) by poverty status (00/04)
The Government is promoting healthy eating and exercise as a key way for children to be healthy and avoid obesity (for example see the National Healthy Schools programme22 which aims to improve health and reduce health inequalities). Figure 4.2 presents data on children that spent less than an hour on physical exercise in the week prior to the FACS interview.
Again, children from persistently poor families were the most likely to lack physical exercise. Twelve per cent of children from persistently poor families had spent less than an hour on physical activity in the last week. This compares to eight per cent of children from temporary poor families.
Figure 4. Children who spent less than an hour on physical activity in the last week (in 004) by poverty status (00/04)
4.2
Stay safe
The stay safe domain is an attempt to raise awareness of the importance of safeguarding children and young people. This includes an increased focus on reducing anti-social behaviour and exclusion and to reduce the incidence of bullying.
Figure 4. Children who have been bullied in a frightening or upsetting way at least three times in the past year (in 004) by poverty status (00/04)
Figure 4.4 Children who have been offered illegal drugs in the past year (in 004) by poverty status (00/04)
4.3
Enjoy and achieve
The enjoy and achieve domain of the Every Child Matters framework is concerned with children and young people getting the most out of life and developing the skills for adulthood. This means increased access to high quality general education, as well as improved support for those not in school.
Although the causal relationships are complex, the correlations between poverty, social class and poor educational attainment are strong. For example, poor children are one-third as likely to get five good GCSEs as their wealthier classmates (DfES, 2005).
Mothers were asked to rate how they thought their children were performing at school. This assessment was based on the mother’s knowledge and opinion of her child’s school work, including school reports and any test scores. It is not evidence from administrative data on pupils performance collected by schools, so is susceptible to subjective opinions and judgements from the mother.
Figure 4. Children who were below average in English and maths (in 004) by poverty status (00/04)
Children excluded from school are at particular risk of failing to benefit from the education system as not only does exclusion deny a child access to a full education, it has also been shown to be the trigger for an escalating rate of crime and disaffection (National Children’s Bureau, 2003).
Figure 4. Children who were expelled or suspended from secondary school (in 004), by poverty status (00/04)
4.4
Making a positive contribution
Figure 4.7 Children who have been in trouble with the police in the last year (in 004), by poverty status (00/04)
Figure 4.8 Children who had not seen friends in last week and did not go to organised activities (in 004) by poverty status (00/04)
4.5
Achieve economic well-being
The economic well-being strand of the Every Child Matters framework concentrates on ensuring children and young people are not being prevented by economic disadvantage from achieving their full potential in life. This involves improving the housing arrangements for those in unsuitable accommodation and emphasising the importance of increased vocational and work related learning opportunities for older children.
Low income is likely to impact on the type and quality of housing that families can afford and poor families are more likely to find that substandard quality accommodation is their only available option. In this analysis, which mirrors analysis recently undertaken by Barnes et al. (2006), a child is defined as living in bad housing if the mother reported that their accommodation suffered from any one or more of the following three conditions23:
• temporary accommodation – living in temporary accommodation currently or in the past year;
• overcrowded accommodation – living in accommodation that falls short of the ‘bedroom standard24’ by one room or more;
• unfit accommodation – living in accommodation that is deemed to be in poor or very poor condition.
The analysis shows that there is a link between poverty and bad housing. Children living in poverty in 2004 were more than twice as likely as those who avoided poverty to live in bad housing. Being in a family in persistent poverty meant that a child was at most risk of living in bad housing – almost one half (48 per cent) of children living in families in persistent poverty lived in bad housing.