The ICT and e-learning
in FE survey 2006
key findings
November 2006
PHOTO REDACTED DUE TO THIRD PARTY RIGHTS OR OTHER LEGAL ISSUES
PHOTO REDACTED DUE TO THIRD PARTY RIGHTS OR OTHER LEGAL ISSUES
1
Data was used from the survey to develop five key measures of e-enablement – the extent to which the FE sector is using ICT for teaching, learning, management and administration. These measures show how:
•
learners are able to access the collegeICT infrastructure
•
colleges use and develop e-learning resources•
teaching staff have developed skills in ICT and e-learning along with their level of accessto technology
•
ICT is deployed for teaching and learning•
college managers use and manage their ICT resources.Taken together, these measures give an overall picture of a college’s engagement with ICT and e-learning.
This is the seventh in a series that has assessed
progress in the provision of ICT within further
education (FE) and sixth-form colleges since 1999.
The survey was carried out in February and March
2006 and a total of 122 colleges took part,
representing 31 per cent of the sector.
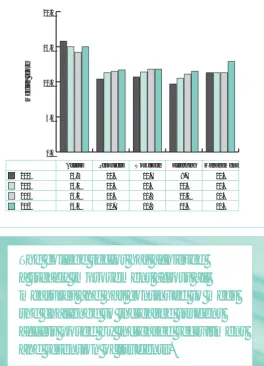
Figure 1 Measures of e-learning implementation
0.0 5.0 10.0 15.0 20.0 Median score
Access Resources Workforce Elearning Management
2003 15.8 10.4 10.7 9.7 11.3
2004 15.0 11.3 11.4 10.5 11.3
2005 14.2 11.5 11.8 11.1 11.3
2006 15.0 11.7 11.8 11.5 11.5
The college sector has achieved
a steady improvement across all
measures and has continued to meet
the challenge to increased student
access posed by increased recruitment
and retention of students.
[image:3.595.299.564.347.714.2]most often taken by individual tutors and was the case in 52 per cent of the colleges surveyed. Planning for the use of these materials at a higher level was far less widespread. Only 19 per cent of colleges had college-wide plans and 27 per cent had department- or course-level plans.
Colleges identified as ‘late adopters’ of ICT and e-learning showed the greatest increases in management interventions such as target setting. By contrast, the most e-enabled colleges appeared to make fewer management interventions than in previous years. However, these latter colleges increased levels of access for learners and achieved wider implementation of e-learning. These findings suggest two things. Firstly, college managers in late adopting colleges are beginning to engage with ICT and e-learning. Secondly, at the e-enabled end of the spectrum, ICT and e-learning become increasingly self-sustaining and require less direct management input.
Getting the best out of learning platforms
College intranets and networks continue to be extensively used for learning. Commercial or open-source virtual learning environments (VLEs) continued to be increasingly widely used. In 2006, 82 per cent of colleges used a VLE, compared to 59 per cent in 2003. Not only did use of these VLEs increase across the sector, they were also most widely cited as a college’s main
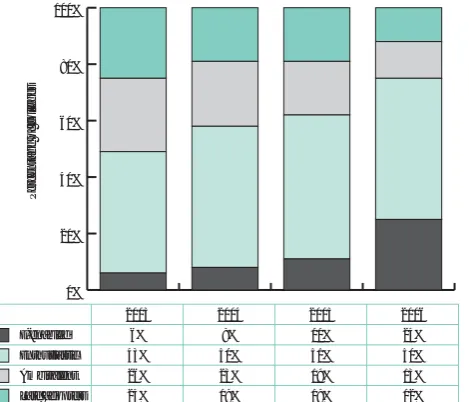
2003 2004 2005 2006
E-enabled 6% 8% 11% 25%
Enthusiastic 43% 50% 51% 50%
Ambivalent 26% 23% 19% 13%
Late adopters 25% 19% 19% 12%
[image:4.595.47.282.228.429.2]Learning platforms are beginning to develop features that address personalisation. Around half of college platforms could associate individual learners with particular courses, and with particular preferences. Just under 20 per cent of platforms could remember where a student has got to in a particular course and to recognise the student’s prior learning. Only 6 per cent of colleges said their learning platform outputs to an e-portfolio. These are basic personalisation features, showing that the use of ICT to support personalisation is at an early stage and still has some way to go.
However, the ability of a learning platform to link with a college’s MIS is not an outstanding feature of any type of platform. This suggests that in many colleges, student information is gathered by the learning platform, but does not feed into the wider college systems.
3
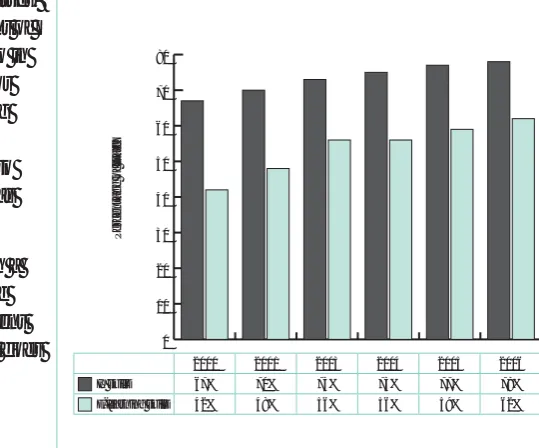
Figure 3 Teaching staff considered competent and advanced at ICT/e-learning
Percentage of staff
Teaching staff engagement
One internet-connected computer was available for each permanent member of teaching staff in well over half of the colleges surveyed. This was the case in 26 per cent of colleges in 2003, and only 15 per cent in 2001.
The ICT skills of teaching staff again showed a steady improvement. The average number of staff considered to be competent or advanced in their personal use of ICT has grown steadily from 67 per cent 2000 to a level of 78 per cent in 2006. Alongside this, an average of 62 per cent of college staff were reported to be competent or advanced in using ICT with learners. This latter figure was 42 per cent in 2000. However, the gap between those skilled in their personal use of ICT and those skilled in using ICT with learners has remained broadly the same over the past few years.
The combination of adequate staff skills with enthusiasm for e-learning is seen as a key element in embedding ICT and e-learning in any area of the curriculum. The survey asked respondents to give reasons for high and low ICT use in particular curriculum areas. The reasons most frequently given centred on staff enthusiasm and skills. Enthusiasm was cited by 44 per cent as contributing to high use of ICT and e-learning. A lack of confidence or competence with ICT was cited by 38 per cent as a reason for low use.
2000 2001 2003 2004 2005 2006
IT skills 67% 70% 73% 75% 77% 78%
E-learning skills 42% 48% 56% 56% 59% 62%
0 10 20 30 40 50 60 70 80
[image:5.595.268.538.223.447.2]A large number of colleges upgraded their local area networks (LANs) between 2004 and 2005, perhaps to make best use of the new bandwidth upgrades. This improvement continued into 2006. More than 70 per cent colleges use Gigabit Ethernet networks.
Just under half the institutions surveyed (47 per cent) reported that they could not cope with the demand for computers in 1999. This level had fallen to 30 per cent in 2006. Improvements in access to the internet also improved. Some 51 per cent of respondents described access to computers for internet use as easy at any time. This is similar to the 2003 level and an improvement on the previous two years.