Social Trends 41
Health
David Sweet
Edition No: Social Trends 41
Editor: Jen Beaumont
Office for National Statistics 2 ISSN 2040–1620
A National Statistics publication
National Statistics are produced to high professional standards set out in the Code of Practice for Official Statistics. They are produced free from political influence.
Not all of the statistics contained in this publication are National Statistics because it is a compilation from various data sources.
About us
The Office for National Statistics
The Office for National Statistics (ONS) is the executive office of the UK Statistics Authority, a non-ministerial department which reports directly to Parliament. ONS is the UK government’s single largest statistical producer. It compiles information about the UK’s society and economy, and provides the evidence-base for policy and decision-making, the allocation of resources, and public accountability. The Director-General of ONS reports directly to the National Statistician who is the Authority's Chief Executive and the Head of the Government Statistical Service.
The Government Statistical Service
The Government Statistical Service (GSS) is a network of professional statisticians and their staff operating both within the Office for National Statistics and across more than 30 other government departments and agencies.
Contacts
This publication
For information about the content of this publication, contact Jen Beaumont
Tel: 01633 65 1622
Email: [email protected]
Other customer enquiries
ONS Customer Contact Centre Tel: 0845 601 3034
International: +44 (0)845 601 3034 Minicom: 01633 815044
Email: [email protected] Fax: 01633 652747
Post: Room 1.101, Government Buildings, Cardiff Road, Newport, South Wales NP10 8XG
www.ons.gov.uk
Media enquiries
Tel: 0845 604 1858
Email: [email protected]
Copyright and reproduction
© Crown copyright 2011
You may re-use this information (not including logos) free of charge in any format or medium, under the terms of the Open Government Licence.
To view this licence, go to:
http://www.nationalarchives.gov.uk/doc/open-government-licence/
or write to the Information Policy Team, The National Archives, Kew, London TW9 4DU
Office for National Statistics 3 The World Health Organisation defines good health as ‘a state of complete physical, mental and social well-being and not merely the absence of disease and infirmity’.
People in the UK are healthier and living longer than ever before, with the major advances in life expectancy over the last century due mainly to declines in both infant mortality and mortality at older ages, public health innovations such as improvements in water quality and sewerage, and mass immunisation programmes which have reduced infectious diseases (DH,2010).
This chapter looks not only at these improvements in life expectancy and lifestyles in the population, but changes in the prevalence of chronic sickness and disability and the impact on health services. There is also analysis of mental well-being and the effects of environmental factors such as winter temperature and infections on health.
Key points:
Expenditure on health and life expectancy
In the UK in 2008 health expenditure per head and life expectancy were ranked 16th and 17th
respectively of 32 Organisation for Economic Co-operation and Development (OECD) countries at $3,281 and 79.9 years
In 2008 in the 32 OECD countries, the highest health expenditure per head was in the United States where life expectancy was ranked 24th and the highest life expectancy was in Japan
where health expenditure was ranked 20th
In 2008 period life expectancy at birth in the UK was at the highest level recorded for both males and females at 77.6 years and 81.7 years respectively: both had increased by about 20 years since 1930
One of the contributors to these changes in life expectancy is the decrease in infant and neonatal mortality rates which, in 2010, were at their lowest recorded level since 1930, falling more than 90 per cent to 4.5 per 1,000 and 3.1 per 1,000 live births respectively
Not only are life expectancies increasing, but both men and women are staying healthy and free of disability for more of their lives: the most recent estimates are that at age 65 men can expect to live 58 per cent and women 56 per cent of their remaining life in good health
Self-reported health status
In 2009 around 4 in 5 adults (79 per cent) in Great Britain reported that they were in good or very good health, compared with 75 per cent in 2005
In Great Britain in 2009, around 1 in 3 adults (30 per cent) reported that they had a long-standing illness or disability, compared with around 1 in 4 adults (21 per cent) in 1972 The proportion of adults reporting that a long-standing illness or disability limited their daily
activities changed very little between 1981 and 2009
Reported long-standing illness or disability was more than 8 times higher among the very elderly than the very young; two-thirds (66 per cent) aged 75 and over compared with around 1 in 12 (8 per cent) aged between 0 and 4 years
Use of services
Office for National Statistics 4 changed relatively little. Use of online services such as NHS Online increased seven-fold
between 2002-03 and 2007-08
Mortality
In 2009, for the first time, cancer was the most common cause of death for both sexes with 2,081 deaths per million males and 1,497 per million females
Males accounted for more than a half of all deaths as a result of diseases of the circulatory system (62 per cent), diseases of the respiratory system (59 per cent) and cancer (58 per cent)
Cancer
In the UK between 2006 and 2008 the highest incidence of cancer in males was of the prostate (100.0 per 100,000 population) and in females was of the breast (123.0 per 100,000), arguably reflecting higher diagnosis rates following improvements in screening programmes for both cancers
The highest cancer mortality rates for both sexes were for lung cancer at 51.7 per 100,000 males and 31.6 per 100,000 females
Between 2004 and 2008 in England male survival rates were highest for testicular cancer with more than 97 per cent surviving five years after diagnosis; female survival was highest for melanoma skin cancer with 90 per cent surviving five years after diagnosis
Healthy lifestyles
Between 2000/01 and 2009 the percentage of men in Great Britain who were regular smokers fell from 29 per cent to 22 per cent; the proportion of women who were smokers fell from 25 per cent to 20 per cent
Between 2000/01 and 2009 the proportion of men in Great Britain drinking more than daily alcohol guidelines fell from 39 per cent to 37 per cent, but the proportion of women drinking more than daily alcohol guidelines increased from 23 per cent in 2000/01 to 29 per cent in 2009 In 2009/10 more than a third of adults (35 per cent) in the UK reported using illegal drugs at
least once in their lifetime, while around 1 in 20 people (5 per cent) reported using drugs at least once in the last month
Between 2008 and 2009, 39 per cent of males in Great Britain met physical activity
recommendations compared with 29 per cent of females and this activity decreased with age In 2008/09 more than a half of males and females in Great Britain were classed as overweight
or obese (60 per cent and 52 per cent respectively)
Mental health
In 2009/10 more than 1 in 10 adults (11 per cent) in England were diagnosed with depression Within the UK diagnosis of depression was lowest in Wales with around 1 in 12 adults (8 per
cent) diagnosed in 2009/10
Between 1991 and 2009, suicide rates among males and females fell by more than 10 per cent In 2009 suicide rates were highest among males aged 15 to 44 years (18.0 per 100,000) and
among females aged 45 to 74 years (5.8 per 100,000)
Office for National Statistics 5
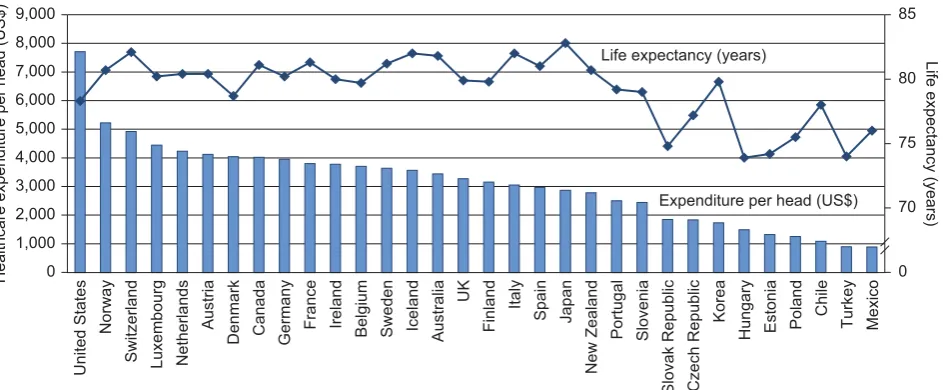
Health care expenditure per head and life expectancy
While there is some positive relationship between expenditure per head on healthcare and the life expectancy in a country, it is not always the case that those countries with high expenditure have the highest life expectancy, indicating that there are other factors which affect life expectancy. For example within the Organisation for Economic Co-operation and Development (OECD)i, of the
[image:5.595.63.535.327.522.2]countries where data were available in 2008, health care expenditure was highest in the United States (USA) at $7,720 per head, but the USA had average life expectancy of 78.3 years which was ranked 24th highest (Figure 1).
Figure 1
Expenditure on health per head and average life
expectancy, 2008
OECD countriesUS$, Years
Life expectancy (years)
Healthcare expenditure per head (US$)
Life expectancy (years)
Expenditure per head (US$)
United States
Norway
Switzerland Luxembourg Netherlands
Austria
Denmark Canada Germany France Ireland
Belgium Sweden Iceland Australia
UK Finland Italy Spain Japan New Zealand Portugal Slovenia
Slovak Republic Czech Republic
Korea
Hungary Estonia Poland
Chile Turkey Mexico 0 1,000 2,000 3,000 4,000 5,000 6,000 7,000 8,000 9,000 0 70 75 80 85
Source: Organisation for Economic Cooperation and Development; World Health Organisation
Life expectancy within the OECD was highest in Japan, at 82.8 years, while expenditure on health care was ranked 20th highest at $2,878 per head. In the UK in 2008 average life expectancy (79.9
years) and health expenditure per head ($3,281) were ranked 16th and 17th highest respectively.
Expenditure on health care was lowest in Mexico at $892; more than 8 times lower than in the United States. Life expectancy was lowest in Hungary at 73.9 years; more than 8 years lower than in Japan.
Potential Years of Life Lost (PYLL)ii is an estimate of the average number of years a person would
have lived if he or she had not died prematurely. In 1960 PYLL was highest in Portugal for both sexes: 19,910 years lost per 100,000 males aged 0 to 69 and 14,740 years per 100,000 females (OECD, 2010).
In the UK, expenditureiii on health services increased by a third (32 per cent) from £82.9 billion in
Office for National Statistics 6 head on health services in 2008–09 was highest in Scotland at £1,970, and lowest in England at £1,750 (HMT, 2010).
[image:6.595.63.496.281.517.2]In 2008 (or the latest available period), PYLL was highest among males in Estonia, 9,870 years per 100,000 and among females in Mexico, 4,950 per 100,000 (2007 data). PYLL was lowest in 2008 in Iceland, 2,800 years per 100,000 males and 1,590 per 100,000 females. It should be noted that 2008 data are not yet available for all countries (OECD, 2010).
Figure 2
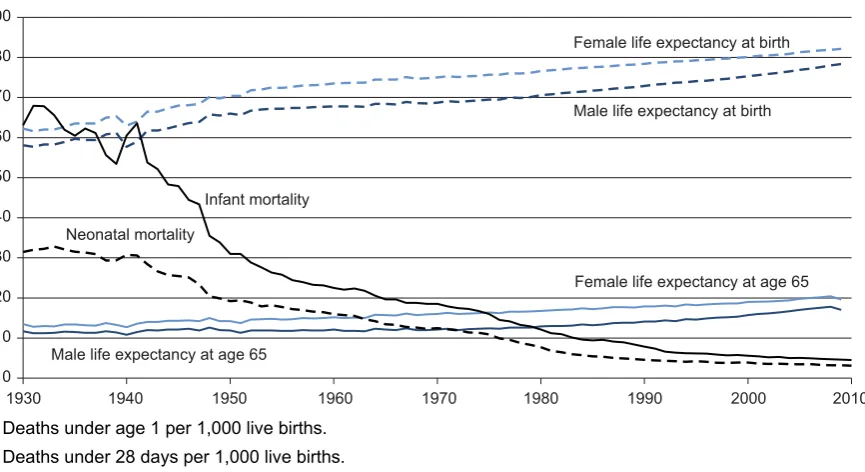
Life expectancy at birth and age 65, and infant
1and
neonatal
2mortality rates
United Kingdom3
Life expectancy in years4; mortality rates per 1,000 live births
0
Female life expectancy at birth
Infant mortality
Neonatal mortality
Male life expectancy at birth
Female life expectancy at age 65
Male life expectancy at age 65 10
20 30 40 50 60 70 80 90
1930 1940 1950 1960 1970 1980 1990 2000 2010
1 Deaths under age 1 per 1,000 live births. 2 Deaths under 28 days per 1,000 live births.
3 Data for 1930 to 1950 are England and Wales; data for 1951 onwards are for UK.
4 Life expectancy data for 2009 are period life expectancies from the 2008-based principal projections.
Source: Office for National Statistics; National Records of Scotland; Northern Ireland Statistics and Research Agency
Between 1930 and 2009 period life expectancy at birth in the UK increased by around 20 years for both sexes (Figure 2). In 1930 life expectancy at birth was 58.7 years for males and 63.0 years for
females, increasing 33 per cent among males to 78.1 years and 30 per cent among females to 82.1 years in 2009.
At age 65 period life expectancy increased by more than 50 per cent for both sexes: from 11.7 years for males and 13.5 years for females in 1930, to 18.0 years and 20.5 years respectively in 2009.
Office for National Statistics 7 An important reason for the increase in life expectancy is the fall in infant mortality rates (deaths under one year old), which decreased by 93 per cent from a rate of 63.1 per 1,000 live births in 1930 to 4.5 per 1,000 in 2010, the lowest on record. Similarly, neonatal mortality rates (deaths under 28 days old) have fallen by 90 per cent to their lowest recorded level, from 31.5 per 1,000 live births in 1930 to 3.1 per 1,000 in 2010.
In 2009 the main cause of infant mortality in Great Britain was ‘certain conditions originating in the perinatal period’iv, accounting for around a quarter of all infant deaths among males (27 per cent) and females (25 per cent) (ONS, 2010c; NRS, 2010a).
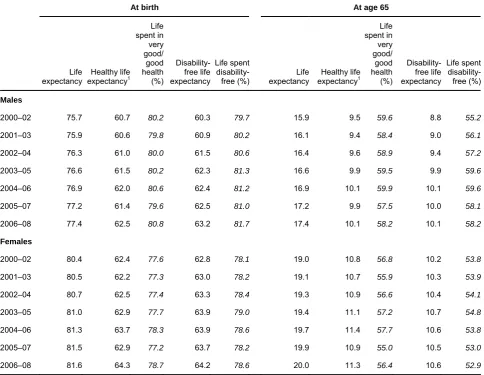
[image:7.595.62.547.348.723.2]With life expectancy increasing for both sexes, consideration should be given to how long people can expect to live free from a limiting illness or disability as one way of assessing the health of the nation in-line with the WHO definition quoted at the start of this chapter.
Table 1
Life expectancy, healthy life expectancy and disability-free
life expectancy at birth and age 65: by sex
United Kingdom Years, percentages
At birth At age 65
Life expectancy Healthy life expectancy1 Life spent in very good/ good health (%) Disability-free life expectancy Life spent disability-free (%) Life expectancy Healthy life expectancy1 Life spent in very good/ good health (%) Disability-free life expectancy Life spent disability-free (%) Males
2000–02 75.7 60.7 80.2 60.3 79.7 15.9 9.5 59.6 8.8 55.2
2001–03 75.9 60.6 79.8 60.9 80.2 16.1 9.4 58.4 9.0 56.1
2002–04 76.3 61.0 80.0 61.5 80.6 16.4 9.6 58.9 9.4 57.2
2003–05 76.6 61.5 80.2 62.3 81.3 16.6 9.9 59.5 9.9 59.6
2004–06 76.9 62.0 80.6 62.4 81.2 16.9 10.1 59.9 10.1 59.6
2005–07 77.2 61.4 79.6 62.5 81.0 17.2 9.9 57.5 10.0 58.1
2006–08 77.4 62.5 80.8 63.2 81.7 17.4 10.1 58.2 10.1 58.2
Females
2000–02 80.4 62.4 77.6 62.8 78.1 19.0 10.8 56.8 10.2 53.8
2001–03 80.5 62.2 77.3 63.0 78.2 19.1 10.7 55.9 10.3 53.9
2002–04 80.7 62.5 77.4 63.3 78.4 19.3 10.9 56.6 10.4 54.1
2003–05 81.0 62.9 77.7 63.9 79.0 19.4 11.1 57.2 10.7 54.8
2004–06 81.3 63.7 78.3 63.9 78.6 19.7 11.4 57.7 10.6 53.8
2005–07 81.5 62.9 77.2 63.7 78.2 19.9 10.9 55.0 10.5 53.0
2006–08 81.6 64.3 78.7 64.2 78.6 20.0 11.3 56.4 10.6 52.9
1 HLE based on five-point response general health question 2005–07 to 2006–08. Estimates for 2000–02 to 2004–06 are simulations based on original survey data.
Office for National Statistics 8 Over the period 2000–02 to 2006–08, healthy life expectancy (HLE)v for males at birth in the UK increased from 60.7 years to 62.5 years and from 62.4 years to 64.3 years for females. Estimates of HLE for the periods 2000–02 to 2004–06 are simulations based on original survey data. This is due to a discontinuity in the historic time series caused by adoption of an EU-wide general health question from the period 2005–07. In 2006–08 males could expect to spend more than four-fifths (80.8 per cent) of their lives in very good or good health and females 78.7 per cent(Table 1).
Disability-free life expectancy (DFLE) has also risen for both males and females at birth in the UK over the period 2000–02 to 2006–08. In 2006–08 the proportion of life spent free from a disability was 81.7 per cent for males and 78.6 per cent for females.
In 2006–08, men at age 65 could expect to spend a further 10.1 years in very good or good health and an equal length of time free from a disability. This represents 58.2 per cent of life expectancy at this age. Women aged 65, could expect to live for a further 11.3 years in very good or good health and 10.6 years free from a disability, representing 56.4 per cent and 52.9 per cent of life expectancy respectively.
For the constituent countries of the UK in 2006–08 HLE at birth was highest in England, 63.0 years for males and 64.5 years for females, and lowest in Wales; 60.2 years for males and 62.7 years for females. At age 65 HLE for men and women was again highest in England; 10.2 and 11.4 years respectively, but lowest in Northern Ireland for men (9.5 years) and in Wales for women (10.5 years).
Office for National Statistics 9
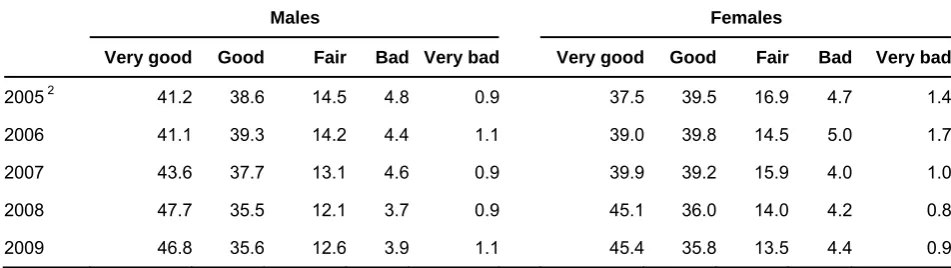
[image:9.595.60.536.161.295.2]Self-reported health status
Table 2
Self perception of general health
1Great Britain Percentages
Males Females
Very good Good Fair Bad Very bad Very good Good Fair Bad Very bad
2005 2 41.2 38.6 14.5 4.8 0.9 37.5 39.5 16.9 4.7 1.4
2006 41.1 39.3 14.2 4.4 1.1 39.0 39.8 14.5 5.0 1.7
2007 43.6 37.7 13.1 4.6 0.9 39.9 39.2 15.9 4.0 1.0
2008 47.7 35.5 12.1 3.7 0.9 45.1 36.0 14.0 4.2 0.8
2009 46.8 35.6 12.6 3.9 1.1 45.4 35.8 13.5 4.4 0.9
1 Those answering the survey question 'how is your/his/her health in general; would you say it was very good, good, fair, bad or very bad?' There are potential exposure and order effects associated with the five-category general health question prior to 2008. Particular care should therefore be taken if drawing conclusions concerning the changes between 2007 and 2008.
2 2005 estimates are based on data collected from April to December. From 2006 estimates are based on the full calendar year.
Source: General Lifestyle Survey, Office for National Statistics
As well as the objective studies which show that more of life is spent free from limiting illness or disability, reports by individuals on their own health also show improvement (Table 2).
In 2005 in Great Britain, more than three-quarters of males (80 per cent) and females (77 per cent) considered themselves to be in ‘very good’ or ‘good’ health, while around 6 per cent of males and of females considered themselves to be in ‘ very bad’ or ‘bad’ health.
By 2009 the perception of general health had improved, with 82 per cent of males and 81 per cent of females in Great Britain considering themselves to be in at least ‘good’ health and around 5 per cent respectively in ‘bad’ or ‘very bad’ health. In 2009 more than half of females in Great Britain considered themselves to be in ‘good’ or ‘very good’ health for all age-groups while in males it was those who were between 0 and 74 years.
Within Great Britain in 2009 the proportion of the population in ‘good’ or ‘very good’ health was highest for males in Wales at 86 per cent and for females in both England and Wales at 82 per cent.
Improvements in preventive health are seen in immunisation programmes among children and reductions in communicable disease.
Office for National Statistics 10 Between 1989 and 2009, rates of selected communicable diseases in the UK fell. The biggest falls were seen for rubella (96 per cent lower), whooping cough (91 per cent) and measles (82 per cent). Notifications increased for meningococcal septicaemia/infection (40 per cent), food
poisoning (31 per cent), and tuberculosis and typhoid both increased by around a fifth (17 per cent) (ONS, 2010b).
It is estimated that around 172 million working days were lost to sick absence in 2007, at a cost to the economy of over £13 billion (DH, 2010). Although the proportion of the population in good health is increasing, the proportion of the population reporting a long-standing illness or disabilityvi
[image:10.595.60.494.298.593.2]has increased since the 1970s.
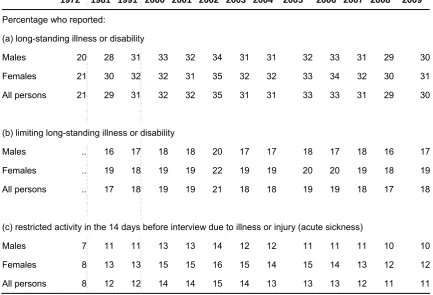
Table 3
Trends in self-reported sickness: by sex
Great Britain Percentages
1972 1981 1991 2000 2001 2002 2003 2004 20051 2006 2007 2008 2009
Percentage who reported:
(a) long-standing illness or disability
Males 20 28 31 33 32 34 31 31 32 33 31 29 30
Females 21 30 32 32 31 35 32 32 33 34 32 30 31
All persons 21 29 31 32 32 35 31 31 33 33 31 29 30
(b) limiting long-standing illness or disability
Males .. 16 17 18 18 20 17 17 18 17 18 16 17
Females .. 19 18 19 19 22 19 19 20 20 19 18 19
All persons .. 17 18 19 19 21 18 18 19 19 18 17 18
(c) restricted activity in the 14 days before interview due to illness or injury (acute sickness)
Males 7 11 11 13 13 14 12 12 11 11 11 10 10
Females 8 13 13 15 15 16 15 14 15 14 13 12 12
All persons 8 12 12 14 14 15 14 13 13 13 12 11 11
1 2005 data includes last quarter of 2004/5 data due to survey change from financial year to calendar year. Source: General Lifestyle Survey, Office for National Statistics (ONS, 2011)
In 1972 more than one in five adults (21 per cent) in Great Britain reported a long-standing illness or disability, rising to more than one in three adults (35 per cent) in 2002. In 2009 this had fallen to 30 per cent. Prevalence of a long-standing illness or disability is similar among males and females, 30 per cent and 31 per cent respectively (Table 3). However, although there has been an increase
in the proportion reporting long-standing illness or disability, those also reporting that the condition limited their everyday activities has varied less: in 1981 around 17 per cent reported such
Office for National Statistics 11 In 2009 around 1 in 8 females (12 per cent) in Great Britain reported restricted activity due to acute illness or injury in the 14 days prior to interview, an increase from around 1 in 13 (8 per cent) in 1972; 1 in 10 males (10 per cent) reported recent restricted activity in 2009, rising from 1 in 14 (7 per cent) in 1972. However, there have been recent decreases among those reporting restricted activity, from a peak of 14 per cent of males and 16 per cent of females in 2002.
Results from the General Lifestyle Survey (GLF) show that in 2009, two-thirds of adults (66 per cent) in Great Britain aged 75 and over reported a long-standing illness or disability. This is more than 8 times higher than the rate reported for children aged between 0 and 4 years (8 per cent). Adults aged 75 and over were also 3 times more likely than the very young to report restricted activity, 18 per cent and 6 per cent respectively (ONS, 2011).
In Great Britain, on average, there were 23 days per person per year where activity was restricted because of acute illness or injury in 2009. The number of days was higher among females, 25 days per person per year compared with 21 days for males (ONS, 2011).
The older population averaged more than six times as many days where activity was restricted compared with the younger population; 49 days per person per year among those aged 75 and over compared with eight days among those aged between 0 and 4 years.
For the adult population reporting a chronic sickness in 2009, the most common condition for men was disease of the heart and circulatory system, a rate of 114 per 1,000 men; among women, disease of the musculoskeletal system was more common at 159 per 1,000 (ONS, 2011).
In Great Britain in 2009 the most common condition suffered among the youngest adult age-group (aged between 16 and 44 years) was asthma, 28 per 1,000 men and 45 per 1,000 women. With the exception of men aged between 65 and 74 years, where hypertension was more prevalent, the most common condition suffered in all other age groups for both sexes was arthritis and
Office for National Statistics 12
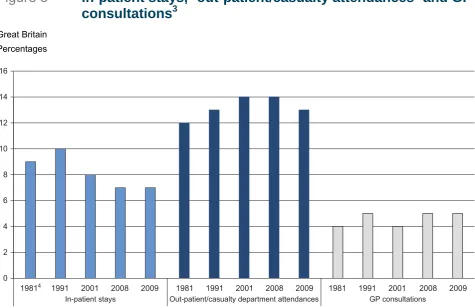
Use of services
[image:12.595.60.536.246.554.2]While life expectancies are increasing, the age at which individuals become disabled may also increase to such an extent that the overall burden of lifetime illness (the proportion of their lives that people spend with poor health or disability) may actually decline. Declining disability rates would have considerable implications for the provision of health and social care. There is some evidence from the General Lifestyle Survey (ONS, 2011) of recent decreases in the use of in-patient, outpatient and casualty services in Great Britain, while consultations with GPs have changed relatively little.
Figure 3
In-patient
stays,
1out-patient/casualty attendances
2and GP
consultations
3Great Britain Percentages
0 2 4 6 8 10 12 14 16
19814 1991 2001 2008 2009 1981 1991 2001 2008 2009 1981 1991 2001 2008 2009
In-patient stays Out-patient/casualty department attendances GP consultations
1 In-patient stays in the 12 months before interview.
2 Persons who reported attending an out-patient or casualty department in the 3 months before interview. 3 Consultations with an NHS GP in the 14 days before interview.
4 Earliest in-patient data available are for 1982.
Source: General Lifestyle Survey, Office for National Statistics (ONS, 2011)
Between 1982 and 2009, the proportion of the population in Great Britain reporting an in-patient stay in the 12 months prior to interview fell from around 1 in 11 (9 per cent) to 1 in 14 (7 per cent)
(Figure 3). In-patient stays have fallen among all age groups under 65 years, but have increased
Office for National Statistics 13 Between 1981 and 2009, attendances at out-patient or casualty departments in the 3 months prior to interview increased from 12 per cent to around 13 per cent. However, in 2009 there had been a slight decrease from 14 per cent in 2008. Attendances by the elderly population rose by more than 50 per cent; among 65 to 74-year-olds attendances rose from 15 per cent in 1981 to 21 per cent in 2009 and among those aged 75 and over from 15 per cent to 25 per cent (ONS, 2011). In 2009 out-patient or casualty attendances were highest among females than males between the ages of 45 and 74 years, although attendances among the very young and the very old were highest for males.
In 2009 around 1 in 20 people (5 per cent) consulted a GP in the 14 days prior to interview. Adults aged 75 and over were 4 times more likely to have a GP consultation than those aged between 5 and 15 years, 8 per cent and 2 per cent respectively (ONS, 2011). In 2009 around 1 in 16 females (6 per cent) attended a GP consultation compared with 1 in 25 males (4 per cent).
Since it was launched in 1998, NHS Online has reported an increasing number of people using telephone or online services. Between 2002/03 and 2007/08 the number of website ‘hits’ in
Office for National Statistics 14
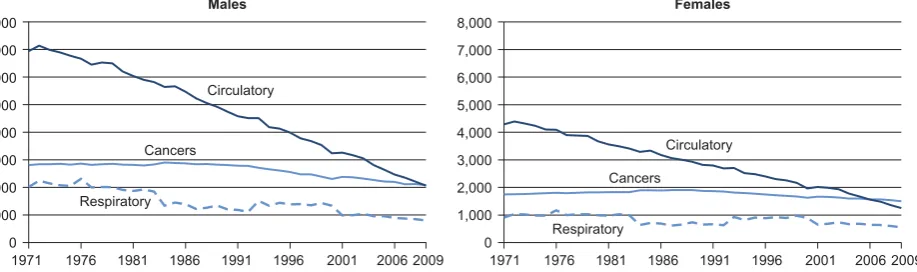
Mortality
Combined with falls in infant mortality and increases in general health levels, decreases in mortality rates have also contributed to extended life expectancy (Figure 4).
[image:14.595.69.528.299.435.2]In 2009 the leading cause of death for both sexes was cancer, at 2,081 deaths per million males and 1,497 per million females, despite mortality rates for cancer falling 26 per cent and 14 per cent respectively since 1971.
Figure 4
Mortality: by sex and leading cause group
United Kingdom
Rates per million population
Males Females
8,000 7,000
6,000
5,000 4,000
3,000 2,000
1,000
0
8,000 7,000
6,000
5,000 4,000
3,000 2,000
1,000
0
1971 1976 1981 1986 1991 1996 2001 2006 2009 1971 1976 1981 1986 1991 1996 2001 2006 2009 Circulatory
Cancers
Cancers Respiratory
Respiratory
Circulatory
Source: Office for National Statistics; National Records of Scotland; Northern Ireland Statistics and Research Agency
Between 1971 and 2009 in the UK, mortality rates for diseases of the circulatory system and diseases of the respiratory system also fell among both sexes. According to the British Heart Foundation these are due to improvements such as legislative measures and tobacco control strategies to reduce exposure to second hand smoke, restrictions on marketing of foods high in sugar, fat and salt, national frameworks to drive up standards of treatment and care and advances in stem cell research and regenerative medicine (BHF 2010). In 2009, for males the mortality rate for diseases of the circulatory system was 70 per cent lower than in 1971, at 2,061 per million and the mortality rate for respiratory disease was 801 per million, a fall of over 60 per cent since 1971.
Among females, the mortality rate for disease of the circulatory system had fallen more than 71 per cent since 1971 to 1,252 per million in 2009 and mortality from disease of the respiratory system was 39 per cent lower, falling from 909 per million in 1971 to 552 per million in 2009.
Office for National Statistics 15
Cancer
[image:15.595.70.543.230.533.2]As discussed in the last section, cancer was the most common cause of mortality among both males and females in 2009. It is estimated that around 1 in 3 people will develop some form of cancer during their lifetime (Cancer Research UK, 2010a).
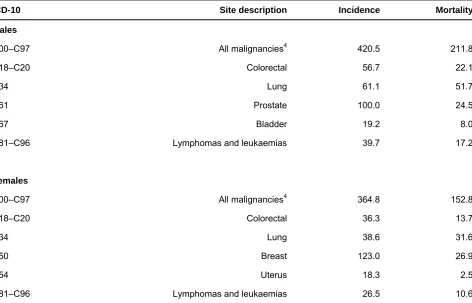
Table 4
Directly
age-standardised
cancer mortality
1and incidence
2rates, 2006 to 2008
3United Kingdom Rates per 100,000 population
ICD-10 Site description Incidence Mortality
Males
C00–C97 All malignancies4 420.5 211.8
C18–C20 Colorectal 56.7 22.1
C34 Lung 61.1 51.7
C61 Prostate 100.0 24.5
C67 Bladder 19.2 8.0
C81–C96 Lymphomas and leukaemias 39.7 17.2
Females
C00–C97 All malignancies4 364.8 152.8
C18–C20 Colorectal 36.3 13.7
C34 Lung 38.6 31.6
C50 Breast 123.0 26.9
C54 Uterus 18.3 2.5
C81–C96 Lymphomas and leukaemias 26.5 10.6
1 Mortality rates per 100,000 population, age-standardised to the European Standard Population to allow comparison between populations which may contain different proportions of people of different ages.
2 Registration (Incidence) rates are newly diagnosed cases of cancer per 100,000 population. 3 Three-year average.
4 Excluding nmsc (non-melanoma skin cancer) (C44) in newly diagnosed cases of cancer. Source: Office for National Statistics (ONS, 2010e)
Between 2006 and 2008, the age-standardised incidence rateviii for all cancers was 420.5 per
100,000 males and 364.8 per 100,000 females (Table 4). Incidence was highest for males for
prostate cancer, 100.0 per 100,000, and for females for breast cancer at 123.0 per 100,000. These high incidence rates are arguably a result of an extensive breast screening programmeix among
females and the Prostate Cancer Risk Managementx programme among males, both of which can
lead to higher diagnosis rates.
Office for National Statistics 16 highest among males aged 85 and over, 563.8 per 100,000, and among females aged 80 to 84 years, 291.1 per 100,000 (Cancer Research UK, 2010b).
Studies by the International Agency for Research on Cancer show that worldwide in 2008 there were 12.7 million new cases of cancer (an incidence rate of 181.6 per 100,000 population), and 7.6 million cancer deaths (a mortality rate of 106.1 per 100,000). Among males, both the worldwide incidence and mortality rates were highest for lung cancer, 34.0 per 100,000 and 29.3 per 100,000 respectively. For females, both incidence and mortality rates were highest for breast cancer, 39.0 per 100,000 and 12.5 per 100,000 respectively (International Agency for Research on Cancer, 2010).
In the European Union (EU-27) in 2008, the European age-standardised lung cancer mortality rate for males was highest in Hungary, 106.4 per 100,000 and for females in Denmark, 44.6 per
100,000. The European age-standardised lung cancer mortality rate for UK of 50.3 per 100,000 males was around 17 per cent lower than the EU-27 average of 60.6 per 100,000; the rate for females of 31.7 per 100,000 was more than 70 per cent higher than the EU-27 average of 18.6 per 100,000 (Cancer Research UK, 2010c).
Within the UK, between 2006 and 2008 the incidence rate for all cancers for males was highest in Wales, 467.1 per 100,000, and lowest in England, 414.1 per 100,000; for females, incidence rates were highest in Scotland, 398.0 per 100,000 and lowest in England, 360.2 per 100,000 (ONS, 2010e).
Office for National Statistics 17
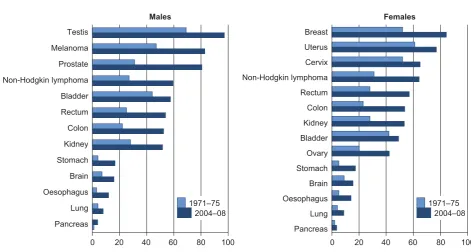
Figure 5
Five-year age-standardised relative survival, common
cancers: by sex
1England Percentages Breast Uterus Cervix Non-Hodgkin lymphoma Rectum Colon Kidney Bladder Ovary Stomach Brain Oesophagus Lung Pancreas Females Males Testis Melanoma Prostate Non-Hodgkin lymphoma Bladder Rectum Colon Kidney Stomach Brain Oesophagus Lung Pancreas 1971–75 2004–08 1971–75 2004–08
0 20 40 60 80 100 0 20 40 60 80 100
1 Patients diagnosed 2004–2008 and followed up to 2009. 2 Age-standardisation requires the estimation of survival for each age group. Age-standardisation is not possible if there
are too few events (deaths) in a given age group. That can happen because survival is very high (there are very few deaths) or because it is very low (most of the patients die early in the five-year period of follow-up). Age-standardised rates are not available for stomach cancer for men in England and lung, stomach and brain cancers for females in England.
Source: Table 4.5 ‘Cancer Survival Trends in England and Wales, 1971–1995, NHS region and deprivation’, Office for National Statistics (ONS 1995, ONS 2010a), London School of Hygiene and Tropical Medicine
Survival from cancer has shown large improvements in England over the last 40 years (Figure 5).
Between 1971–75 and 2004–08, five-year age-standardised survival rates improved in all cancers and more than doubled in 8 out of 13 cancers for males and in 7 out of 15 cancers for females.
Between 2004 and 2008, the highest survival rate for males was testicular cancer with more than 97 per cent still alive five years after diagnosis. Among females, between 2004 and 2008 five-year survival rates were highest for melanoma skin cancer at 90 per cent.
The largest improvement in survival rate for both sexes between 1971–75 and 2004–08 was for stomach cancer, increasing 313 per cent for males from a rate of 4.0 per 100,000 to 16.5 per 100,000 and 244 per cent for females from 5.0 per 100,000 to 17.2 per 100,000.The lowest survival rates for both men and women were for cancer of the pancreas, with between 3 per cent and 4 per cent surviving five years after diagnosis.
Office for National Statistics 19
Healthy lifestyles
[image:19.595.63.548.308.548.2]The causal link between lung cancer and tobacco smoking has been established for over 50 years. Since then, information has been collected on the health consequences of tobacco consumption and the addictive nature of nicotine which makes smoking cessation difficult. In the UK, tobacco consumption is now recognised as the single greatest cause of preventable illness and early death with smoking-related disease responsible for more than 107,000 deaths in 2007. It is estimated that 86 per cent of lung cancer deaths in the UK are caused by smoking (Cancer Research UK, 2010f). Other life style choices, such as drug or alcohol misuse and can also lead to poor health.
Table 5
Prevalence of smoking, drinking and binge-drinking
1among adults
Great Britain Percentages
Men Women
Regular smoker
Drank more
than 4 units2
Drank more
than 8 units Regular smoker
Drank more
than 3 units2
Drank more than 6 units
2000/01 29 39 21 25 23 10
2001/02 28 40 22 26 23 10
2002/03 27 38 21 25 23 10
2003/04 28 40 23 24 23 9
2004/05 3 26 39 22 23 22 9
2005 25 35 19 23 20 8
2006 4 23 40 23 21 33 15
2007 22 41 24 20 34 15
2008 5 22 37 21 21 29 14
2009 22 37 20 20 29 13
1 Binge-drinking is defined as drinking double the daily recommended consumption. 2 Includes those who drank more than 8 units for men and 6 units for women.
3 2005 data includes last quarter of 2004/5 data due to survey change from financial year to calendar year. 4 Results from 2006 include longitudinal data. From 2006, figures produced using the updated methodology for converting volumes of alcohol to units assuming an average wine glass size.
5 Figures produced from 2008 are using the updated methodology including data on wine glass size, therefore comparisons with earlier data may be misleading.
Source: General Household Survey, Office for National Statistics (ONS, 2011)
In 2009, more than 1 in 5 men (22 per cent) in Great Britain smoked regularly and a similar proportion (20 per cent) had binged on alcohol at least once in the previous week (Table 5).
Office for National Statistics 20 aged 25 to 34 and 28 per cent of women aged 20 to 24 regularly smoking in 2009, compared with 15 per cent of men and 13 per cent of women aged over 60 (ONS, 2011).
In 2009, around 5 per cent of boys aged 11–15 years smoked at least 1 cigarette a week, compared with 7 per cent of girls in the same age group (IC, 2009a). Among 15-year-old boys in England, around 19 per cent smoked compared with 22 per cent of girls. In Great Britain, the proportion of smokers aged between 11 and 16 years was lowest among boys in Wales for all age-groups and lowest in Scotland for girls (ONS, 2010b).
According to the 2008/09 Opinions Survey, around two-thirds (67 per cent) of smokers in Great Britain reported that they would like to stop smoking: the most common reason given was ‘at least one health reason’, 85 per cent of men and 82 per cent of women, while 6 per cent of men and 7 per cent of women gave the smoking ban introduced in 2007 as the main reason (ONS, 2009).
In 2007 the annual cost to the NHS from alcohol misuse was £2.7 billion (NHS 2009). Alcohol has been identified as a causal factor in more than 60 medical conditions including mouth, throat, stomach, liver and breast cancers; hypertensive disease (high blood pressure); cirrhosis; and depression (IC, 2010).
The proportion of men who drank more than the Department of Health daily alcohol guidelines (3–4 units for men, 2–3 units for females)xi fell from 39 per cent in 2000/01 to 37 per cent in 2009. The proportion considered ‘binge-drinkers’ (drinking double the recommended daily guideline) had fallen slightly from 21 per cent in 2000/01 to 20 per cent in 2009. However, it should be noted that the methodology for calculating alcohol consumption was amended in 2008 and therefore
comparisons with data before 2008 may not be valid.
In comparison, the proportion of women in Great Britain who drank more than the recommended daily guidelines had risen from 23 per cent to 29 per cent over the last decade, while the proportion of binge drinkers had increased from 10 per cent to 13 per cent. However, it should be noted that around 1 in 3 men (32 per cent) and nearly a half of women (46 per cent) in Great Britain drank no alcohol in the week prior to interview.
Those considered ‘binge-drinkers’ decreased with age: men aged 16 to 24 years were nearly 5 times more likely to binge-drink in the previous week compared with those aged 65 and over, 24 per cent and 5 per cent respectively. Similarly, among women, those aged 16 to 24 years were 12 times more likely to binge-drink compared with those aged 65 and over, 24 per cent and 2 per cent respectively (ONS 2011).
In England more than a third of children aged 15 years old reported drinking on a weekly basis in 2010; 39 per cent of boys and 37 per cent of girls (ONS, 2010b). Within Great Britain, drinking prevalence was lowest in Scotland for all age groups between 11 and 16 years.
Between 1991 and 2009 alcohol-related mortalityxii rates in the UK rose 86 per cent, from a rate of 6.9 per 100,000 to 12.8 per 100,000. In 2009 mortality rates among males were more than double the rates for females; 17.4 per 100,000 males and 8.4 per 100,000 females. In 2009
Office for National Statistics 21
Table 6
Percentage of adults
1reporting lifetime, last year and last
month
use
2of individual drugs, 2009
3United Kingdom Percentages
Lifetime Last year Last month
Men Women Total Men Women Total Men Women Total
Any drug 40.9 28.3 34.6 12.0 5.4 8.6 7.3 2.7 5.0
Amphetamines 13.7 8.0 10.9 1.4 0.6 1.0 0.5 0.2 0.3
Cannabis 35.3 23.5 29.4 9.5 4.0 6.7 5.8 2.0 3.9
Cocaine 11.2 5.6 8.4 3.9 1.4 2.6 1.8 0.6 1.2
ecstasy 11.4 5.4 8.4 2.6 0.9 1.7 1.1 0.3 0.7
LSD 7.8 3.1 5.4 0.4 0.1 0.3 0.2 0.0 0.1
Magic mushrooms 10.4 3.9 7.1 0.6 0.2 0.4 0.2 0.0 0.1
Opiates 1.3 0.6 1.0 0.3 0.1 0.2 0.2 0.0 0.1
1 Adults aged 16–59 in England and Wales; adults aged 16–64 in Scotland and Northern Ireland.
2 Frequent use was defined in the British Crime Survey as the use of any drug more than once a month in the past year. 3 Data for England and Wales are for 2009/10; data for Scotland and Northern Ireland are for 2008/09.
Source: UK Focal Point on Drugs, 2009, European Monitoring Centre for Drugs and Drug Addiction
In 2009/10, more than a third of people (34.6 per cent) in the UK reported that they had used drugs at least once in their lifetime (Table 6). Cannabis was the most frequently used drug in more than
one-quarter (29.4 per cent) of all cases reported by drug users.
Around 1 in 10 people (8.6 per cent) reported using drugs more than once a month in the past year. Prevalence was more than twice as high among men, with around 1 in 8 (12.0 per cent) reporting drug use in the last year compared to around 1 in 20 women (5.4 per cent). In 2009/10, around 1 in 20 people (5.0 per cent) in the UK reported using drugs in the last month.
Between 1993 and 2009, deaths related to drug misusexiii in England and Wales fell among the
youngest and oldest adult population. Among those aged under 20 rates have fallen 26 per cent for males – to 29 per 100,000, and 9 per cent for females – to 10 per 100,000; among those aged over 70 rates fell 25 per cent and 43 per cent respectively. In 2009 mortality rates from drug misuse were highest among those aged 30 to 39, 544 per 100,000 males and 97 per 100,000 females (ONS, 2010g).
The latest data for children show that within the UK current drug use was highest in Scotland, where 8.5 per cent reported using drugs in 2009/10, and lowest in Wales at 7.1 per cent (ONS, 2010b).
According to the UK Focal Point on Drugs reportxiv in 2007/08 there were more than 46,000 first
demands for drug treatment in the UK through a structured drug treatment programme such as a hospital inpatient, outpatient or through their GP. Opiates accounted for 41 per cent of the primary drug being treated for (UK Focal Point, 2009).
Studies by National Health Surveysxv indicate that in 2008–09, more than 1 in 3 males (39 per
Office for National Statistics 22 activity recommendations of 30 minutes or more vigorous activity on at least 5 days a weekxvi
(Table 7).
Among children, more than two-thirds of boys (68 per cent) and more than a half of girls (57 per cent) aged between 2 and 15 years met physical activity recommendations of 60 minutes activity on all 7 days a week.
Table 7
Physical activity levels of adults and children and
prevalence of BMI classed as ‘obese and overweight’:
1,2by
sex and age, 2008–09
3Great Britain Percentages
Males Females
Meets physical activity recommendations4 Low physical activity levels5 Obese or overweight Meets physical activity recommendations4 Low physical
activity levels5
Obese or overweight
2–152 68 21 31 57 28 28
16–24 53 16 35 35 31 39
25–34 50 19 52 36 24 44
35–44 45 23 71 34 27 54
45–54 41 25 79 32 32 63
55–64 33 37 81 28 37 68
65–74 20 47 81 17 52 74
75 and
over 10 68 71 6 78 61
All ages 39 30 60 29 37 52
1 Body mass index (BMI) greater than or equal to 25.
2 Data for Wales is based on self-reported weight and height and are not directly comparable with England and Scotland. For Wales, data are for children aged 2–15 with valid height and weight measurements, and based on the 85th (overweight) and 95th (obese) percentiles of the 1990 UK BMI reference curves. For Scotland, data for children whose BMI was more than 3 standard deviations above or below the norm for their age were excluded from the table. Physical activity data are for children aged 2–15 in England and Scotland; children aged 4–15 in Wales.
3 Based on 2009 mid-year population estimates.
4 Those classed as 'meeting recommendations' participated in 30 or more minutes of moderate or vigorous activity on at least 5 days a week.
5 'Low activity' levels indicate less than 30 minutes of moderate or vigorous activity per week. Source: The NHS Information Centre for Health and Social Care (IC (2010)); Welsh Government (Wales (2010)); Scottish Government (Scot (2010))
Physical activity decreased with age; for those aged 2 to 15, males were more than 7 times as likely and females 9 times more likely to meet physical activity recommendations than those aged 75 and over.
Office for National Statistics 23 premature death (IC, 2008). It is estimated that the obesity-related cost to the NHS is around £4.2 billion a year (DH, 2010).
In Great Britain, around two-thirds of males and around a half of females were considered obese or overweight in 2008–09. Obesity was more prevalent among those aged between 65 and 74 years, 81 per cent of males and 74 per cent of females.
Between 1995 and 2009 in England, the proportion of men classed as ‘overweight or obese’ increased from 59 per cent to 66 per cent, although this was a slight decrease from 67 per cent in 2006. Among women, obesity increased from 50 per cent in 1995 to just over 57 per cent in 2004, subsequently falling to slightly below 57 per cent in 2009 (IC, 2010).
Diet has an important influence on obesity and thus on health. A poor diet can result in a higher risk of disease, and a diet low in fruit and vegetables can result in chronic conditions such as cardiovascular disease, stroke and diabetes, while a diet high in saturated fat can result in raised blood cholesterol and coronary heart disease (IC, 2008).
Office for National Statistics 24
Excess winter mortality
In 2009/10 there were an estimated 28,200 excess winter deathsxvii in Great Britain, a fall of 29 per
cent compared with figures for 2008/09, despite Met Office data showing a lower average winter temperature in 2009/10 (2.5oC) than in 2008/09 (3.9oC) (MET)(Figure 6).
[image:24.595.61.506.260.473.2]Excess winter mortality peaked in 1962/63 with 96,700 deaths, coinciding with the lowest average winter temperature recorded between 1951/52 and 2009/10, 1.1oC.
Figure 6
Excess
winter
mortality
1and average winter temperature
Great Britain2
Number, temperature (oC)
0 20,000 40,000 60,000 80,000 100,000 120,000
Average winter temperature
Excess winter deaths
1951/52 1953/54 1955/56 1957/58 1959/60 1961/62 1963/64 1965/66 1967/68 1969/70 1971/72 1973/74 1975/76 1977/78 1979/80 1981/82 1983/84 1985/86 1987/88 1989/90 1991/92 1993/94 1995/96 1997/98 1999/00 2001/02 2003/04 2005/06 2007/08 2009/10 0 1 2 3 4 5 6 7
Temperature (°C)
Excess winter deaths
1 Excess winter mortality is defined by the Office for National Statistics as the difference between the number of deaths during the four winter months (December to March) and the average number of deaths during the preceding August to November and the following April to July. Figures are rounded to the nearest 100. Figures for the latest winter period are provisional. Data include deaths of non-residents.
2 Excess winter deaths in Great Britain; average winter temperature in the UK. Source: Office for National Statistics; National Records of Scotland; Met Office
In England and Wales, females experienced greater excess winter mortality than males, 14,800 compared with 10,600 respectively in 2009/10 (ONS, 2010h).
Of the 28,200 excess winter deaths in Great Britain in 2009/10, more than a half (55 per cent) were among people aged 85 and over, with around 1 in 10 (10 per cent) among people aged under 65 (ONS, 2010h, NRS 2010b).
Deaths from respiratory disease accounted for the majority of excess winter deaths, compared with other causes of death (ONS, 2010h). In the UK between 1999 and 2009, the total number of deaths from respiratory disease fell by around a third (30 per cent) from 109,300 to 76,700, coinciding with lower levels of excess winter mortality. It should be noted that in 1999 there was a flu epidemic which resulted in an increase in the number of respiratory deaths.
Office for National Statistics 25 per million and 17.4 per million respectively; equivalent figures for women were 180.9 per million and 12.5 per million, around 14 times higher among those age 85 and over.
The variation in the number of extra deaths in winter depends not only on temperature but also on the level of disease (particularly influenza) in the population. Influenza is often implicated in winter deaths as it can cause complications such as bronchitis and pneumonia, especially in the elderly. The winter of 2009/10 was the coldest in 14 years but influenza levels were below baseline levels for much of the winter season. The highest excess winter mortality in recent years was seen in 1999/2000, when influenza cases reached epidemic levels, but the average winter temperature was relatively mild. High levels of influenza were also seen in the winters of 1993/94, 1996/97, 1998/99 and 1999/2000, coinciding with years of high excess winter mortality (ONS, 2010h).
[image:25.595.62.473.421.631.2]In England and Wales, positive influenza specimens detected in laboratories between 1991 and 2009 peaked in 2009 at around 8,100, around 3 times higher than in 1991 when there were around 2,200 positive samples. On average, 21 per cent of positive influenza samples in England and Wales detected between 1991 and 2009 were among those aged over 65, although the proportion of over 65’s affected in 2009 was only 4 per cent compared with 17 per cent in 1991 (HPA, 2009).
Figure 7
Weekly GP consultations for influenza:
1,22009 to 2011
3England and Wales
Rates per 100,000 population
0 20 40 60 80 100 120 140 160
Jul 2009
Aug Sep Oct Nov Dec Jan Feb Mar Apr May Jun Jul Aug Sep Oct Nov Dec Jan
2010 2011
1 In England the definition 'Influenza-like illness' is used; in Wales 'Influenza'. 2 England and Wales include primary consultations only.
3 Weekly consultations between the start of July 2009 and the end of January 2011.
Source: Health Protection Agency; Royal College of General Practitioners; National Public Health Service, Wales
Office for National Statistics 26
7). In Scotland and Northern Ireland, rates peaked in January 2011, 77.3 per 100,000 and October
2009, 280.6 per 100,000 respectively, coinciding with the normal influenza season.
During the 2009/10 winter period (December to March), consultation rates peaked in the UK in December. Between the first week of December and the last week of March ILI consultation rates fell 96 per cent in Wales, 82 per cent in England, 79 per cent in Northern Ireland and 33 per cent in Scotland.
During the H1N1 pandemic, people also used the National Pandemic Flu Service which provided advice online or over the telephone. According to NHS Online, between 2009 and 2010 2.7 million people used this service, while 1.8 million people were able to obtain antiviral treatment without the need to visit a GP (NHS online 2010).
Immunising the elderly population against influenza is an important health programme among the UK health authorities. In 2000 immunisation was extended to those aged 65 and over, and in the UK 64 per cent of people aged 65 and over were immunised against influenza. Within five years, the immunisation rate in the UK had risen to over 75 per cent of over 65’s, but subsequently fell to around 72 per cent in 2009.
Office for National Statistics 27
Mental health
As with physical health, mental health is an important indicator of the health of the population. It is estimated that mental ill-health represents between 9 and 23 per cent of the total health burden in the UK (DH, 2010).
Common mental disorders (CMDs) are mental conditions that cause marked emotional distress and interfere with daily function, such as different types of depression and anxiety. Symptoms of depressive episodes include low mood, loss of interest and enjoyment. They impair emotional and physical well-being and behaviour. Anxiety disorders include generalised anxiety disorder (GAD), panic disorder, phobias, and obsessive and compulsive disorders (OCD), characterised by a combination of obsessive thoughts and compulsive behaviours (IC, 2009b).
Results from the Adult Psychiatric Morbidity Surveyxviii showed that in England, in 2007, around 1 in
6 adults (17.6 per cent) met the diagnostic criteria for at least 1 CMD in the week prior to interview
(Table 8). Women were more likely than men to have a CMD (21.5 per cent and 13.6 per cent
Office for National Statistics 28
Table 8
Prevalence of a common mental disorder (CMD) in past
week
1: by sex and CMD
2England Percentages
1993 2000 2007
Men
Mixed anxiety and depressive disorder 5.3 7.5 7.6
Generalised anxiety disorder 3.7 4.7 3.6
Depressive episode 1.7 2.6 2.2
All phobias 1.1 1.6 1.0
Obsessive compulsive disorder 1.0 1.0 1.1
Panic disorder 0.9 0.6 1.0
Any CMD 11.9 14.6 13.6
Women
Mixed anxiety and depressive disorder 9.7 11.4 11.8
Generalised anxiety disorder 5.0 4.8 5.8
Depressive episode 2.7 2.9 3.0
All phobias 2.4 2.3 2.4
Obsessive compulsive disorder 1.8 1.5 1.5
Panic disorder 1.0 0.8 1.4
Any CMD 19.1 20.4 21.5
All adults
Mixed anxiety and depressive disorder 7.5 9.4 9.7
Generalised anxiety disorder 4.4 4.7 4.7
Depressive episode 2.2 2.8 2.6
All phobias 2.2 2.8 2.6
Obsessive compulsive disorder 1.4 1.2 1.3
Panic disorder 1.0 0.7 1.2
Any CMD 15.5 17.5 17.6
1 Adults aged 16–64 and living in England. 2 An individual can have more than one CMD.
Source: The NHS Information Centre for Health and Social Care (IC, 2009)
Prevalence of a CMD in all adults increased from 15.5 per cent in 1993 to 17.5 per cent in 2000, although there was little change between 2000 and 2007.
Office for National Statistics 29 In 2009/10, in England more than 1 in 10 people (10.9 per cent) were diagnosed with depression, with 0.8 per cent diagnosed with a mental illness such as schizophrenia and 0.5 per cent
diagnosed with dementia. Within the rest of the UK, depression affected 11.5 per cent of the population of Northern Ireland, 8.6 per cent in Scotland and 7.9 per cent in Wales (ONS, 2010b).
Between 2006/07 and 2008/09, there were an estimated 437,000 cases in Great Britain of self-reported stress, depression or anxiety caused or made worse by a current or recent job. In 2009/10 this resulted in approximately 9.8 million working days lost in Britain. Although those working in ‘health and social work’ reported more cases (76,000), the industry with the highest prevalence rate was ‘public administration and defence; compulsory social security’ at 2,300 per 100,000 employees, four times higher than those working in the construction industry, 600 per 100,000 (DH, 2010).
In Great Britain prevalence of work-related stress was highest among females in 2008/09, with 233,000 cases compared with 182,000 for males. Among both sexes, prevalence was greater among the 45- to 54-year-old age-group, 1,700 per 100,000 males and 2,000 per 100,000 females (HSE, 2010).
Around a quarter (24 per cent) of adults with a CMD were receiving treatment for an emotional or mental problem: 14 per cent were taking psychoactive medication, 5 per cent were receiving counselling or therapy and 5 per cent were in receipt of both medication and counselling or therapy. Overall, three-quarters of adults assessed as having a level of neurotic symptoms sufficient to warrant treatment were not in receipt of medication or counselling (IC, 2009b).
In England antidepressant prescriptions have risen by 334 per cent, from 9.0 million in 1991 to 39.1 million in 2009. Within the UK, antidepressant prescriptions have also risen by 88 per cent in Wales between 2000 and 2009, by 54 per cent in Scotland between 2001 and 2010, and by 60 per cent in Northern Ireland between 2000 and 2008.
Mental health problems can ultimately lead people to commit suicide. Between 1991 and 2009, in the UK, suicides have fallen among all adult age-groups and both males and females. In 1991, 4,670 males committed suicide and this decreased by 7.9 per cent to 4,300 in 2009; among females suicides fell 16.7 per cent from 1,650 in 1991 to 1,370 in 2009 (ONS, 2010i).
Office for National Statistics 30
References
BHF (2010), British Heart Foundation, A prescription for the UK’s heart health. Available at
www.bhf.org.uk/publications/publications-search-results.aspx?m=simple&q=a+prescription+for+the+UKs+heart+health&r=50
Cancer Research UK (2010a). Cancer Stats – Key Facts. Available at
http://info.cancerresearchuk.org/cancerstats/keyfacts/Allcancerscombined/
Cancer Research UK (2010b). Number of deaths and age-specific mortality rates, UK, 2008. Available at
http://info.cancerresearchuk.org/cancerstats/types/lung/mortality/
Cancer Research UK (2010c). Age-standardised (European) cancer mortality rates per 100,000 population, lung cancer, by sex, EU-27, 2008 estimates. Available at http://info.cancerresearchuk.org/cancerstats/types/lung/mortality/
Cancer Research UK (2010d). Pancreatic Cancer (C25), Numbers of new cases and age-specific incidence rates, UK, 2007. Available at http://info.cancerresearchuk.org/cancerstats/types/pancreas/incidence/#age
Cancer Research UK (2010e). Pancreatic Cancer (C025), Number of deaths and age-specific mortality rates, UK, 2008. Available at http://info.cancerresearchuk.org/cancerstats/types/pancreas/mortality/
Cancer Research UK (2010f). Smoking Statistics – Smoking and Cancer.’ Available at
http://info.cancerresearchuk.org/cancerstats/types/lung/smoking/
DH (2005). Choosing a Better Diet. Available at
www.dh.gov.uk/en/Publicationsandstatistics/Publications/PublicationsPolicyAndGuidance/DH_4105356
DH (2010). Healthy Lives, Healthy People: Our strategy for public health in England. Available at
www.dh.gov.uk/en/Publicationsandstatistics/Publications/PublicationsPolicyAndGuidance/DH_121941
HMT (2010). Chapter 9 Tables. Available at www.hm-treasury.gov.uk/pesa2010_section4.htm
HPA (2009). Influenza specimens detected in England and Wales, 1991–2009; positive influenza samples detected by regional laboratories’ available at
www.hpa.org.uk/web/HPAwebFile/HPAweb_C/1194947397287
HSE (2010). Table STRAGE1W12 - 2008/09. Available at www.hse.gov.uk/statistics/lfs/0809/strage1w12.htm
IC (2008). Health Survey for England, 2006: CVD and risk factors adults, obesity and risk factors children. Available at www.ic.nhs.uk/statistics-and-data-collections/health-and-lifestyles-related-surveys/health-survey-for-england/health-survey-for-england-2006:-cvd-and-risk-factors-adults-obesity-and-risk-factors-children
IC (2009a) Smoking, drinking and drug use among young people in England in 2009. Available at
www.ic.nhs.uk/statistics-and-data-collections/health-and-lifestyles-related-surveys/smoking-drinking-and-drug-use-among-young-people-in-england/smoking-drinking-and-drug-use-among-young-people-in-england-in-2009
IC (2009b). Adult Psychiatric Morbidity Survey 2007, results of a household survey. Available at
Office for National Statistics 31
IC (2010). Health Survey for England, 2009. Available at www.ic.nhs.uk/statistics-and-data-collections/health-and-lifestyles-related-surveys/health-survey-for-england/health-survey-for-england--2009-health-and-lifestyles
International Agency for Research on Cancer (2010). Global Cancer (Globocan) data tool. Available at
www.iarc.fr/en/research-groups/index.php
MET, UK Mean Temperature. Available at www.metoffice.gov.uk/climate/uk/datasets/Tmean/ranked/UK.txt
NHS (2009), www.nhsconfed.org/Publications/Documents/Briefing_193_Alcohol_costs_the_NHS.pdf NHS online (2008), 2007/08 Annual Report, available at
www.nhsdirect.nhs.uk/en/About/OperatingStatistics/Annual Report2007-2008
NHS online (2010), 2009/10 Annual Report, available at
www.nhsdirect.nhs.uk/en/About/OperatingStatistics/AnnualReport2009-2010
NRS (2010)a, National Records of Scotland, Table 4.5: Infant deaths by sex and cause, Scotland, 1999 to 2009. Available atwww.gro-scotland.gov.uk/statistics/theme/vital-events/general/ref-tables/2009/stillbirths-infant-deaths.html
NRS (2010)b National Records of Scotland, Increased winter mortality, mean winter temperature and indicators of level of influenza activity, Scotland, 1951/52 – 2009/10. Available at
www.gro-scotland.gov.uk/statistics/theme/vital-events/deaths/increased-winter-mortality/2009-10/tables-and-charts.html
OECD (2010). OECD Health Data 2010 – Frequently Requested Data. Available at www.oecd.org/document/16/0,3343,en_2649_34631_2085200_1_1_1_1,00.html
ONS (1995),Cancer survival: Five-year relative survival rate in most affluent group, and difference (gap) between most affluent and most deprived groups, for cancers with more than 1,000 patients, 1986–1990. Available at
www.statistics.gov.uk/statbase/xsdataset.asp?vlnk=979&More=Y
ONS (2009). Smoking-related behaviour and attitudes 2008–09. Available at
www.statistics.gov.uk/StatBase/Product.asp?vlnk=1638&Pos=2&ColRank=2&Rank=224
ONS (2010a), Cancer survival in England: one-year and five-year survival for 21 common cancers, by sex and age. Patients diagnosed 2004–2008 and followed up to 2009. Available at
www.statistics.gov.uk/StatBase/Product.asp?vlnk=14007
ONS (2010b). United Kingdom Health Statistics no.4, 2010. Available at www.statistics.gov.uk/statbase/Product.asp?vlnk=6637
ONS (2010c). Mortality Statistics: Deaths registered in 2009. Available at www.statistics.gov.uk/statbase/product.asp?vlnk=15096
ONS (2010d). Health expectancies at birth and at age 65 in the United Kingdom 2000–02 to 2006–08. Available at
www.statistics.gov.uk/StatBase/Product.asp?vlnk=12964&Pos=1&ColRank=2&Rank=272
ONS (2010e). June 2011 - Cancer incidence and mortality 2006–08 Statistical Bulletin. Available at
www.statistics.gov.uk/StatBase/Product.asp?vlnk=14209&Pos=&ColRank=2&Rank=272
Office for National Statistics 32
ONS (2010g). Deaths related to drug poisoning. Available at www.statistics.gov.uk/statbase/ssdataset.asp?vlnk=7892
ONS (2010h). Excess Winter Mortality Statistical Bulletin – November 2010. Available at
www.statistics.gov.uk/StatBase/Product.asp?vlnk=10805&Pos=1&ColRank=1&Rank=272
ONS (2010i). Suicide rates in the UK 1991–2009. Available at www.statistics.gov.uk/statbase/Product.asp?vlnk=13618 ONS (2011). General Lifestyle Survey 2009 Data. Available at
www.statistics.gov.uk/StatBase/Product.asp?vlnk=5756&Pos=&ColRank=1&Rank=256
Scot (2010). Scottish Health Survey. Available at www.scotland.gov.uk/Topics/Statistics/Browse/Health/scottish-health-survey
UK Focal Point (2009). UK Focal Point on Drugs, Annual Report to the European Monitoring Centre for Drugs and Drug
Addiction (EMCDDA), 2009. Available at www.nwph.net/ukfocalpoint/
Office for National Statistics 33
Notes
i The OECD is a unique forum where the governments of 30 democracies work together to address the economic, social and environmental challenges of globalisation. The Organisation provides a setting where governments can compare policy experiences, seek answers to common problems, identify good practice and work to co-ordinate domestic and international policies.
The OECD member countries are Australia, Austria, Belgium, Canada, the Czech Republic, Denmark, Finland, France, Germany, Greece, Hungary, Iceland, Ireland, Italy, Japan, Korea, Luxembourg, Mexico, the Netherlands, Norway, Poland, Portugal, the Slovak Republic, Spain, Sweden, Switzerland, Turkey, the UK and the United States. The Commission of the European Communities takes part in the work of the OECD.
ii Analyses of the effects of premature death assume that everyone may live to some arbitrarily chosen age and that death at a younger age means that some future years of life have been lost. Calculations of years of life lost are made for deaths from selected causes with the aim of illustrating the relative effects from different diseases.
iii Total Expenditure on Services (TES) is the spending aggregate that is allocated to function and covers most expenditure by the public sector that is included in Total Managed Expenditure (TME).
iv P00−P96 Certain conditions originating in the perinatal (deaths within 7 days of birth) period include;
P00−P04 Foetus and newborn affected by maternal factors and by complications of pregnancy, labour and delivery
P05−P08 Disorders related to length of gestation and foetal growth
P20−P29 Respiratory and cardiovascular disorders specific to the perinatal period
P35−P39 Infection specific to the perinatal period
P50−P61 Haemorrhagic and haematological disorders of the foetus and newborn
P75−P78 Digestive system disorders of foetus and newborn
P90−P96 Other disorders originating in the perinatal period
v Healthy life expectancy (HLE) and disability-free life expectancy are summary measures of population health that combine mortality and ill health. In contrast to life expectancy, these two indicators measure both the quality and quantity of life. Essentially they partition life expectancy into the following two components:
years lived free from ill health or disability
years lived in ill health or with a disability
Office for National Statistics 34
HLE at birth is defined as the number of years that a newly born baby can expect to live in good or fairly good health if he or she experienced current mortality rates and ‘good’ or ‘fairly good’ health rates, based on self-assessed general health for different age-groups during their lifespan.
Disability-free life expectancy, defined as expected years lived without a limiting long-standing illness, is calculated in the same way as HLE, except that is uses the GLF/CHS age-sex rates of ‘without limiting long-standing illness’ instead of rates of ‘good/fairly good’ health.
vi In the General Lifestyle Survey, information on chronic sickness was obtained from the following two-part question:
‘Do you have any longstanding illness, disability or infirmity? By longstanding, I mean anything that has troubled you over a period of time or that is likely to affect you over a period of time.
IF YES
Does this illness or disability limit your activities in any way?’
‘Longstanding illness’ is defined as a positive answer to the first part of the question and ‘limiting longstanding illness’ as a positive answer to both parts of the question.
vii Directly age-standardised incidence rates enable comparisons to be made between geographical areas over time, and between the sexes, which are independent of changes in the age structure of the population. In each year the crude rates in each five-year age group are multiplied by the European standard population for that age group. These are then summed and divided by the total standard population for these age groups to give an overall standardised rate.
ix The NHS Breast Screening Programme provides free breast screening every three years for all women in the UK aged 50 and over. Around one-and-a-half million women are screened in the UK each year.
x There is no organised screening programme for prostate cancer in the UK but an informed choice programme, Prostate Cancer Risk Management, has been introduced. The aim of Prostate Cancer Risk Management is to ensure that men who are concerned about the risk of prostate cancer receive clear and balanced information about the advantages and disadvantages of the PSA test and treatment for prostate cancer.
xi Current guidelines from the Chief Medical Officer for England suggest that consuming 3 to 4 units of alcohol per day for men and 2 to 3 units for women should not lead to significant health risks. Individuals identified at highest risk of alcohol-related harm are those who regularly drink at least twice the recommended daily limit.
xii The Office for National Statistics (ONS) definition of alcohol-related deaths includes only those causes regarded as being most directly a result of alcohol consumption. It does not include other disease where alcohol has been shown to have some causal relationship, such as cancers of the mouth, oesophagus and liver.
The definition includes all deaths from chronic liver disease and cirrhosis (excluding biliary cirrhosis), even when alcohol is not specifically mentioned on the death certificate. Apart from deaths due to poisoning with alcohol (accidental, intentional or undetermined), this definition excludes any other external causes of death, such as road traffic accidents and other accidents.
Office for National Statistics 35
F10 Mental and behavioural disorders due to use of alcohol
G31.2 Degeneration of nervous system due to alcohol
G62.1 Alcoholic polyneuropathy
I42.6 Alcoholic cardiomyopathy
K29.2 Alcoholic gastritis
K70 Alcoholic liver disease
K73 Chronic hepatitis, not elsewhere classified
K74 Fibrosis and cirrhosis of liver (excluding K74.3–K74.5 – Biliary cirrhosis)
K86.0 Alcohol