Pam Sammons,
Kathy Sylva,
Edward Melhuish, Iram Siraj-Blatchford, Brenda Taggart,
Diana Draghici, Katalin Toth and Rebecca Smees
Effective Pre-School, Primary and Secondary Education Project (EPPSE 3-14)
The EPPSE 3-14 Research Team
Principal Investigators
Professor Kathy Sylva
Department of Education, University of Oxford
00 44 (0)1865 274 008 / email kathy.sylva@education.ox.ac.uk
Professor Edward Melhuish
Institute for the Study of Pupils, Families and Social Issues
Birkbeck University of London
00 44 (0)207 079 0834 / email e.melhuish@bbk.ac.uk
Professor Pam Sammons
Department of Education, University of Oxford
00 44 (0)1865 274 142/ email pamela.sammons@education.ox.ac.uk
Professor Iram Siraj-Blatchford
Institute of Education, University of London
00 44 (0)207 612 6218 / email i.siraj-blatchford@ioe.ac.uk
*Brenda Taggart
Institute of Education, University of London
00 44 (0)207 612 6219 / email b.taggart@ioe.ac.uk
Research Officers
Dr Katalin Toth
Institute of Education, University of London
00 44 (0)207 911 5587 / email k.toth@ioe.ac.uk
Diana Draghici
Institute of Education, University of London
00 44 (0)207 612 6608 / email d.draghici@ioe.ac.uk
Dr Aziza Mayo
Institute of Education, University of London
00 44 (0)207 331 5110 / email a.mayo@ioe.ac.uk
Rebecca Smees
Department of Education, University of Oxford
00 44 (0)1865 274 142 / email pamela.sammons@education.ox.ac.uk
**Wesley Welcomme
Institute of Education, University of London
00 44 (0)207 612 6684 / email w.welcomme@ioe.ac.uk
Authors
Pam Sammons
Kathy Sylva
Edward Melhuish
Iram Siraj-Blatchford
Brenda Taggart
Diana Draghici
Katalin Toth
Rebecca Smees
A
CKNOWLEDGEMENT
The EPPSE 3-14 project is a major longitudinal study funded by the Department for Education (DfE).
The research would not be possible without the support and co-operation of the six Local Authorities
(LAs), and the many pre-school centres, primary schools, secondary schools, and the young people
and parents participating in the research.
The views expressed in this report are the authors’ and do not necessarily reflect those of the
Department for Education
Table of Contents
Executive Summary ...i
INTRODUCTION... 1
Background: The EPPSE 3-14 Project ... 1
Aims ... 2
Analytical strategy and structure of the report ... 2
Methodology ... 5
Treatment of incomplete data ... 5
Multiple imputation ... 5
Maximum likelihood estimation ... 6
Statistical techniques... 6
SECTION 1: Characteristics of the sample at the end of Key Stage 3 (KS3) ... 7
SECTION 2: Social-behavioural outcomes at Key Stage 3 (Year 9, age 14) ... 9
2.1. Creating measures of social-behavioural outcomes in Year 9 ... 9
2.2. Theoretical background to social-behavioural outcomes ... 12
2.3. Variation between students in their social behaviour ... 14
SECTION 3: The influence of individual student, family factors, Home Learning Environment
and homework on social-behavioural outcomes ... 19
Section 3.1: The influence of student and family characteristics ... 19
Section 3.1.1: The influence of individual and family characteristics on self-regulation ... 20
Section 3.1.2: The impact of individual and family factors on pro-social behaviour ... 26
Section 3.1.3: The impact of individual and family factors on hyperactivity ... 30
Section 3.1.4: The impact of individual and family factors on anti-social behaviour... 34
Section 3.2: The influence of Home Learning Environment and Homework ... 38
Section 3.2.1: The influence of Home Learning Environment (HLE) and time spent on homework
on ‘self-regulation’ ... 38
Section 3.2.2: The influence of HLE and homework on pro-social behaviour ... 43
Section 3.2.3: The influence of HLE and homework on hyperactivity ... 47
Section 3.2.4: The impact of HLE and homework on anti-social behaviour ... 51
Section 3.3: Neighbourhood influences on social-behavioural outcomes in Year 9 ... 55
Section 3.3.1: The impact of the neighbourhood on self-regulation ... 56
Section 3.3.2: The influence of the neighbourhood on pro-social behaviour ... 59
Section 3.3.3: The influence of the neighbourhood on hyperactivity ... 60
Section 3.3.4: The influence of the neighbourhood on anti-social behaviour ... 64
SECTION 4: The influence of pre-school, primary and secondary school on social-behavioural
outcomes in Year 9 ... 66
Section 4.1: The influence of pre-school on social behaviours in Year 9 ... 66
Section 4.1.1: The influence of pre-school on Self-Regulation ... 67
Section 4.1.2: The influence of pre-school on pro-social behaviour ... 71
Section 4.1.3: The influence of pre-school on hyperactivity ... 74
Section 4.1.4: The influence of pre-school on anti-social behaviour ... 77
Section 4.2: The influence of primary school on social-behavioural outcomes in Year 9... 80
Section 4.3: The influence of secondary school academic effectiveness, school-level social
composition and Ofsted judgments of quality on social-behavioural outcomes in Year 9 ... 81
Section 4.3.2: The influence of secondary school academic Ofsted judgments of quality on
pro-social behaviour ... 90
Section 4.3.3: The Impact of Secondary School Ofsted Judgments of Quality on Hyperactivity ... 96
Section 4.3.4: The Impact of Secondary Ofsted Judgments of Quality on Anti-Social Behaviour 100
SECTION 5: The Impact of Students’ Views of School and Self-Perceptions and on
Social-behavioural Outcomes in Year 9 ... 104
Section 5.1: The Impact of Teaching and School Processes on Students’ Social-behavioural
Outcomes in Year 9 ... 105
5.1.1. Emphasis on Learning ... 105
5.1.2. School Negative Behavioural Climate ... 108
5.1.3. Headteacher Qualities ... 112
5.1.4. School Physical Environment ... 115
5.1.5. Valuing Pupils ... 116
5.1.6. Teacher Discipline ... 119
5.1.7. School Learning Resources ... 119
5.1.8. Teacher Support ... 121
Section 5.2: The Impact of Students’ Self-Perceptions on Their Social-behavioural Outcomes in
Year 9 ... 124
5.2.1 Academic Self-Concept: Mathematics and English ... 124
5.2.2 Enjoyment of School ... 129
5.2.3. Popularity ... 131
5.2.4. Anxiety Behaviours ... 131
5.2.5. Citizenship Values ... 133
SECTION 6: Exploring Developmental Progress Across Key Stage 3 ... 138
Section 6.1: Statistical Associations between Pre- and Post- Key Stage 3 Levels of
Social-behavioural Outcomes ... 138
Section 6.2: Factors Associated with Developmental Progress Across Key Stage 3 ... 143
Section 6.2.1: The Influence of Individual Background Factors, Family Factors, and Home
Learning Environment on Developmental Progress Across Key Stage 3 ... 143
Individual Factors ... 143
Family Factors ... 143
Home Learning Environment ... 144
Section 6.2.2: The Influence of Educational Environments on Developmental Progress Across Key
Stage 3 ... 149
Emphasis on Learning ... 150
Teacher Support... 155
Learning Resources ... 159
Valuing Pupils ... 164
Negative Behavioural Climate ... 169
SECTION 7: Summary and Conclusions ... 174
References... 182
Glossary of terms... 188
APPENDIX 1: Additional notes on the distribution of the sample. ... 196
APPENDIX 2 The Multiple Imputation Procedure ... 196
APPENDIX 3: Structural Equation Modelling ... 201
APPENDIX 4: Computation of Effect Sizes ... 203
APPENDIX 6: Measuring the Quality of the Early Years and the Key Stage 2 Home Learning
Environment ... 210
A.5.1. The Early Years Home Learning Environment (Early Years HLE) ... 210
A.6.2. The Key Stage 2 Home Learning Environment (KS2 HLE) ... 211
APPENDIX 7: Additional Sets of Estimates ... 212
A.71.2. Pro-Social Behaviour ... 216
A.7.1.3. Hyperactivity ... 221
A.7.1.4. Anti-Social Behaviour ... 226
APPENDIX 8: The Factorial Composition for Self-Perceptions/ Dispositions and Views of
School ... 230
A.8.1. The Factorial Composition for Self-Perceptions/ Dispositions ... 230
List of Figures
FIGURE 1: Summary of the analyses strategy: Different groups of predictors tested in relation to
Bronfenbrenner’s (1979) ecological model of human development. ... 3
FIGURE 2.1.1: Measuring social-behavioural outcomes in Y9: Structural Equations Confirmatory Factors
Analysis ... 10
FIGURE 2.3.1: Distribution of self-regulation scores ... 15
FIGURE 2.3.2: Distribution of pro-social behaviour scores... 16
FIGURE 2.3.3: Distributions of hyperactivity scores ... 17
FIGURE 2.3.4: Distribution of anti-social behaviour ... 18
FIGURE 4.1.1.1: Interaction effects between pre-school quality (ECERS-E) and early years HLE on
self-regulation in Year 9 ... 70
FIGURE 4.2.1.1: Interaction effects between pre-school quality (ECERS-E) and early years HLE on pro-social
behaviour in Year 9 ... 74
FIGURE 4.1.4.1:Interaction effects between pre-school quality (ECERS-E) and early years HLE on anti-social
behaviour in Year 9 ... 80
FIGURE 4.3.1.1: Interaction between secondary school quality (Ofsted overall judgement) and Multiple
Disadvantage Index of Risk on self-regulation in Year 9 ... 87
FIGURE 4.3.1.2: Interaction between secondary school quality (Ofsted overall judgement) and mother’s
highest qualification level on self-regulation in Year 9 ... 88
FIGURE 4.3.1.3: Interaction between secondary school quality (Ofsted overall judgement) and family highest
SES at KS2 on self-regulation in Year 9 ... 89
FIGURE 4.3.2.1: Interaction effects - Secondary school quality (Ofsted Overall Judgment) and Multiple
Disadvantage Index of Risk on pro-social behaviour in Year 9 ... 94
FIGURE 4.3.2.2: Interaction effects - Secondary school quality (Ofsted Overall Judgment) and mother’s
highest qualification level on pro-social behaviour in Year 9 ... 94
FIGURE 4.3.2.3: Interaction effects - Secondary school quality (Ofsted Overall Judgment) and family highest
socio-economic status at KS2 on pro-social behaviour in Year 9 ... 95
FIGURE 4.3.3.1: Interaction effects - Secondary school quality (Ofsted Overall Judgment) and Multiple
Disadvantage Index of Risk on hyperactivity in Year 9 ... 97
FIGURE 4.3.3.2: Interaction effects -
Secondary school quality (Ofsted Overall Judgment) and mother’s
highest qualification on hyperactivity in Year 9 ... 98
FIGURE 4.3.3.3: Interaction effects - Secondary school quality (Ofsted Overall Judgment) and family highest
socio-economic status at KS2 on hyperactivity in Year 9 ... 99
FIGURE 4.3.4.1: Interaction effectsd - Secondary school quality (Ofsted Overall Judgment) and Multiple
Disadvantage Index of Risk on anti-social behaviour in Year 9 ... 101
FIGURE 4.3.4.2: Interaction effects -
Secondary school quality (Ofsted Overall Judgment) and mother’s
highest qualification level on anti-social behaviour in Year 9 ... 102
FIGURE 4.3.4.3: Interaction effects - Secondary school quality (Ofsted Overall Judgment) and family highest
socio-economic status at KS2 on anti-social behaviour in Year 9 ... 102
FIGURE 6.1.1: Correlation Analysis of Self-Regulation Levels in Year 9 and Year 6 ... 139
FIGURE 6.1.2: Correlation Analysis of Pro-Social Behaviour Levels in Year 9 and Year 6 ... 140
FIGURE 6.1.3: Correlation Analysis of Hyperactivity Levels in Year 9 and Year 6 ... 141
FIGURE 6.1.4: Correlation Analysis of Anti-Social Behaviour Levels in Year 9 and Year 6 ... 142
FIGURE A.2.1: The Multiple Imputation Procedure: A Stylized Representation ... 197
FIGURE A.5.5: Variations in Self-Regulation Scores Across Secondary Schools in Year 9: Level-2 Residual vs.
Rank of Residual Plot, with Corresponding 95% Confidence Interval Error Bars (Valid Sample) ... 205
List of Tables
TABLE 1: Summary of background influences on social-behavioural outcomes ... iv
TABLE 3.1.1.1: Contexualised Model 1: Self-regulation ... 20
TABLE 3.1.1.2: Contexualised Model 2: Self-regulation ... 24
TABLE 3.1.2.1: Contexualised Model 1: Pro-social behaviour... 27
TABLE 3.1.3.1: Contexualised Model 1: Hyperactivity ... 30
TABLE 3.1.3.2: Contexualised Model 2: Hyperactivity ... 32
TABLE 3.1.4.1: Contexualised Model 1: Anti-social behaviour ... 34
TABLE 3.1.4.2: Contexualised Model 2: Anti-social behaviour ... 35
TABLE 3.1: Summary of background influences on social behaviours in Year 9 ... 37
TABLE 3.2.1.1: Contextualised Model: Influence of early years HLE on self-regulation in Yr9 ... 39
TABLE 3.2.1.2: Contextualised Model: Influence of KS 2 HLE on self-regulation in Year 9 ... 40
TABLE 3.2.1.3: Contextualised Model: Influence of homework on self-regulation in Year 9 ... 41
TABLE 3.2.2.1: Contextualised Model: Influence of early years HLE on pro-social behaviour ... 43
TABLE 3.2.2.2: Contextual Model: Influence of KS 2 HLE pro-social behaviour in Year 9 ... 45
TABLE 3.2.2.3: Contextual Model: Influence of homework on pro-social behaviour in Year 9 ... 46
TABLE 3.2.3.1: Contextualised Model: Influence of early years HLE on hyperactivity in Year 9... 47
TABLE 3.2.3.2: Contextualised Model: Influence of KS2 HLE on hyperactivity in Year 9 ... 48
TABLE 3.2.3.3: Contextualised Model: Influence of homework on hyperactivity in Year 9 ... 50
TABLE 3.2.4.1: Contextual Model: Influence of EY HL on anti-social behaviour in Year 9 ... 51
TABLE 3.2.4.2: Contextual Model: Influence of KS2 HLE on anti-social behaviour in Year 9 ... 52
TABLE 3.2.4.3: Contextual model: Influence of homework on anti-social behaviour in Year 9 ... 53
TABLE 3.3.1.1 The influence of the IDACI on self-regulation in Year 9 ... 56
TABLE 3.3.1.2: The influence of neighbourhood crime score on self-regulation in Year 9 ... 57
TABLE 3.3.1.3 The influence of the incidence of limiting long-term illness on self-regulation ... 58
TABLE 3.3.2.2: The influence of the neighbourhood crime on pro-social behaviour in Year 9 ... 59
TABLE 3.3.3.1: The influence of neighbourhood IMD on hyperactivity in Year 9 ... 60
TABLE 3.3.3.2: The influence of the neighbourhood IDACI on hyperactivity in Year 9... 61
TABLE 3.3.3.3:The influence of employment on hyperactivity in Year 9 ... 62
TABLE 3.3.3.4: The influence of neighbourhood crime score on hyperactivity in Year 9 ... 63
TABLE 3.3.4.1: The influence of neighbourhood IDACI on anti-social behaviour ... 64
TABLE 3.3.4.2: The influence of neighbourhood crime on anti-social behaviour in Year 9 ... 65
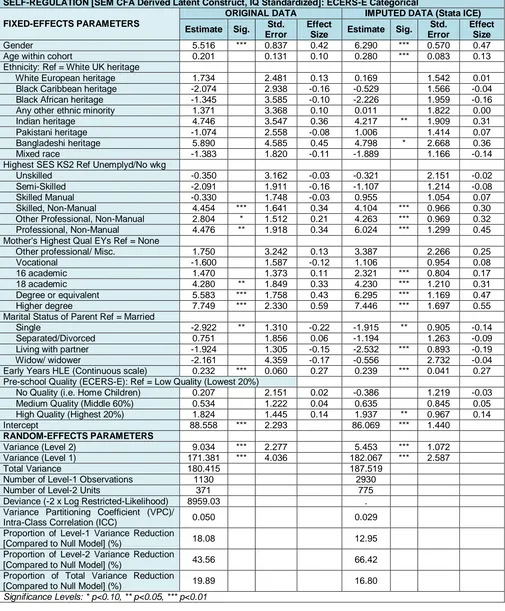
TABLE 4.1.1.1: Contextualised Model: Influence of pre-school quality (ECERS-R) on self-regulation in Year 9
... 68
TABLE 4.1.1.2: Contextualised Model: Influence of pre-school quality (ECERS-E) on self-regulation in Year 9
... 69
TABLE 4.1.2.1: Contextualised Model: Influence of pre-school quality (ECERS-R) pro-social behaviour in Year
9 ... 72
TABLE 4.1.2.2: Contextualise Model: Influence of pre-school quality (ECERS-E) on pro-social behaviour in
Year 9 ... 73
TABLE 4.1.3.1:Contextualised Model: Influence of pre-school quality (ECERS-R) on hyperactivity in Year 9 . 75
TABLE 4.1.3.2: Contextualise Model: Influence of pre-school quality (ECERS-E) on hyperactivity in Year 9 .. 76
TABLE 4.1.4.1: Contextualised Model: Influence of pre-school quality (ECERS-R) on anti-social behaviour in
Year 9 ... 78
TABLE 4.1.4.2:Contextualised Model: Influence of pre-school quality (ECERS-E) on anti-social behaviour in
Year 9 ... 79
TABLE 4.3.1.1:Contextualised Model: Influence of secondary school quality (Ofsted behaviour of learners) on
self-regulation in Year 9 ... 83
TABLE 4.3.1.3: Interaction effect - Secondary school quality (Ofsted overall judgment) and Multiple
Disadvantage Index of Risk on self-regulation in Year 9 ... 86
TABLE 4.3.2.1: Contextualised Model: Influence of secondary school Quality (Ofsted inspection judgment,
Behaviour of learners) on pro-social behaviour in Year 9 ... 91
TABLE 4.3.2.2: Contextualised Model: Influence of secondary school quality (Ofsted development and
well-being of learners) on pro-social behaviour in Year 9 ... 92
TABLE 4.3.2.3: Interaction effects -Secondary school quality (Ofsted Overall Judgment) and Multiple
Disadvantage Index of Risk on pro-social behaviour in Year 9 (Hierarchical Linear Model) ... 93
TABLE 4.3.3.1: Interaction effects - Secondary school quality (Ofsted Overall Judgment) and Multiple
Disadvantage Index of Risk on hyperactivity in Year 9 ... 96
FIGURE 4.3.4.1: Interaction effects - Secondary school quality (Ofsted Overall Judgment) and Multiple
Disadvantage Index of Risk on anti-social behaviour in Year 9 ... 100
TABLE 5.1.1.1: The influence of students’ views of school (Emphasis on Learning) on self-regulation in Year 9
... 106
TABLE 5.1.1.2: The influence of students’ views of school (Emphasis on Learning) on pro-social behaviour in
Year 9 ... 107
TABLE 5.2.2.4: The influence of students’ self-perceptions (Enjoyment of School) on anti-social behaviour in
Year 9 ... 131
TABLE 5.2.4.1: The influence of students’ self-perceptions (Anxiety Behaviours) on self-regulation in Year 9
... 132
TABLE 5.2.4.2: The influence of students’ self-perceptions (Anxiety Behaviours) on hyperactivity in Year 9 132
TABLE 5.2.4.3: The influence of students’ self-perceptions (Anxiety Behaviours) on anti-social behaviour in
Year 9 ... 133
TABLE 5.2.5.1: The influence of students’ self-perceptions (Citizenship Values) on self-regulation in Year 9 134
TABLE 5.2.5.2: The influence of students’ self-perceptions (Citizenship Values) on pro-social behaviour in
Year 9 ... 134
TABLE 5.2.5.3: The influence of students’ self-perceptions (Citizenship Values) on hyperactivity in Year 9.. 135
TABLE 5.2.5.4: The influence of students’ self-perceptions (Citizenship Values) on anti-social behaviour in
Year 9 ... 135
TABLE 5.1: The Influence of Students’ Views of Schools and Self-Perceptions on Social/ Behavioural
Outcomes in Year 9: Comparisons of Relative Effect Sizes (Original data) ... 136
TABLE 5.2: The Inflence of Students’ Views of Schools and Self-Perceptions on Social/ Behavioural Outcomes
in Year 9: Comparisons of Relative Effect Sizes (Imputed data) ... 137
TABLE 6.1.1: Value-Added Model for Self-Regulation ... 139
TABLE 6.1.2: Value-Added Model for Pro-Social Behaviour ... 140
TABLE 6.1.3: Value-Added Model for Hyperactivity ... 141
TABLE 6.1.4: Value-Added Model for Anti-Social Behaviour ... 142
TABLE 6.2.1.1: The influence of individual background, family factors, and home learning environment on
changes in self-regulation across KS3 (contextual value-added model) ... 145
TABLE 6.2.1.2: The influence of individual background, family factors, and HLE on changes in pro-social
behaviour levels across KS3 (contextual value-added model)... 146
TABLE 6.2.1.3: The influence of individual background, family factors, and HLE on changes in hyperactivity
levels across KS3 (contextual value-added model) ... 147
TABLE 6.2.1.4: The influence of individual background, family factors, and home learning environment on
changes in anti-social behaviour levels across KS3 (contextual value-added model) ... 148
TABLE 6.2.2: The influence of secondary school quality (Ofsted) on changes in pro-social behaviour levels
across KS3 (Contextual Value-Added Model) ... 149
TABLE 6.2.2.1.a: The inflence of students’ views of school (Emphasis on Learning) on changes in
self-regulation levels across KS3 (Contextual Value-Added Model) ... 151
TABLE 6.2.2.1.b: The influence of students’ views of school (Emphasis on Learning) on changes in pro-social
behaviour levels across KS3 (Contextual Value-Added Model) ... 152
TABLE 6.2.2.1.c: The influence of students’ views of school (Emphasis on Learning) on changes in
hyperactivity levels across KSt3 (Contextual Value-Added Model) ... 153
TABLE 6.2.2.1.d: The influence of students’ views of school (Emphasis on Learning) on changes in anti-social
behaviour levels across KS3 (Contextual Value-Added Model) ... 154
TABLE 6.2.2.2.a: The influence of teacher support on changes in self-regulation across KS3... 155
TABLE 6.2.2.2.b: The influence students’ views of school (Teacher Support) on changes in pro-social
behaviour levels across KS3 (Contextual Value-Added Model) ... 156
TABLE 6.2.2.2.c: The influence of students’ views of school (Teacher Support) on changes in hyperactivity
levels across KS3 (Contextual Value-Added Model) ... 157
TABLE 6.2.2.2.d: The influence of students’ views of school (Teacher Support) on changes in anti-social
behaviour levels across KS3 (Contextual Value-Added Model) ... 158
TABLE 6.2.2.3.a: The influence of students’ views of school (Learning Resources) on changes in
self-regulation levels across KS3 (Contextual Value-Added Model) ... 159
TABLE 6.2.2.3.b: The influence
of students’ views of school (Learning Resources) on changes in pro-social
behaviour levels across KS3 (Contextual Value-Added Model) ... 161
TABLE 6.2.2.3.c: The influence of students’ views of school (Learning Resources) on changes in hyperactivity
across KS3 (Contextual Value-Added Model) ... 162
TABLE 6.2.2.3.d: The influence of students’ views of school (Learning Resources) on changes in anti-social
behaviour across KS3 (Contextual Value-Added Model)... 163
TABLE 6.2.2.4.a: The influence of students’ views of school (Valuing Pupils) on changes in self-regulation
across KS3 (Contextual Value-Added Model) ... 164
TABLE 6.2.2.4.b: The influence of students’ views of school (Valuing Pupils) on changes in pro-social
behaviour across KS3 (Contextual Value-Added Model)... 166
TABLE 6.2.2.4.c: The influence of students’ views of school (Valuing Pupils) on changes in hyperactivity
across KS3 (Contextual Value-Added Model) ... 167
TABLE 6.2.2.4.d: The influence of students’ views of school (Valuing Pupils) on changes in anti-social
behaviour across KS3 (Contextual Value-Added Model)... 168
TABLE 6.2.2.5.a: The influence of students’ views of school (Negative Behavioural Climate) on changes in
self-regulation across KS3 (Contextual Value-Added Model) ... 169
TABLE 6.2.2.5.b: The influence of negative behavioural climate on changes in pro-social behaviour across
KS3 (Contextual Value-Added Model) ... 170
i
Executive Summary
This report provides a detailed analysis of the social-behavioural outcomes and development of
students at the end of Key Stage 3 (KS3) in secondary schools in England. The research is part of
the longitudinal Effective Pre-school Primary and Secondary Education (EPPSE) project. Measures
of students’ social-behavioural outcomes were based on individual teacher assessments conducted
in Year 9. The investigation builds on earlier research that followed this group of students from early
childhood at age 3 years through primary and into secondary school up to age 14. The EPPSE
research has examined
not only students’ social-behavioural development but also their academic
attainments (measured by national Teacher Assessments conducted at the end of KS3) in English,
maths and science and dispositions (measured by factors from student completed questionnaires)
such as academic self concept, enjoyment of school etc. The results in this report on
social-behaviour outcomes complement those reported on academic and affective outcomes for this age
group at the end of Key Stage 3 of secondary education (see Sammons et al., 2011a; 2011b).
The research focuses on four measures of social behaviour derived from exploratory and
confirmatory factor analysis. These include two positive forms of behaviour -
Self regulation
and
Pro-sociability
, and two negative behaviours-
Hyperactivity
and
Anti-social behaviour
. In line with
other research on social behaviour EPPSE found that most students are rated favourably by
teachers in terms of their behaviour in secondary school. Teachers’ ratings are skewed towards the
positive end of the rating scales for most students and only a minority are identified as showing poor
behaviour. For example, only approximately 17% of the sample were rated unfavourably in terms of
high scores for ‘hyperactivity’, and even fewer (no more than 14%) for ‘anti social’ behaviour in Year
9.
The patterns of social behaviour studied now that students are in adolescence can be compared
with earlier findings for this sample at younger ages (in pre-school and primary school). Although
most students are still rated favourably in terms of social-behavioural outcomes at age 14, the
proportions identified as showing negative behaviour has increased compared with previous patterns
found in primary school.
At younger ages the EPPSE research showed that a range of factors related to child and family
characteristics and the home learning environment (HLE) were important predictors of children’s
academic attainment and progress and their social-behavioural development up to the end of
primary school (Sammons et al., 2008a; 2008b). The influence of such factors was detected at a
young age and they continued to predict later educational outcomes.
While the relationships between individual child, family and home learning environment
characteristics and student outcomes tends to be weaker for social-behavioural measures than for
academic attainment, earlier phases of the research has shown that early experiences of
socio-economic disadvantage predict poorer behavioural outcomes in both pre-school and primary school.
The earlier EPPSE results have contributed to current understanding about the relationships
between social behaviour and children’s academic development and the factors that increase the
risk of poor outcomes or that promote resilience. The findings have also informed policy
development in England (or example, see the EPPE research contribution to the Cabinet Office
Equalities Review, 2006, and the family and child case studies, Siraj-Blatchford et al., 2011).
ii
This report identifies which individual student, family and home learning factors continue to predict
EPPSE students’ social behaviour at the end of KS3. The results show many similarities to findings
about which factors were important at younger ages. While many finding on the impact of different
background factors such as gender, family SES or income are similar to other research studies,
EPPSE has additional data on the early years Home Learning Environment, (HLE) and parental
qualifications that allows a deeper exploration of family influences on students across different
phases of education. The findings demonstrate that family factors continue to influence students’
social-behavioural development as well as their academic progress across KS3. It should be noted
that in the analyses of developmental progress in KS3, prior social behaviour measured at the end of
primary education (Y6 KS2) was controlled for in the statistical models.
This report focuses on quantitative analyses of factors that predict social-behavioural outcomes and
developmental progress across KS3. A range of multilevel statistical models were developed to test
which factors predict social-behavioural outcomes. Elsewhere, EPPSE has reported (in keeping with
the mixed qualitative/quantitative methodology) findings from qualitative case studies of individual
children and families that are more educationally successful in overcoming disadvantage and
promote resilience (see Siraj-Blatchford et al., 2011). Such qualitative data helps to provide a
broader understanding of the way disadvantage and other experiences shape children’s educational
outcomes and experiences as they move through different phases of education and into
adolescence, and what factors may help to protect against the adverse consequences of
disadvantage. These case studies show that certain behavioural traits can be important in
supporting better attainment outcomes for vulnerable groups of disadvantaged students, and
indicate that ‘self regulation’ and a positive early years HLE can help to protect students from social
disadvantage and support better educational outcomes in the longer term.
As well as investigating the impact of child, family and HLE background, the EPPSE research has
explored the continued influence of pre-school and primary school as predictors of students’ later
social-behavioural outcomes up to age 14 as well as
measures related to students’ secondary
school experiences. The results provide new evidence on the way different educational settings
(pre-school, primary and secondary) affect these students’ social behaviour and developmental
progress in KS3.
The aims of the research were to:
investigate the variation in students’ social-behavioural outcomes at the end of Key Stage 3;
identify which background characteristics, individual student, family and home learning
environment (HLE) predict social-behavioural outcomes at age 14;
explore the influence of pre, primary and secondary school on social-behavioural outcomes
and developmental progress;
examine the combined impact of pre-school with the HLE as predictors of social-behavioural
outcomes and establish how far any continuing pre-school effects are conditional upon other
educational experiences such as those offered by the HLE;
assess whether the continued impact of pre-school and primary school influences differs for
more and less disadvantaged students;
explore the effects of teaching and school processes on students’ social-behavioural
outcomes using student reported measures of such processes.
In order to maximise the sample size and to limit possible bias linked to missing data, multiple
imputation of missing data was conducted. Careful comparisons of the results from both imputed
and non imputed data sets were made and these indicate that the results are robust producing
patterns that were broadly consistent. The similarities and differences between the original and the
imputed data are highlighted throughout the report. The analyses reported are based on data for a
longitudinal sample of a maximum N= 1,508 EPPSE students attending 444 secondary schools
(original data set) and N= 2,933 students attending 775 secondary schools (imputed)
1.
11
iii
Summary of Main Findings
Variations in social-behavioural outcomes in Year 9 for different student groups
EPPSE investigated the influence of a wide range of demographic and socio-economic measures
from parental interviews and questionnaires as predictors of student behaviour at age 14. These
include individual characteristics, such gender, age, ethnicity, early childhood behavioural history,
and family factors, including family size (number of siblings), parents’ marital status, earned income,
family highest socio-economic status (SES), as well as the highest level of parents’ qualifications.
EPPSE also investigated factors specific to the educational system in England, such as receipt of
English as an Additional Language (EAL) support, Special Education Needs (SEN) status, and Free
School Meals (FSM) eligibility. The following summarises the key findings.
Girls show better social-behavioural profiles than boys at age 14 in all four outcomes (e.g., ES=0.45
for
‘self-regulation’ and ES=-0.42 for ‘anti-social’). Family SES, income and parents’ highest
qualification levels are also strong predictors. For example, the Effect Size (ES) for mothers having
a degree or equivalent was ES=0.47 for ‘self-regulation’ and ES-0.40 for ‘hyperactivity’. By contrast,
there are weaker effects linked to parents’ marital status, although there is a tendency for increased
‘hyperactivity’ and ‘anti-social’ behaviour for those from single parent families (ES=0.20 for
‘hyperactivity’ for single parents versus married parents).
The early years and KS2 home learning environment (HLE) continues
to predict students’
social-behavioural outcomes up to age 14, taking into account other influences. Those students who had
experienced a more positive HLE in the early years and later on in primary school were rated more
favourably by teachers in terms of various social-behavioural outcomes in Year 9 (ES=0.48 for the
high versus low HLE groups).
Students with a record of Special Educational Needs (SEN) in secondary school show significantly
poorer behavioural outcomes, the two possibly being reciprocal relationships. The strength of
relationships is in line with the SEN research literature and findings for this group at younger ages
(Anders et al., 2010; Taggart et al., 2006; Sammons et al., 2003; Sammons et al., 2004).
EPPSE developed an index of multiple disadvantage that provides a summary measure of overall
disadvantage experienced by children in the EPPSE sample during the early years. This continues
to be a strong predictor of differences in these students’ later social behaviour up to age 14. Those
who had experienced several disadvantages in the early years show poorer
‘self-regulation’ and
‘pro-social’ behaviour and increased scores for ‘hyperactivity’ and ‘anti-social’ behaviour in KS3.
iv
TABLE 1: Summary of background influences on social-behavioural outcomes
Factors
Self-regulation
Pro-social
Hyperactivity
Anti-social
Student factors
Gender (boys)
0.45
0.61
-0.54
-0.42
Age (continuous)
0.12
0.08
-0.08
ns
Birth weight (normal)
Foetal infant/very low weight
ns
ns
ns
ns
Low birth weight
ns
ns
ns
ns
Number of siblings (none)
1 sibling
0.13
0.11
-0.15
-0.12
2 siblings
ns
ns
ns
ns
3 siblings
ns
ns
ns
ns
Ethnicity (White UK heritage)
White European heritage
ns
ns
ns
ns
Black Caribbean heritage
ns
ns
ns
ns
Black African heritage
ns
ns
ns
ns
Any other ethnic minority
ns
ns
ns
ns
Indian heritage
0.33
ns
-0.33
ns
Pakistani heritage
ns
ns
ns
ns
Bangladeshi heritage
0.37
ns
-0.48
-0.34
Mixed race
ns
ns
ns
ns
Early behavioural problems (none)
1 Behavioural Problem
-0.30
-0.28
0.36
0.32
2+ Behavioural Problems
-0.34
ns
0.44
0.33
Family factors
Parents’ Highest SES at KS2 (unemployed/not working)
Unskilled
ns
ns
ns
ns
Semi-skilled
ns
ns
0.17
ns
Skilled, Manual
ns
ns
ns
ns
Skilled, Non-Manual
0.30
0.20
-0.20
-0.20
Other Professional, Non-Manual
0.31
0.23
-0.24
-0.19
Professional, Non-Manual
0.45
0.31
-0.28
-0.25
Mother’s Highest Qualification Level (none)
Other Professional/Misc.
ns
ns
ns
ns
Vocational
ns
ns
ns
ns
16 academic
0.17
0.15
-0.15
-0.13
18 academic
0.31
0.22
-0.25
-0.21
Degree or equivalent
0.47
0.36
-0.40
-0.37
Higher degree
0.54
0.35
-0.43
-0.36
Marital Status of Parent/Guardian/Carer (married)
Single
-0.13
ns
0.21
0.15
Separated/Divorced
ns
ns
0.21
0.18
Living with partner
-0.18
-0.13
0.21
0.14
Widow/Widower
ns
ns
ns
ns
Home Learning Environment
Early Years Home Learning Environment (HLE) Index (Grouped) (Very low)
Low (Index values: 14-19)
0.15
0.13
ns
ns
Average (Index values: 20-24)
0.17
ns
ns
ns
High (Index values: 25-32)
0.32
0.27
-0.25
ns
Very high (Index values: 33-45)
0.48
0.30
-0.35
ns
v
Neighbourhood influences
Various measures of neighbourhood disadvantage were also tested to see if they predicted students’
social-behavioural outcomes at age 14, while controlling for the effects of individual, family and HLE
measures discussed above. There was evidence that the level of overall disadvantage in the
neighbourhood, measured by two national measures, the Index of Multiple Deprivation (Noble et al.,
2004) and the Income Deprivation Affecting Children Index (IDACI) scores, as well as other area
based measures such as lower participation in employment, the incidence of crime, and the
incidence of limiting long-term illness in the population, all predicted poorer social-behavioural
outcomes for the EPPSE sample in KS3.
Living in a neighbourhood with higher levels of deprivation among children aged under 16 on the
IDACI predicted poorer
‘self-regulation’, and higher levels of ‘hyperactivity’ and ‘anti-social’
behaviour. Higher neighbourhood scores for the IMD predicted increased
‘hyperactivity’. Higher
levels of criminality in neighbourhoods predicted poorer outcomes in all four social-behavioural
domains (e.g., ES=0.14 for
‘hyperactivity’). Higher levels of unemployment in the area likewise
predicted higher ‘hyperactivity’ among Year 9 EPPSE students. Finally, a higher incidence of limiting
long-term illness in the neighbourhood predicted lower ‘self-regulation’ at the end of Key Stage 3. All
these relationships had effect sizes in the range of 0.08 to 0.14 (for imputed data) after controlling for
the influence of individual, family and HLE factors discussed above.
Educational experiences from pre-school to secondary school
EPPSE investigated the impact of educational environments from the pre-school to primary school in
shaping students’ social-behavioural outcomes at age 14.
Pre-school influences
In order to assess whether the impact of early educational settings on social behaviour continued
throughout Key Stage 3, we tested measures related to school: exposure (i.e., attended
pre-school or not), duration, quality and pre-pre-school effectiveness.
The results indicate that attending just any pre-school centre did not predict social-behavioural
outcomes in Year 9. Further, the influence of pre-school effectiveness measures was no longer
visible at age 14, in contrast to findings when the EPPSE sample were in primary school. However,
the quality of the pre-school setting as measured by the Early Childhood Environment (ECERS)
observational scales continued to be significant for all four social-behavioural outcomes at the end of
Key Stage 3, both unconditionally and when tested in combination with the quality of early years
HLE.
Overall, students who had attended higher quality pre-schools still showed significantly better
social-behavioural outcomes at age 14 than the home group or than those who had experienced only low
quality pre-school. These relatively small effects were consistent in predicting better outcomes, for
‘self-regulation’ (ES=0.14 high quality versus home group), ‘pro-social’ (ES=0.14), ‘hyperactivity’
(ES= -0.13) and ‘anti-social’ (ES= -0.14) behaviour.
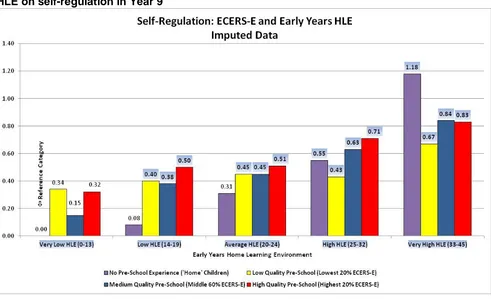
The results suggest that the effects of pre-school may be partly dependant on other experiences
such as the quality of the early years HLE. Having attended a medium or higher quality pre-school
showed lasting benefits for students from most HLE groups. For those who had attended a low
quality pre-school who were also from a low or average HLE group, there were significant positive
benefits for ‘self-regulation’ and ‘pro-social’ behaviour (ES=0.50 for ‘self-regulation’).
For hyperactivity only high quality pre-school offered benefits for students from a low early years
HLE group (ES= -0.40). For those who had a high early years HLE, however, low quality pre-school
did not seem to offer extra benefits in terms of predicting better social-behavioural outcomes in Year
9. This pattern fits with predictions made of interactions between home and out-of-home pre-school
experiences by Melhuish (1991) and findings of interactions when the EPPSE students were in
primary education during Key Stage 2 (Sammons et al., 2008a; 2008b).
vi
conclude that pre-school experience on its own, while of benefit, should not be regarded as a magic
bullet to overcome the long lasting effects of disadvantage, but may provide help to ameliorate its
impact, particularly if of high quality.
Primary school influence
There were no statistically significant effects of the academic effectiveness of the primary school an
EPPSE student had attended in terms of predicting better later social-behavioural outcomes at the
end of KS3. This is in contrast to findings for academic attainment where we have identified longer
term positive benefits from attending a more academically effective primary school that remain
statistically significant in predicting academic results in Year 9 (Sammons et al. 2011a).
Secondary school influences
Secondary school academic effectiveness and school quality measured by Ofsted inspection
Two administrative indicators of school effectiveness and quality are provided by i) the DfE
Contextual Value Added (CVA) measures calculated to measure secondary school effectiveness in
promoting students’ academic progress from KS2 to KS4 and ii) the Office for Standards in
Education (Ofsted) inspection grades for schools.
EPPSE tested whether students who attended more effective or higher quality secondary schools
(as defined by these indicators) in KS3 showed better social-behavioural outcomes.
The four year average CVA score for secondary schools did not predict differences in students’
social-behavioural outcomes in KS3 either positively or negatively, when account was taken of the
influence of individual student, family, HLE and neighbourhood factors. However, the overall Ofsted
inspection judgments of the secondary school for their measure of ‘behaviour of learners’ did predict
better social-behavioural outcomes for EPPSE students. The differences were primarily
distinguished between a satisfactory, good or outstanding secondary school and an inadequate one.
Students who had the misfortune to attend a secondary school that had been judged inadequate on
at least one occasion in the four years studied, by contrast, showed significantly poorer social
behaviour, taking into account the influence of other factors (e.g., ES ranged between 0.56 and 0.63
for attending a satisfactory, good or outstanding school versus an inadequate one for
‘self-regulation’).
As well as identifying a net effect after controlling for other influences, interaction effects were also
studied.
These showed that attending an ‘outstanding’ or a ‘good’ school offered the greatest
benefits in promoting better social behaviour outcomes to students with lower scores on the multiple
disadvantage index, those from non manual family SES groups and those whose mothers had
higher qualification levels. At secondary level therefore, attending a better secondary school seems
to have relatively more benefit for those students who are from relatively more advantaged
backgrounds compared to those who are relatively more disadvantaged. This is in contrast to
findings at younger ages which indicated that the disadvantaged children benefited more from
attending higher quality pre-schools and more academically effective primary schools.
School level social composition
School level social composition was measured by the percentage of students’ eligible for Free
School Meals (FSM) and the percentage of students with SEN. Neither of these aggregate
measures were significant predictors of social-behavioural outcomes at KS3. These findings are in
contrast to the results for academic outcomes in Year 9 where attending a secondary school with a
more disadvantaged intake had a weak but negative impact on EPPSE students’ own attainment
levels.
Students’ experiences and views of secondary school
Homework
vii
other research which has pointed to the reciprocal links between behavioural patterns including effort
and motivation that predict attainment. Of course it must be recognised that spending time on
homework is a form of self-regulated behaviour in itself, and can be seen to demonstrate higher
levels of motivation and commitment to school work, and also possible family support and
encouragement to take study seriously. Also it is likely that a teacher may be positively influenced
by whether a student completes homework when assessing their behaviour and their attainment.
In interpreting this finding it should also be remembered that some schools lay more emphasis on
setting and marking homework and thus school processes may also be at work in shaping students’
attitudes to and engagement in homework.
Taken together with the positive findings on these students’ English, maths and science attainment
and their academic progress across KS3 (where significantly better outcomes were predicted by
spending more time on homework) the results for social behaviour also point to the benefits of
encouraging students to spend time on completing homework. It is likely to foster better study skills
and motivation, encourage independent learning and, through the extra time spent on study,
increase the opportunity to learn in KS3. Other research reviews on the impact of homework have
pointed to its benefits for academic outcomes at secondary level but have rarely explored the
relationships with social behaviour (but see Ramdass & Zimmerman, 2011).
Teaching and school processes in KS3
Students’ views about their secondary school education in KS3 were obtained from self report
questionnaires. Various measures were derived that related to features of their school experiences
(Sammons et al., 2011 b).
Where students reported that their schools laid a greater ‘emphasis on learning’, this predicted better
‘self-regulation’ (ES=0.17 for imputed data) and to a lesser extent ‘pro-social’ behaviour (ES=0.16 for
imputed data) and reduced negative behaviour also (ES=-0.20 ‘hyperactivity’, ES=-0.16 ‘anti-social’
on imputed data). Elsewhere, we have shown that this ‘emphasis on learning’ factor (a measure of
the quality of teaching derived from the student’s perspective) also predicted better educational
attainment in KS3, after taking into account other background influences.
‘Teacher support’ (where students reported teachers supporting their learning) also
predicted better
social behaviours (e.g., ES=0.17
‘self-regulation’, ES=-0.20 ‘hyperactivity’). This factor measures
teacher behaviours such as providing helpful comments on students’ work, use of praise, formative
feedback and making lesson aims clear. It is therefore another measure that relates to the quality of
teaching experienced by students.
A ‘negative behavioural climate’ in the secondary school, as reported by students, also predicted
poorer social-behavioural outcomes at age 14. It predicted poorer outcomes in
‘self-regulation’
(ES=-0.32) and ‘pro-social’ behaviour (ES=-0.26) and increased scores for ‘hyperactivity’ (ES=-0.31)
and ‘anti-social behaviour’ (ES=0.25).
Similarly, the factor ‘valuing pupils’
was found to predict better outcomes for all four
social-behavioural measures. This factor captures aspects of the emotional climate of the school, such as
relationships with teachers in terms of friendliness and the extent to which students feel valued and
involved.
The headteacher’s leadership qualities were also important as these predicted better
social-behavioural scores for the all four outcomes (ES=0.09 to ES=0.13 for imputed data). Again these
findings of weak to modest positive effects are in line with those found in analysing academic
outcomes in KS3. The effects were not strong and other literature suggests that ‘headteacher
leadership’ tend to operate indirectly to benefit student outcomes through improving the school
behavioural climate, school organisation and teaching quality that may be hypothesised to have a
direct impact on student outcomes (see Day et al., 2009; Leithwood et al., 2006; Robinson, 2008;
Sammons et al., 2011c).
‘pro-viii
social’ (ES=0.10) and reduced ‘anti-social’ behaviour (ES=-0.07), controlling for the influence of
other background influences. Similarly ‘school learning resources’, as rated by students, predicts
better outcomes for all four social-behavioural measures (ES=0.12 to ES=0.15 for imputed data).
Again though weak these results show that, taking account of other influences, student behaviour
tends to be better in secondary schools that are more favourably resourced in terms of science
laboratories, the library and the computer resources.
Student dispositions
Previous research has shown that there are reciprocal relationships between academic
self-concepts and attainment (Marsh & Craven, 2006). Higher self-concept predicts better attainment
and vice versa. Earlier patterns of attainment and self concept can shape students’ future identities
as learners. EPPSE has shown (Sammons et al., 2011a) strong links between
‘academic
self-concept in maths’ as a predictor of maths attainment in Year 9, although ‘academic self-self-concept in
English’ was a less strong predictor of Year 9 English attainment. We tested whether these
measures that we term students’ ‘dispositions’ also predict differences in their social-behavioural
outcomes as rated by teachers in Year 9.
The results indicate stronger positive effects for ‘academic self-concept’ in maths as a predictor of
‘self-regulation’ and ‘pro-social’ behaviour than for ‘academic self-concept in English’. In addition,
higher scores on these two measures of
‘academic self-concept’ predicted reductions in negative
behaviour for both ‘hyperactivity’ and ‘anti-social’ behaviour. Due to the likely reciprocal nature of
relationships between academic self-concept, attainment and behaviour it is not possible to infer
causal connections. Nonetheless, the results suggest that efforts to improve attainment and
academic self concept of students in secondary schools are also likely to promote better
social-behavioural outcomes and vice versa.
ix
Developmental progress across KS3
Individual and family factors
A significant gender gap was identified, with girls showing more progress in the positive
social-behavioural outcomes (ES=0.34
‘pro-social’, ES=0.20 ‘self-regulation’), and also greater reductions
in the negative outcomes (ES=-0.17 to 0.34 imputed data). The occurrence of behavioural problems
in early childhood was also a significant predictor of students’ ability to make developmental
progress in all four investigated social-behavioural domains across KS3 (ES=-0.18 to ES=0.27).
Conversely, the relative age position within their cohort (e.g. Autumn born and therefore older) did
not predict social-behavioural changes for students during KS3.
A moderate equity gap associated with family socio-economic status was found for changes in
‘self-regulation’ (ES=0.28), and ‘pro-social’ (ES=0.22) and ‘anti-social’ behaviour (ES=0.27) placing
students of parents in professional non-manual occupations in a clearly advantaged position. The
gaps were smaller for ‘hyperactivity’ (ES=-010) and ‘anti-social’ behaviour (ES=-011).
A consistent pattern of differences in developmental progress, related to the level of mother’s
educational qualifications, emerged for ‘self-regulation’(ES=0.31 for higher degree), ‘pro-social’ and
‘anti-social’ behaviour, with students of mothers holding a degree or equivalent, or a higher degree,
showing significantly greater improvements in the two positive social-behavioural outcomes, and
significant reductions in
‘anti-social’ behaviour (ES=-0.28 for higher degree), compared to students
of mothers with no qualifications.
The marital status of parents was not significantly associated with improvements in
‘self-regulation’
or
‘pro-social’ behaviour. However it did predict increases in ‘hyperactivity’ (ES=0.15) and
‘anti-social’ behaviour (ES=0.13). Students in lone parent families showed small but statistically
significant increases in both negative behaviours, and students of divorced or separated parents
were found to show increased scores for
‘anti-social’ behaviour between Year 6 and Year 9,
controlling for other influences.
Home Learning Environment (HLE)
The quality of the early years HLE was found to predict better developmental progress across KS3.
A high or very high quality of the early years HLE was significantly associated with improvements in
‘self-regulation’ (ES=0.32) and ‘pro-social’ behaviours (ES=0.22) from Year 6 to Year 9, with
significant reductions in ‘hyperactivity’ (ES=-0.20). However, the quality of the early years HLE did
not predict any significant reductions in ‘anti-social’ behaviour during KS3.
Secondary school influences
Several major features of teaching and school processes in secondary schools were found to
influence
students’ social-behavioural developmental progress across KS3. One first important
feature was the
‘emphasis on learning’, a factor related to those teaching strategies designed to
promote critical reasoning and the activation of higher-order cognitive processes. The second was
the amount of ‘teacher support’ given. This included clearly defined learning targets, expectations
and constructive feedback. A third feature was the extent to which the secondary schools provided
good
‘learning resources’, such as well-equipped computing laboratories, and well-resourced
libraries. A fourth, concerned the culture of valuing students, typified by the extent to which teachers
and the school management accept feedback and input from students, offer them friendly and
respectful treatment, and are not felt to put too much stress on GCSE examination results.
All of these factors predicted significant improvements in
‘self-regulation’ and ‘pro-social’ behaviour
and also significant reductions in ‘hyperactivity’ and ‘anti-social’ behaviour across KS3, after allowing
for socio-economic and demographic influences, and the quality of early years HLE.
x
Overall, these results show that a number of features of secondary school processes predict
variation in students’ social-behavioural development across KS3. Individual student, family and
HLE
factors play a role in shaping changes in students’ social behaviour, with a tendency for the
equity gap in behavioural outcomes to widen for some groups of students during early adolescence.
In addition, features of the secondary school environment relating to
the ‘emphasis on learning’,
‘teacher support’, the ‘learning resources’ and ‘behaviour climate’ also predict changes in EPPSE
students’ social behaviour. How students’ experience their secondary schools predicts both
social-behavioural outcomes and development and, as we report elsewhere, also their academic
attainment and progress from Year 6 to year 9.
Conclusions
Overall, the analyses provide clear evidence concerning the factors that predict better
social-behavioural outcomes for students at the end of KS3 and the factors that predict developmental
change in adolescence measured from Year 6 to Year 9.
It is apparent that the influence of various individual, family and HLE factors continue to shape
students’ social behaviour in secondary school. An equity gap can be identified in terms of factors
that promote learning and academic attainment as well as better social adjustment. The experience
of multiple disadvantage in the early years increases the risk of poorer social-behavioural
development up to age 14 years, as well as predicting poorer attainment. The two are likely to be
mutually reinforcing. By contrast positive parenting experiences especially in the early years helps
to promote better longer term outcomes. There remains evidence that pre-school experiences
continue to shape social-behavioural outcomes into secondary school, although only the measure of
pre-school quality shows a statistically significant relationship at age 14.
The measure of primary school academic effectiveness predicted better attainment in Year 9 but not
better (or worse) social behaviour. Similar results are found for the academic effectiveness of the
secondary school. However, a poor quality secondary school as measured by Ofsted judgments
predicts poorer behavioural outcomes for those unfortunate enough to attend a school rated as
inadequate, even controlling for the influence of individual, family and HLE factors.
1
INTRODUCTION
Background: The EPPSE 3-14 Project
The Effective Pre-school, Primary and Secondary Education 3-14 (EPPSE 3-14) project is a
largescale longitudinal study exploring the effects of educational provision at various phases, from pre
-school to the end of Key Stage 3 (KS3, age 14), across a nationally representative sample of
approximately 3,000 children (see Sylva et al., 1999). This study was commissioned in 1997 and
funded by the Department for Education and Skills (now the Department for Education).
The original Effective Provision of Pre-school Education (EPPE 1997 - 2004) project was the first
study of pre-schools in Europe to adopt a longitudinal, mixed-methods, educational effectiveness
design, based on sampling children in a range of pre-school settings and using statistical
approaches that enable the identification of individual pre-school centre and later school effects
(Sammons et al., 2005, 2010). The original aim of the project was to investigate which types of early
childhood provision were most effective in promoting children’s academic attainment and
social-behavioural development at entry to primary school (age 5), and to what extent these effects
persisted to the end of Key Stage 1 (age 7 plus years). During this initial phase, information was
collected from 2,857 children aged 3 plus attending 141 pre-school centres selected from five
regions across England, drawn from a representative range of types of pre-school providers,
including local authority day nurseries, integrated centres (which combine education and care),
playgroups, private day nurseries, nursery schools, and nursery classes (see Sammons et al.,
2002a; 2003, Sylva et al., 2010). A further ‘home’ sample, consisting of 315 children with minimal or
no pre-school exposure, was added at entry to primary school bringing the total sample to 3,172
children.
An extension of the original EPPE study (EPPE 3-11, 2008 - 2011) followed the sample to the end of
Key Stage 2 (Sammons et al., 2007a; 2007b; 2008a; 2008b; Sylva et al., 2010). During this second
phase of the longitudinal research, children’s academic and social-behavioural development was
investigated across Key Stage 2 of primary education (age 7 to 11 years). It explored the impact of
a wide variety of child, parent, and family factors, including the early years home learning
environment (HLE), as well as measures of primary school academic effectiveness, on
pupils’
academic and social-behavioural outcomes during this phase of education.
2
Aims
EPPSE 3-14 has investigated the influence of demographic, socio-economic, individual background
and educational influences from pre-school to primary and secondary school on adolescent’s
social-behavioural outcomes at the end of KS3 (Year 9). In addition EPPSE has explored the effects, on
social-behavioural
outcomes, of students’ self-reported experiences in secondary education and
outside school, their academic self-concepts and emotional dispositions. The EPPSE 3-14 study
also investigated the influences on developmental progress across KS3.
The study collected information on students’ background circumstances in Year 9; indicators of the
effectiveness and quality of their secondary school; assessments of their behaviour from teachers;
students’ reports of their own educational and personal experiences, as well as national indicators
and census statistics regarding their neighbourhood.
The specific research aims were to:
investigate
students’ social-behavioural outcomes at the end of KS3 based on analyses of
teacher completed rating scales;
identify which background characteristics, individual, family and HLE factors predicts
social-behavioural outcomes;
explore the influence pre, primary and secondary school, particularly in terms of quality and
effectiveness on later social-behavioural outcomes and developmental progress;
examine the combined influence of pre-school characteristics with the HLE as predictors of
social-behavioural outcomes at age 14 to establish to what extent any continuing pre-school
effects are dependent upon other experiences such as the HLE;
assess whether the continued impact of pre, and primary school influences on social
behaviour differs for more and less disadvantaged students;
explore the effects of teaching and
school processes measured by students’ report of their
secondary school and classroom and their dispositions on social-behavioural outcomes in
Year 9.
Analytical strategy and structure of the report
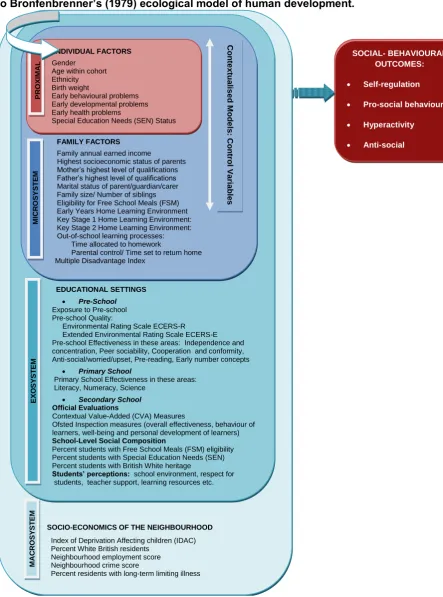
The theoretical framework of the study originates in the pioneering work of Bronfenbrenner (1979),
who devised an ecological model of human development. This framework is consistent with the one
used in our qualitative studies (see Siraj-Blatchford et al., 2011). EPPSE uses an adapted version of
this model (summarized in Figure 1) to explore the impact of various spheres of influence on the
social-behavioural development of young adults, from proximal factors which can be traced back to
early childhood, to more distal, family-related factors, an exosystem consisting of educational
influences, and a mesosystem of ecological correlates stemming from the residential neighbourhood.
3
FIGURE 1: Summary of the analyses strategy: Different groups of predictors tested in relation
to Bronfenbrenner’s (1979) ecological model of human development.
Source
: Authors’ adaptation of the ecological model of human development, based on Bronfenbrenner (1979);
Bronfenbrenner & Morris (1998); Siraj-Blatchford et al. (2011).
SOCIO-ECONOMICS OF THE NEIGHBOURHOOD
Index of Deprivation Affecting children (IDAC) Percent White British residents
Neighbourhood employment score Neighbourhood crime score
Percent residents with long-term limiting illness
EDUCATIONAL SETTINGS
Pre-School
Exposure to Pre-school Pre-school Quality:
Environmental Rating Scale ECERS-R Extended Environmental Rating Scale ECERS-E Pre-school Effectiveness in these areas: Independence and concentration, Peer sociability, Cooperation and conformity, Anti-social/worried/upset, Pre-reading, Early number concepts
Primary School
Primary School Effectiveness in these areas: Literacy, Numeracy, Science
Secondary School
Official Evaluations
Contextual Value-Added (CVA) Measures
Ofsted Inspection measures (overall effectiveness, behaviour of learners, well-being and personal development of learners) School-Level Social Composition
Percent students with Free School Meals (FSM) eligibility Percent students with Special Education Needs (SEN) Percent students with British White heritage
Students’ perceptions: school environment, respect for students, teacher support, learning resources etc.
FAMILY FACTORS
Family annual earned income
Highest socioeconomic status of parents Mother’s highest level of qualifications Father’s highest level of qualifications Marital status of parent/guardian/carer Family size/ Number of siblings Eligibility for Free School Meals (FSM) Early Years Home Learning Environment Key Stage 1 Home Learning Environment: Key Stage 2 Home Learning Environment: Out-of-school learning processes:
Time allocated to homework
Parental control/ Time set to return home Multiple Disadvantage Index
INDIVIDUAL FACTORS
Gender Age within cohort Ethnicity Birth weight
Early behavioural problems Early developmental problems Early health problems
Special Education Needs (SEN) Status
SOCIAL- BEHAVIOURAL OUTCOMES:
Self-regulation
Pro-social behaviour
Hyperactivity
Anti-social
Anti-Social Behaviour
4
This report is divided into seven sections.
Section 1
provides a descriptive analysis of the characteristics of the EPPSE sample in Year 9.
Section 2
explains the identification of the social-behavioural factors and their theoretical
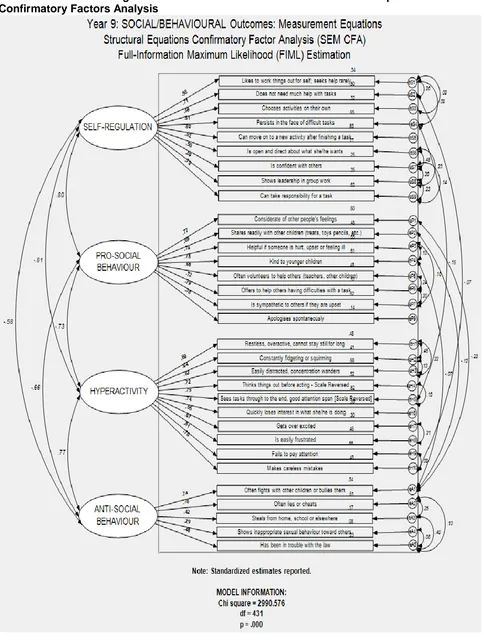

![TABLE 3.1.1.1: Contexualised Model 1: Self-regulation SELF-REGULATION [SEM CFA Derived Latent Construct, IQ Standardized]: Child and Family Factors Model 1](https://thumb-us.123doks.com/thumbv2/123dok_us/167469.44613/41.595.57.567.71.767/contexualised-regulation-regulation-derived-construct-standardized-family-factors.webp)
![TABLE 3.1.4.1: Contexualised Model 1: Anti-social behaviour ANTI-SOCIAL BEHAVIOUR [SEM CFA Derived Latent Construct, IQ Standardized]: Child and Family Factors Model 1](https://thumb-us.123doks.com/thumbv2/123dok_us/167469.44613/55.595.55.559.76.765/contexualised-behaviour-behaviour-derived-latent-construct-standardized-factors.webp)
![TABLE 3.3.1.3 The influence of the incidence of limiting long-term illness on self-regulation SELF-REGULATION [SEM CFA Derived Latent Construct, IQ Standardized]: Neighbourhood Limiting Long-Term Illness](https://thumb-us.123doks.com/thumbv2/123dok_us/167469.44613/79.595.58.561.137.704/influence-incidence-regulation-regulation-construct-standardized-neighbourhood-limiting.webp)
![TABLE 3.3.4.1: The influence of neighbourhood IDACI on anti-social behaviour ANTI-SOCIAL BEHAVIOUR [SEM CFA Derived Latent Construct, IQ Standardized]: Neighbourhood IDAC](https://thumb-us.123doks.com/thumbv2/123dok_us/167469.44613/85.595.58.561.137.722/influence-neighbourhood-behaviour-behaviour-derived-construct-standardized-neighbourhood.webp)
![TABLE 4.1.1.1: Contextualised Model: Influence of pre-school quality (ECERS-R) on self-regulation in Year 9 SELF-REGULATION [SEM CFA Derived Latent Construct, IQ Standardized]: ECERS-R Categorical](https://thumb-us.123doks.com/thumbv2/123dok_us/167469.44613/89.595.55.561.72.731/contextualised-influence-regulation-regulation-derived-construct-standardized-categorical.webp)