Wambiana Grazing Trial:
Water Quality Update to
Burdekin Dry Tropics NRM
December 2008
Prepared by Peter O’Reagain
1, Zoe Bainbridge
2and Jon Brodie
21Department of Primary Industries and Fisheries, PO Box 976, Charters Towers, Qld 4820 2Australian Centre for Tropical Freshwater Research, James Cook University, Qld 4811
Table of Contents
1. Introduction... 1
2. Methods... 2
2.1. Trial site description ... 2
2.2. Soil loss and runoff ... 3
3. Results... 5
3.1. Rainfall... 5
3.2. Pasture composition... 5
3.3. Runoff and soil loss ... 7
3.4. Economic performance ... 13
4. Discussion and Conclusions ... 14
1. Introduction
Aside from the obvious issues of animal production, pasture condition and economic performance, a key issue in savanna management is that of soil loss and runoff. Increased sediment and nutrient inputs from grazing lands have been identified as major threats to the Great Barrier Reef (GBR) lagoon and water quality is obviously of major relevance to the grazing industry. However, an aspect usually given lesser prominence is that excessive loss of runoff and nutrients will inevitably compromise long term pasture and animal production.
Previous studies conducted on grano-diorite and sedimentary landscapes in the Burdekin catchment showed that runoff and sediment loss increased sharply as cover declined (McIvor et al., 1995; Scanlan et al., 1996). However, neither study addressed the issue of nutrient loss from these systems. Furthermore, both studies were conducted on relatively small plots: under these conditions much of the sediment moved is likely to be re-deposited before entering water ways, making it difficult to extrapolate sediment losses to larger catchment scales.
Major knowledge gaps thus exist concerning the relationship between management and runoff in extensive grazing lands. These are firstly, how runoff and water quality are affected by grazing management on the relatively flat, infertile, tertiary sediments, which make up c. 20% of the Burdekin catchment. Secondly, how grazing management affects water quality. And thirdly, the extent (if any) of the trade-off between reduced soil loss and economic productivity in grazing management.
To test the effects of grazing management on soil and nutrient loss, five 1 ha mini-catchments were established in December 1997 under different grazing strategies on a sedimentary landscape near Charters Towers. The objectives of the trial are to:
1. Assess the relative ability of different grazing strategies to cope with rainfall variability in terms of their effects on animal production, economics and resource condition.
2. Develop new and practical sustainable management strategies based on seasonal climate forecasting to cope with present and future rainfall variability, and
2. Methods
2.1. Trial site description
The trial is located on Wambiana, 70 km SW of Charters Towers (20° 34’ S, 146° 07’ E), north Queensland. Long term (90 year) mean annual precipitation for the nearest Bureau of Meteorology rainfall station at Trafalgar, 17 km NW of the trial is 652 mm (C.V. = 40%). Rainfall is generally highly seasonal with most (70 %) falling between December and March and a long dry season occurring in intervening months (Clewett et al., 2003). Soils are derived from tertiary sediments and are relatively infertile (De Corte et al., 1996) and include kandosols, sodosols, chromosols and vertosols (Isbell 1996). The trial was sited on these tertiary sediments because of the prevalence of similar, low fertility land types in northern Australia. The study area is located in the Aristida-Bothriochloa
pasture community (Tothill and Gillies 1992) and is an open savanna dominated by
Eucalypt, and to a lesser extent, Acacia, woodland species, overlying C4 tropical grasses.
Paddocks were laid out to ensure that experimental paddocks contained similar percentages (%) of the 3 main soil–vegetation associations (Fig. 1). These associations and their % of total paddock area are firstly, a Eucalyptus melanophloia community on yellow/red kandosols (23%). These relatively well drained, low fertility soils are dominated by unpalatable grasses like Eriachne mucronata and Aristida spp. but may also contain appreciable quantities of Chrysopogon fallax and Heteropogon contortus.
Secondly, an Acacia harpophylla – Eucalyptus brownii community on grey vertosols (22 %). These more fertile areas are largely dominated by Dicanthium sericeum,
Bothriochloa ewartiana and Eulalia aurea. Thirdly, a E. brownii community on brown
sodosols and chromosols (55%). These soils are relatively shallow (30-40 cm), of moderate fertility and are commonly dominated by a Chrysopogon fallax - Bothriochloa
ewartiana pasture layer.
Experimental paddocks are c. 100 ha in size, with the stocking strategies being tested as follows: (i) constant light stocking (LSR), stocked at the long term carrying capacity (LTCC) of 8 ha/animal equivalent (AE= 450 kg steer) to achieve the recommended ‘safe’ average pasture utilisation rate of 20-25 %; (ii) constant heavy stocking (HSR): run at twice LTCC (4 ha/AE) to achieve an average of 40-50 % utilisation of pasture; (iii)
variable stocking (VAR) - stock numbers adjusted annually in May at the end of the wet
season (range: 3-10 ha/AE) according to available pasture; (iv) a Southern Oscillation
Index (SOI)-Variable (SOI) strategy – stock number adjusted annually in October based
on the SOI and available pasture; and (v) Rotational wet season spelling (R/Spell), with one third of the paddock spelled annually.
and Eriachne spp.), annual grasses and ‘other’. 3-P tussock densities are derived from tussock counts in 0.25 m2 quadrats measured in May 2007. Pasture utilisation rates were calculated retrospectively using the GRASP model (McKeon et al., 1990) calibrated for the site.
Figure 1. Wambiana grazing trial paddock layout and other features.
2.2. Soil loss and runoff
Runoff and soil loss are measured in a 1 ha bounded catchment using San-Dimas flumes (O’Reagain et al. 2005). Runoff was collected at the bottom of catchments by wing-walls which funnel runoff towards a sediment trap (1 x 1 x 0.2m) and San-Dimas flume (2.5 x 0.5 x 0.5m). Flow height and duration through the flume were recorded at one-minute intervals using Macquarie borehole loggers (Windstream technologies, Mona Vale, NSW, Australia), allowing quantification of runoff rates and volumes. Rainfall quantities and intensities were recorded at one minute intervals using tipping-bucket pluviometers.
3. Results
3.1. Rainfall
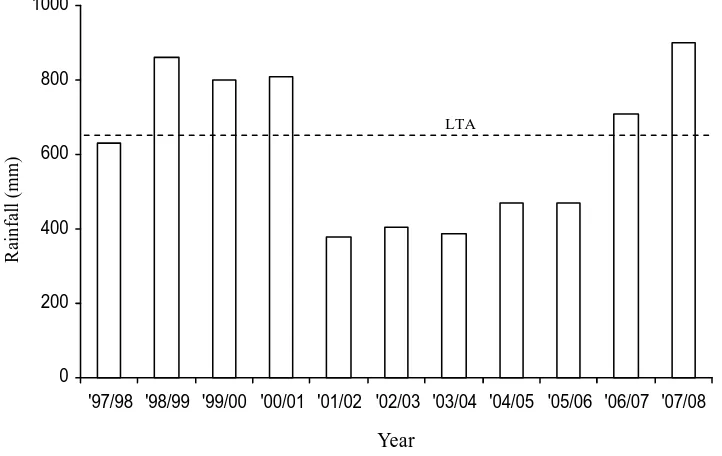
[image:7.612.105.466.358.586.2]Rainfall was initially above average but declined sharply in later years with the period from 2001 to 2006 being within or close to the lowest 20 % of rainfall years (Fig. 2). Pasture TSDM consequently changed profoundly from a high of c. 4500 – 5000 kg/ha in 1999 to average only 500 kg/ha in 2007. Differences in TSDM between grazing strategies were most pronounced in later years, with the HSR being virtually devoid of forage in the dry season of some years. Stocking rates in the VAR were set very high in the early wetter years (c. 4 ha/AE) but were halved in 2002 due to poor yields, and then progressively reduced as available pasture declined. In the HSR, drought feeding was needed in 3 consecutive dry-seasons to sustain animals, but stocking rates were eventually cut by 30 % in May 2005 due to continued forage shortages (TSDM < 400 kg/ha). Pasture utilisation rates were thus initially low (< 20 %) but increased sharply in 2002 as rainfall declined, particularly in the VAR (64 %) which was very heavily stocked due to previous good seasons. As stocking rates were subsequently reduced in the VAR, utilisation rates dropped sharply to slightly below that in the LSR. Pasture utilisation rates in the HSR in contrast, remained high due to continued heavy stocking (O’Reagain et al., 2008).
Figure 2. Annual rainfall (1st July - 30 June) between 1997 and 2007 at the Wambiana grazing trial. Note 2006/07 rainfall included 200 mm that fell in June 2007.
3.2. Pasture composition
After ten years, pasture TSDM was far greater in the LSR and VAR than in the HSR strategy (Fig.3). Total 3-P (palatable, productive, perennial) grass yield was also 8 to 10
0 200 400 600 800 1000
'97/98 '98/99 '99/00 '00/01 '01/02 '02/03 '03/04 '04/05 '05/06 '06/07 '07/08
Year
Ra
in
fa
ll
(
m
m
)
fold greater in the former strategies. In terms of pasture condition, 3-P tussock density was 3 to 4 fold greater in the VAR and LSR than in the HSR. The slightly greater 3-P density in the LSR than in the VAR reflects the high utilisation rates inflicted on the VAR immediately preceding and leading into the dry years.
Figure 3. Change in the % contribution to pasture TSDM of different species groups between 1998 and 2008 for five grazing treatments at Wambiana. Data meaned over treatment replicates (n=2). Variable stocking 0% 20% 40% 60% 80% 100%
1998 1999 2000 2001 2002 2003 2004 2005 2006 2007 2008
Year P er c en ta ge ( % ) Rotational rest 0% 20% 40% 60% 80% 100%
1998 1999 2000 2001 2002 2003 2004 2005 2006 2007 2008
Year P er c en ta ge ( % ) SOI-Variable 0% 20% 40% 60% 80% 100%
1998 1999 2000 2001 2002 2003 2004 2005 2006 2007 2008
Year P e rc ent ag e ( % )
3P 2P Annuals Forbs Legs. Other Sedges Wire
Heavy stocking 0% 20% 40% 60% 80% 100%
1998 1999 2000 2001 2002 2003 2004 2005 2006 2007 2008
Year P e rc ent ag e ( % )
3P 2P Annuals Forbs Legs. Other Sedges Wire
Light stocking 0% 10% 20% 30% 40% 50% 60% 70% 80% 90% 100%
1998 1999 2000 2001 2002 2003 2004 2005 2006 2007 2008 Year P er c ent age ( % )
3.3. Runoff and soil loss
Initially, there were few differences in runoff between strategies due to high ground cover in early, high rainfall years. In later years however, the number and intensity of runoff events was markedly greater in the HSR compared to the LSR. This occurred particularly with early wet season storms in November and December, leading to increased sediment and nutrient loss. Overall, loss of nutrients, sediment and bedload increased with increasing long-term pasture utilisation rate (O’Reagain et al. 2008). The increased runoff was a direct consequence of the reduced soil macro-faunal activity and soil infiltration rates under heavy, constant stocking (Dawes-Gromadzki et al., 2007).
3.3.1. Treatment differences in runoff events
There were no clear differences between treatments in percentage runoff, particularly through the initial good seasons (data not shown). The lack of a treatment effect is not surprising considering the high cover levels in all treatments through the first five years of the trial (Table 1). These cover levels in turn reflect the good seasons and the relatively short period over which the grazing treatments had to express themselves.
Table 1. Average ground cover (%) for each treatment prior to wet season commencement i.e. end of dry, for each year of the trial.
Percentage ground cover for each treatment
Treatment name Date
HSR LSR R/Spell SOI VAR
1998 Oct 56 56 51 56 55
1999 Oct 65 70 64 67 63
2000 Oct 58 56 57 53 54
2001 Oct 66 71 62 64 59
2002 Oct 63 70 57 57 44
2003 Oct 36 54 43 45 41
2004 Oct 20 36 33 30 28
2005 Oct 18 29 32 29 24
2006 Oct 10 19 26 22 23
2007 Oct 24 32 36 30 29
In a similar fashion, three flows occurred in the 2005-2006 season in the HSR compared to only a single flow in the LSR (Fig. 4). What is of interest in both treatments is that relatively small amounts of rain are now triggering runoff events. This contrasts sharply with the earlier years when runoff generally only occurred in conjunction with very large rainfall events.
HSR flows: 29 Nov to 18 Jan 2005
0 0.02 0.04 0.06 0.08 0.1 0.12
29/11/2004 9/12/2004 19/12/2004 29/12/2004 8/01/2005 18/01/2005 28/01/2005
Fl ow he ight ( m m )
LSR flows: 29 Nov to 18 Jan 2005
0 0.02 0.04 0.06 0.08 0.1 0.12
29/11/2004 9/12/2004 19/12/2004 29/12/2004 8/01/2005 18/01/2005 28/01/2005
Fl ow h e ight ( m m )
LSR Flows: 2005-2006
0 0.01 0.02 0.03 0.04 1/10/0 5 1/11 /05 1/12/ 05 1/01/ 06 1/02/0 6 1/03 /06 1/04/ 06 1/05/ 06 F lo w hei g ht ( mm )
HSR Flows: 2005 - 2006
[image:10.612.100.458.319.497.2]0 0.01 0.02 0.03 0.04 1/10/0 5 1/11/0 5 1/12/0 5 1/01/ 06 1/02/ 06 1/03/ 06 1/04/ 06 1/05/ 06 F low hei g ht ( mm )
Figure 4. Runoff events and flow heights for the flumes located in the heavy and light stocking rates (top) between 29/11/04 – 18/01/05 and (bottom) over the 2005/06 wet season.
Median and range TSS concentrations for the different treatments from individual runoff events that occurred during the most recent four wet seasons (2004 to 2008) also support this finding (Fig 5). Average ground cover measurements were recorded for each treatment prior to the wet season onset (see Table 1); with the treatments in Figure 5a-d ordered from highest to lowest average ground cover in each of the boxplots. The highest median TSS concentrations were found in the treatments with the lowest ground cover (i.e. heavy stocking), although the concentration range was similar for most treatments (e.g. between 50 and 400 mg/L). Further comparison between treatments at this stage is difficult as data is not available for all treatments over all events due to autosampler failings and severe flooding of the flumes, particularly during the recent 2007/08 wet season.
[image:11.612.122.491.284.621.2]3.4. Economic performance
The heavily stocked VAR and HSR strategies made rapid initial gains in accumulated cash surplus (ACS) due to relatively high gross margins (GM) in the earlier wetter years (Fig. 6). However, ACS in the HSR dropped sharply in drier years post-2000/01 due to negative GMs arising from drought feeding costs, interest on livestock capital and reduced product value. In the LSR in contrast, ACS increased consistently across all years due to low costs and a higher product value. In the VAR, the initial gain was eroded by losses from reduced LWG and the forced sale of poor condition cattle with the transition to dry years in 2001/02. However, in contrast to the HSR, the rapid reduction in VAR stocking rates allowed ACS to recover in subsequent years. After 10 years, ACS was consequently highest in the LSR and VAR but lowest in the HSR: for a property size of 20 000 ha, this equates to a gross income advantage over the HSR of about AU$1.6 million (O’Reagain et al., 2008).
$ 0 $ 5,000 $ 10,000 $ 15,000 $ 20,000
A
c
c
um
ul
at
ed C
as
h
S
ur
pl
us
(
$/
100 ha)
[image:15.612.141.471.298.492.2]Var R/Spell SOI HSR LSR
4. Discussion and Conclusions
Data collected at the Wambiana trial over 10 years and a wide range of seasonal conditions, provide important evidence on the relative ability of the different stocking strategies to cope with rainfall variability. Constant heavy stocking at c. twice the long-term carrying capacity of the site, gave good economic and animal performance in the early high rainfall years and initially had no adverse affects upon land condition. However, the heavy stocking strategy suffered major economic loss with the advent of the drier years, and ultimately was far less profitable than either variable or light stocking. Heavy stocking combined with an inevitable sequence of low rainfall years led to a decline in land condition and carrying capacity, reduced soil health and increased the intensity and frequency of runoff events. Runoff water from the heavy stocking strategy also had some of the highest median TSS concentrations of all treatments over a number of monitored wet seasons. In the longer term, the reduced rainfall use efficiency that is likely to occur with reduced infiltration will have obvious negative consequences for pasture and animal production.
In contrast, constant light stocking at long-term carrying capacity gave good individual animal production, minimised costs and importantly was profitable across a range of rainfall years. Light stocking also maintained pasture condition within acceptable limits, maintained soil health, and consequently had a reduced intensity and frequency of runoff events, with lower median TSS concentrations during monitored wet season runoff events. Critically, it was profitable and sustainable over the ten years and showed no evidence of reduced carrying capacity. However, our observations are that the strategy would be improved by (a) inclusion of some form of wet season spelling (and possibly fire) to allow recovery of overgrazed patches or landtypes, (b) judicious adjustments of stocking rate to avoid overgrazing and loss of animal production in very dry years and possibly take some advantage of sequences of above average rainfall seasons.
Lastly, variable or flexible stocking showed some promise as a means of capitalising on good years and avoiding the losses caused by overstocking in low rainfall years. However, it clearly demonstrated the risks and adverse impacts associated with large changes in stocking rate between years. Variable stocking was profitable in most years but incurred significant losses in the transition from good to poor years and appeared to inflict significant and relatively long-lasting damage on pasture condition. Although the sharp downwards adjustment in stocking rate allowed margins to recover, it is significant that after ten years accumulated cash surpluses are nearly identical in the variable and light strategies. It is also noteworthy that pasture condition is still marginally poorer in the variable relative to the light strategy, despite 6 years of relatively light stocking rates in the former.
opportunity for pastures to recover in good seasons, emphasising a need for some form of pasture spelling (Muller et al., 2007). Other practical issues associated with a variable or flexible strategy include (a) difficulties in estimating available forage in large extensive paddocks, (b) problems with calculating the appropriate stocking rate, (c) logistical problems of selling or buying large numbers of animals when required and (d) reconciling stocking rate changes with maintenance of a viable breeding herd (Foran and Stafford-Smith, 1991).
5. References
Bartley, R., Roth, C.H., Ludwig, J., McJannet, D., Liedloff, A., Corfield, J., Hawdon, A. and Abbott, B. 2006. Runoff and erosion from Australia’s tropical semi-arid rangelands: influence of ground cover for differing space and time scales. Hydrological Processes,
20: 3317-3333.
Clewett, J.F., Clarkson, N.M., George, D.A., Ooi, S.H., Owens, D.T., Partridge, I.J. and Simpson, G.B. 2003. Rainman Streamflow (version 4.3): A comprehensive climate and streamflow analysis package on CD to assess seasonal forecasts and manage climate risk. QI03040. Department of Primary Industries, Queensland.
Dawes-Gromadzki, T.Z., Cook, G.D., Liedloff, A..C., Brandis, A.M. 2007. Impacts of cattle grazing management on termite assemblage structure, ecohydrological function and soil health in semi-arid north Queensland. 8th Invertebrate Biodiversity and Conservation/Society of Australian Systematic Biologists Conference. University of Queensland, December 2007.
De Corte, M., Cannon, M., Barry, E., Bright, J., Scanlan, J. 1991. Land degradation in the Dalrymple Shire: a preliminary assessment. CSIRO, Davies Laboratory, Townsville.
Foran, B.D. and Stafford-Smith, D.M. 1991. Risk, biology and drought management strategies for cattle stations in central Australia. Journal of Environmental Management,
33: 17-33.
Higgins, S.I., Kantelhardt, J., Scheiter, S. and Boerner, J. 2007. Sustainable management of extensively managed savanna rangelands. Ecological Economics, 62: 102-114.
Isbell, R.F. 1996. The Australian Soil Classification. CSIRO Publishing, Melbourne.
Ludwig, J.A., Bartley, R., Hawdon, A., Abbott, B. and McJannet, D. 2007. Patch configuration non-linearly affects sediment loss across scales in a grazed catchment in north-east Australia. Ecosystems, 10: 839-845.
McIvor, J.G. Williams, J. Gardener, C.J. 1995. Pasture management influences runoff and soil movement in the semi-arid tropics. Australian Journal of Experimental
Agriculture, 35: 55-65.
McKeon, G.M., Day, K.A., Howden, S.M., Mott, J.J., Orr, D.M., Scattini, W.J. and Weston, E.J. 1990. Northern Australian savannas: management for pastoral production.
Journal of Biogeography, 17: 355-372.
O’Reagain, P.J., Brodie, J., Fraser, G., Bushell, J.J., Holloway, C.H., Faithful, J.W. & Haynes, D. 2005. Nutrient loss and water quality under extensive grazing in the upper Burdekin river catchment, North Queensland. Marine Pollution Bulletin,51: 37-50.
O'Reagain, P.J., Bushell, J.J., Holloway, C.H. 2008. Final report: B.NBP.0379. Testing and developing grazing principles and management guidelines for the seasonably variable tropical savannas. Meat and Livestock Australia, Sydney.
Scanlan, J.C., Pressland, A.J. and Myles, D.J. 1996. Runoff and soil movement on mid-slopes in north-east Queensland grazed woodlands. Rangeland Journal, 18: 33-46.
Tothill, J.C. and Gillies, C. 1992. The pasture lands of northern Australia. Their condition, productivity, and sustainability. Tropical Grassland Society of Australia