National Foundation for Educational Research
Education Outside the Classroom:
An assessment of activity and
practice in schools and local
authorities
Technical Appendix
Lisa O’Donnell
Rebekah Wilson
Marian Morris
Contents
page
1. Introduction
1
2.
Primary headteacher tables
2
3.
Foundation Stage coordinator tables
16
4.
Key Stage 1 coordinator tables
24
5.
Key Stage 2 coordinator tables
32
6.
Secondary headteacher tables
40
7.
Heads of subject departments tables
56
8.
Special school headteacher tables
70
9.
Special school teacher tables
86
1. Introduction
In order to obtain a greater understanding of the extent and nature of education
outside the classroom (EOtC) in England, the Department for Education and
Skills (DfES), in collaboration with the Countryside Agency and Farming and
Countryside Education (FACE), commissioned the National Foundation for
Educational Research (NFER) to undertake an assessment of EOtC activity
and practice in schools and local authorities (LAs).
The research involved questionnaire surveys of representative samples of
primary, secondary and special schools, and questionnaires were sent to the
following members of teaching staff, in June 2006:
•
the headteacher
•
teachers with responsibility for the Foundation Stage, Key Stage 1 and
Key Stage 2 (one of each per primary school)
•
heads of 15 subject departments in each secondary school
•
teachers with responsibility for EOtC in special schools (one per school)
An online survey of Outdoor Education Advisers (OEAs), as well as
Citizenship and PSHE advisers in all LAs was also undertaken.
This technical appendix presents the basic frequency data from the surveys of
schools and local authorities, for each of the groups of respondents. Further
details of the aims of the research and the methods adopted are provided in the
2.
Primary headteacher tables
Table 2.1
EOtC activities available to pupils since September 2005
Activities: %
School site activities 95
Off-site day visits 98
Before/after school study support 68 Off-site residentials within the UK 80 Off-site residentials overseas 7 Non-residential activities in holiday periods 28
No response 1
N = 201
More than one answer could be given so percentages may not sum to 100 A total of 199 respondents answered at least one item in this question.
Source: NFER primary headteacher survey of education outside the classroom, 2006
Table 2.2a
Planning for EOtC
Within your school is EOtC a
feature of: Yes
%
Not yet, plan to include in
future %
No, no plans for inclusion
%
Not applicable
%
No response
% The school
improvement/development plan 62 19 13 1 5 Curriculum
strategy/development plans 62 15 7 5 11 Key Stage
strategy/development plan 35 15 10 14 25 Health and Safety policies 78 9 3 0 8 The Self-Evaluation Form 84 9 1 0 5
Other 1 0 0 1 97
N = 201
A series of single response items
Due to rounding, percentages may not always sum to 100
Source: NFER primary headteacher survey of education outside the classroom, 2006
Table 2.2b
Overall policy for EOtC
Does the school have an overall policy for EOtC: %
Yes 16
Not yet, plan to include in future 52 No, no plans for inclusion 29
No response 3
N = 201
A single response item
Due to rounding, percentages may not sum to 100
Source: NFER primary headteacher survey of education outside the classroom, 2006
Table 2.3
Views of EOtC in the school
Views of EOtC: Strongly agree %
Agree %
Neutral %
Disagree %
Strongly disagree
%
No response
%
EOtC is an integral part of the learning and development of pupils
in this school 59 38 2 1 0 <1 The benefits of EOtC are widely
recognised in this school 57 38 3 1 0 0 EOtC is part of the school ethos 55 36 8 <1 0 0 The senior management
encourage EOtC across the school 59 35 4 2 0 0 The senior management
encourage EOtC for some
curricular areas only 6 14 14 45 17 3 Pressure on the curriculum means
that EOtC is very limited 3 16 19 45 14 1 There are few opportunities for
EOtC within the locality of the
school 2 14 11 42 30 1
Teachers in this school make the
most of opportunities for EOtC 27 52 15 5 <1 <1 The senior management
encourage EOtC in some year
groups/Key Stages only <1 7 9 50 32 1 The school ensures that all pupils
have equal access to EOtC 43 45 7 2 1 <1 EOtC is a low priority for teachers
in this school <1 2 11 49 35 2 The amount of EOtC provision in
Table 2.4
Aims of EOtC
The main aims of EOtC are: %
Personal development for pupils 66
Link with outside world 45
Develop pupils’ skills 36
Develop pupils’ knowledge 23
All areas of curriculum 8
Inclusion 7
PSHE/ Citizenship 7
Physical development 5
Fun 5
Accommodating different learning styles 3
Work-related learning 1
No response 15
N = 201
More than one answer could be put forward so percentages do not sum to 100 A total of 170 respondents gave at least one response to this question.
Source: NFER primary headteacher survey of education outside the classroom, 2006
Table 2.5a
Extent to which schools are able to provide access to EOtC for
pupils
Pupils.... With great difficulty
%
With moderate
difficulty %
No difficulty
%
Not applicable
%
No response
% From minority ethnic groups 0 6 68 22 3 Who are reluctant to
learn/disengaged 1 21 63 7 8 For whom English is an additional
language 0 8 62 27 2
With sensory and/or physical
needs 1 21 48 23 5
With communication and
interaction needs 0 16 68 9 6 With behavioural, emotional and
social difficulties 2 33 54 3 7 With cognition and learning needs 0 14 74 4 7 Who are economically
disadvantaged 5 20 63 3 8
N = 201
Table 2.5b
Extent to which school targets specific pupils for EOtC
Pupils.... Target group
%
From minority ethnic groups 9
Who are reluctant to learn/disengaged 18 For whom English is an additional language 8 With sensory and/or physical needs 8 With communication and interaction needs 11 With behavioural, emotional and social difficulties 27 With cognition and learning needs 12 Who are economically disadvantaged 17
No response 66
N = 201
More than one answer could be given so percentages may not sum to 100 A total of 68 respondents answered at least one item in this question.
Source: NFER primary headteacher survey of education outside the classroom, 2006
Table 2.6
Providing access to EOtC for pupils who need extra support
The school… %
Provides funding for pupils 77 Adapts EOtC tasks/activities 64 Provides alternative activities 31 Provides funding for extra staff 55
Modifies pupil groups 47
Other 6
No response 7
N = 201
More than one answer could be given so percentages may not sum to 100 A total of 187 respondents answered at least one item in this question.
Source: NFER primary headteacher survey of education outside the classroom, 2006
Table 2.7
Member of staff in school with responsibility for coordinating
EOtC
Member of staff: %
Headteacher 33
Assistant or deputy head 22
Department/faculty/Key Stage head 8
Subject teacher 10
Another member of staff 6
Responsibility is left to individual teachers 15
No response 7
N = 201
A single response item
Due to rounding, percentages may not sum to 100
Table 2.8
Responsibility for organising and monitoring EOtC activities
Main responsibility for.... Local authority % Head teacher % Educational visits coordinator % Class teachers % Other staff % Not applicable/ not in practice % No response % Ensuring that educational visits meet risk management requirements11 65 47 31 9 0 1
Approving/authorising
educational visits 16 90 22 4 3 0 0 Assigning staff
members to lead or coordinate educational visits
2 69 25 25 4 1 1
Assessing the competence of leaders/coordinators involved in educational visits
2 83 28 5 2 2 1
Organising the training /induction of adults involved in educational visits
10 49 34 19 6 3 1
Organising the vetting of adults involved in educational visits
11 74 15 4 21 1 1
Organising emergency arrangements for educational visits
3 64 40 24 6 1 1
Recording accidents and ‘near’ accidents on educational visits
3 43 30 58 11 2 1
Monitoring and
reviewing EOtC 3 62 39 15 6 7 2 Tracking EOtC across
curricular areas/year groups/Key Stages
1 42 25 17 12 22 3
Tracking the EOtC that each pupil has experienced
1 27 16 23 7 42 2
Table 2.9
Staffing for EOtC activities since September 2005
Activities: Teachers
who volunteer
%
Teachers of the relevant age group
of pupils %
Teachers with particular experience/ skills
%
Support staff
%
Other adults
%
No response
%
School site activities 31 79 32 65 35 5 Off-site day visits 16 96 21 70 37 1 Before/after school
study support 35 22 22 34 15 28 Off-site residentials
within the UK 48 55 31 49 16 19 Off-site residentials
overseas 6 6 3 4 2 92
Non-residential activities in holiday periods
8 1 5 8 17 72
N = 201
More than one answer could be given so percentages may not sum to 100
Source: NFER primary headteacher survey of education outside the classroom, 2006
•
Other adults who had staffed EOtC activities included parents, specialist
staff, sports coaches, school governors and youth workers.
Table 2.10
Support for staff involved in organising and planning EOtC
Support available: %
Non-contact time to plan and organise EOtC 45 Teaching cover to allow staff to leave the school premises for EOtC activities 68 Health and safety training for EOtC activities 52 Risk management for EOtC activities 75 Training on the learning outcomes of EOtC 12 Funding to buy resources for EOtC 40 Additional staffing for EOtC activities 70 Time/funding to carry out exploratory visits for EOtC 47
No response 4
N = 201
More than one answer could be given so percentages may not sum to 100 A total of 193 respondents answered at least one item in this question.
Table 2.11a Support received from Local Authority in relation to EOtC
Support: Useful
%
Not useful %
Not available
%
No response
% Promotion of the benefits of EOtC 39 6 32 23 Promotion of the range of EOtC
opportunities on offer in the authority 46 3 26 25 Support with curriculum development
in relation to EOtC 31 3 36 29 Support with teaching and learning in
relation to EOtC 26 2 38 34 Support/advice on health and safety 93 <1 2 4 Support/advice on risk management 92 2 2 4 Ensuring that training in relation to
EOtC is available for school staff 43 2 31 23 Sharing good practice about EOtC
provision across schools within the Local Authority
24 1 42 32
Providing guidance on supervision and
staff pupil ratios 80 2 7 11 Provision of outdoor learning facilities 56 5 21 18
Other <1 <1 0 99
N = 201
A series of single response items
Due to rounding, percentages may not always sum to 100
Source: NFER primary headteacher survey of education outside the classroom, 2006
Table 2.11b Support that schools would like from their Local Authority
Support: %
Promotion of the benefits of EOtC 20 Promotion of the range of EOtC opportunities on offer in the authority 28 Support with curriculum development in relation to EOtC 31 Support with teaching and learning in relation to EOtC 32 Support/advice on health and safety 6 Support/advice on risk management 5 Ensuring that training in relation to EOtC is available for school staff 25 Sharing good practice about EOtC provision across schools within the Local
Authority 35
Providing guidance on supervision and staff pupil ratios 12 Provision of outdoor learning facilities 21
Table 2.12
Schools’ risk management procedures for EOtC
Risk management procedures are.... %
Provided by the Local Authority 35 Provided by the Local Authority and modified by the school 62 Provided by another external organisation 15 The school’s own strategies 41
No response 1
N = 201
More than one answer could be given so percentages may not sum to 100 A total of 200 respondents answered at least one item in this question.
Source: NFER primary headteacher survey of education outside the classroom, 2006
Table 2.13
Collection of data about EOtC
Information collected:
For the school as
a whole %
A department/ faculty level
%
Information not collected
%
No response
%
Number of visits undertaken by classes 68 7 25 3 Number of visits undertaken by
individual students 16 4 60 21 Number of out-of-hours visits
undertaken by staff 20 5 59 18 Health and safety incidents 88 4 5 7 The amount of planning needed to run
the activity 26 10 51 16
N = 201
Information on the number of respondents to this question was not available at this stage More than one answer could be given so percentages may not sum to 100
Source: NFER primary headteacher survey of education outside the classroom, 2006
Table 2.14
Extent of collaboration to provide EOtC
Organisations worked with: %
Primary schools 40
Secondary schools 40
Special schools 3
Sixth form/FE colleges 4
Higher education institutions 9
Other organisations 55
No collaborative work 21
No response 2
N = 201
Table 2.15
Changes in the amount of EOtC activity in the last five years
Activities: Increased
%
No change
%
Decreased %
Not sure
%
Not applicable
%
No response
%
School site activities 66 27 1 2 <1 3 Off-site day visits 52 38 6 2 0 1 Before/after school study support 62 14 1 <1 11 12 Off-site residentials within the UK 24 53 10 <1 5 7 Off-site residentials overseas 6 10 2 1 52 28 Non-residential activities in holiday
periods 25 12 3 1 36 22
N = 201
A series of single response items
Due to rounding, percentages may not always sum to 100
Source: NFER primary headteacher survey of education outside the classroom, 2006
Table 2.16
Reasons for increases and decreases in EOtC provision
Reason: Reason for increase
%
Reason for decrease
% Recording main risks and how to manage them 7 11 Availability of suitable EOtC opportunities 36 4 Availability of staff to conduct EOtC activities 34 12 Teacher awareness of outcomes of EOtC 43 3 Level of teacher training in EOtC 11 4 Level of senior management support 42 2 Level of parental support 26 9 Level of teacher union/association support 2 10 Taking responsibility for pupil safety 7 19 Priority in the curriculum 44 5
Travel costs 4 32
Other costs associated with EOtC 2 18 Funding for EOtC provision 13 14 Focus on EOtC at a national level 6 6 Focus on EOtC at a local level 10 6
Other 10 3
No response 24 61
(three individuals), the Extended Schools agenda (three individuals), and
the Every Child Matters agenda (two individuals). Other reasons given for
a decline in provision included teacher workload (two individuals) and
requirements for Criminal Records Bureau checks (one individual).
Table 2.17
Extent to which schools are able to meet the costs of EOtC
provision
Costs of EOtC provision: Always
%
Frequently %
Sometimes %
Rarely %
No response
% Arranging/funding teaching cover 25 20 39 13 2 Paying for special resources/equipment 10 15 50 19 5 Training for teacher/adults involved 10 20 46 20 4 Funding EOtC activities for young people
eligible for Free School Meals 17 20 34 23 5 N = 201
A series of single response items
Due to rounding, percentages may not always sum to 100
Source: NFER primary headteacher survey of education outside the classroom, 2006
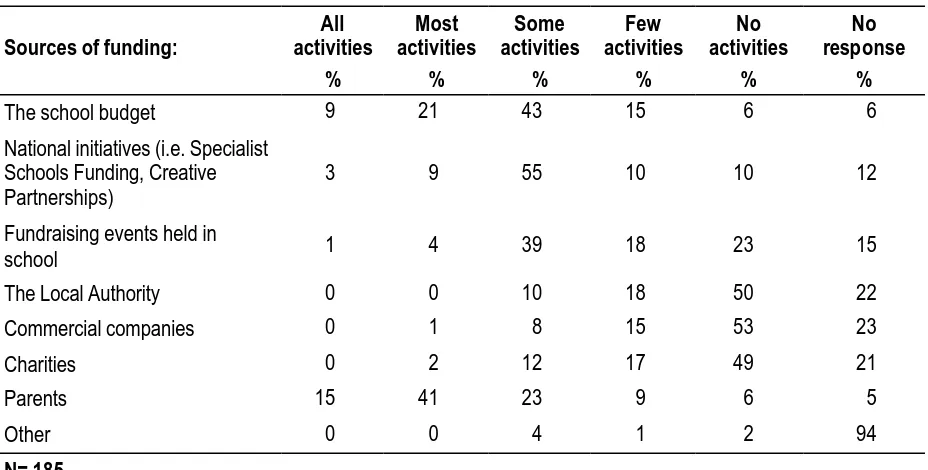
Table 2.18
Funding for EOtC activities since September 2005
Sources of funding: activities All %
Most activities
%
Some activities
%
Few activities
%
No activities
%
No response
% The school budget 11 16 39 14 14 5 National initiatives 0 1 28 8 39 23 Fundraising events held in
school 5 7 46 17 14 10
The Local Authority 1 0 11 12 52 23 Commercial companies <1 <1 7 9 58 25
Charities 1 2 11 10 51 24
Parents 19 34 22 9 7 9
Other 0 0 4 <1 6 89
N = 201
A series of single response items
Due to rounding, percentages may not always sum to 100
Source: NFER primary headteacher survey of education outside the classroom, 2006
Table 2.19
Plans for EOtC provision in 2006/07
Activities: increase Plan to
%
Plan to keep the
same %
Plan to decrease
%
Not sure
%
Not applicable
%
No response
% School site activities 52 45 0 1 1 <1 Off-site day visits 26 71 0 1 <1 1 Before/after school
study support 40 38 <1 5 6 9 Off-site residentials
within the UK 12 74 2 4 4 3 Off-site residentials
overseas 3 13 <1 3 55 24 Non-residential
activities in holiday periods
18 18 1 10 34 19
N = 201
A series of single response items
Due to rounding, percentages may not always sum to 100
Source: NFER primary headteacher survey of education outside the classroom, 2006
Table 2.20
Changes to facilitate EOtC in the future
Changes/actions to enable more EOtC provision %
Increased funding 52
More time/flexibility in curriculum 11 More staff available to be involved in activities 9
More support 8
Wider support for EOtC 7
Better outdoor facilities 7
More staff training in EOtC 4
Less focus on risks of EOtC 3
Improved information/ awareness of EOtC 3
Less risk assessment 3
Compulsory EOtC 2
No changes needed 2
More collaboration 1
Improved transport 1
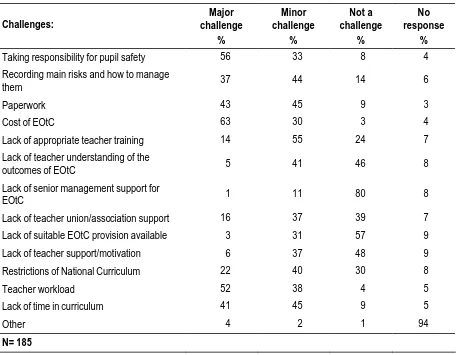
Table 2.21
Challenges to EOtC provision in the future
Challenges:
Major challenge
%
Minor challenge
%
Not a challenge
%
No response
% Taking responsibility for pupil safety 50 38 8 3 Recording main risks and how to manage
them 24 58 14 4
Paperwork 46 45 6 3
Cost of EOtC 77 18 2 3
Lack of appropriate teacher training 10 51 32 7 Lack of teacher understanding of the
outcomes of EOtC 4 37 53 6
Lack of senior management support for EOtC 2 7 86 5 Lack of teacher union/association support 8 36 47 9 Lack of suitable EOtC provision available 10 26 56 7 Lack of teacher support/motivation 7 29 58 6 Restrictions of National Curriculum 21 33 41 4
Teacher workload 44 41 12 2
Lack of time in curriculum 32 41 22 4
Other 5 1 1 93
N = 201
A series of single response items
Due to rounding, percentages may not always sum to 100
Source: NFER primary headteacher survey of education outside the classroom, 2006
Table 2.22
Benefits of providing EOtC
EOtC has a positive impact on… %
The school ethos 98
Teachers’ skills/subject knowledge 73
Teacher motivation 68
Pupils’ subject knowledge and understanding 94 Pupils’ attitudes/values/self-perceptions 96 Pupils’ communication/social skills 94 Pupils’ physical fitness/skills 87 Pupils’ behaviour/motivation levels 92 Broadening pupils’ experiences 98 Providing opportunities for pupils with different learning styles 89
Other 6
No response 1
N = 201
More than one answer could be given so percentages may not sum to 100 A total of 200 respondents answered at least one item in this question.
Source: NFER primary headteacher survey of education outside the classroom, 2006
3.
Foundation Stage coordinator tables
Table 3.1
Percentage of pupils in Foundation Stage who have been offered
EOtC activities since September 2005
Percentage of pupils: %
0% 1
1 – 25 % 5
26 – 50% 1
51 – 75% 3
76 – 100% 86
No response 3
N = 147
A single response i tem
Due to rounding, percentages may not sum to 100
Source: NFER Foundation Stage coordinator survey of education outside the classroom, 2006
Table 3.2
Number of EOtC activities undertaken since September 2005
Activities: 0
%
1-3 %
4-6 %
7-9 %
10 or more %
No response
% School site activities 1 12 7 13 64 3 Off-site day visits 13 58 19 5 3 3 Before/after school study support 75 6 1 1 3 14 Off-site residentials within the UK 83 3 1 0 0 14 Off-site residential experiences overseas 86 0 0 0 0 14 Non-residential activities in holiday
periods 78 5 1 0 1 14 N = 147
A series of single response items
Due to rounding, percentages may not always sum to 100
Table 3.3
Number of visits undertaken to different venues since September
2005
Venues: 0
%
1-3 %
4-6 %
7-9 %
10 or more %
No response
% Urban built environments 40 33 3 0 1 23 Urban nature (e.g. allotments,
playgrounds, scrubland, derelict sites) 37 32 4 0 2 26 Places of cultural interest (e.g.
theatres) 48 18 0 0 0 34 Places of historical interest (e.g.
museums) 49 24 0 0 0 27 Community centres/places of worship 45 26 2 1 0 27 City farms 53 14 0 0 0 34 Rural farms 45 28 1 0 0 26 Field studies centres 63 3 0 0 0 34 Environmental centres 52 14 0 0 0 34 National nature reserve/sites of
Special Scientific Interest 54 13 0 0 0 33 Forest/woodlands 51 19 2 0 0 29 Water bodies (e.g. rivers, lakes) 59 8 0 0 0 33 General countryside (e.g. country
parks, national parks, moors, mountains)
53 15 1 0 0 31
Outdoor pursuits/adventure centres 60 4 0 0 1 35 Other 44 17 3 0 0 35 N = 133
A series of single response items
Due to rounding, percentages may not always sum to 100
Table 3.4
Aims of EOtC
The main aims of EOtC are: %
Personal development for pupils 76
Link with outside world 45
Develop pupils’ skills 31
Develop pupils’ knowledge 31
Physical development 22
Inclusion 3
Use of open space 3
Accommodating different learning styles 2
Fun 1
Reward 1
No response 3
N = 147
More than one answer could be put forward so percentages do not sum to 100 A total of 143 respondents gave at least one response to this question.
Source: NFER Foundation Stage coordinator survey of education outside the classroom, 2006
Table 3.5
Topics delivered through EOtC activities
Topics: %
Geography-related 47
All six areas of learning 42
PE/Sports 25
Creative development 17
Science-related 14
PSHE-related 12
Literacy-related 12
Numeracy-related 9
Religious education-related 2
Environmental studies 2
Art and design-related 1
All units of work 1
History-related 1
ICT-related 1
Leisure and tourism 1
No response 2
N = 147
Table 3.6
Confidence in relation to EOtC activities
Activities: Very
%
Somewhat %
Not very %
Not at all %
No response
% Preparing pupils for EOtC 64 35 1 0 0 Planning EOtC activities 54 43 3 0 0 Running EOtC activities 52 44 5 0 0 Following up EOtC activities in class 61 37 2 0 0 Gauging the quality of EOtC
activities 40 55 4 0 1 Evaluating the impact of EOtC
activities on pupils 40 50 10 0 0 Carrying out risk management 33 54 12 1 1 N = 147
A series of single response items
Due to rounding, percentages may not always sum to 100
Source: NFER Foundation Stage coordinator survey of education outside the classroom, 2006
Table 3.7
Satisfaction with support in relation to EOtC
Support received from… Very %
Somewhat %
Not very %
Not at all %
Not applicable
%
No response
% Local Authority 15 35 23 5 19 2
Headteacher 62 31 3 1 3 1
Senior managers 52 28 3 1 13 3 Teaching assistants 69 24 5 0 2 1 School governors 27 25 14 10 22 2 Other teachers in the school 40 37 6 1 13 2 Educational Visits
Coordinator 23 22 8 6 35 5
External providers 22 41 9 6 22 1 Teacher unions/associations 3 16 14 14 48 5
Parents 39 45 7 3 4 1
N = 147
A series of single response items
Due to rounding, percentages may not always sum to 100
Table 3.8
Training for EOtC
Training received:
Initial teacher training
%
Subsequent training
%
Not received
training %
No response
% Preparing pupils for EOtC 21 36 47 1 Planning EOtC activities 20 50 37 0 Running EOtC activities 18 47 41 1 Following up EOtC activities in class 19 33 53 0 Gauging the quality of EOtC activities 9 31 61 1 Evaluating the impact of EOtC activities on pupils 9 30 62 0 Carrying out risk management 8 51 40 1 N = 147
More than one answer could be given so percentages may not sum to 100
Source: NFER Foundation Stage coordinator survey of education outside the classroom, 2006
Table 3.9
Changes in the amount of EOtC activity in the last five years
Activities: Increased
%
No change
%
Decreased %
Not sure
%
Not applicable
%
No response
% On school site activities 76 21 1 1 1 0 Off-site day visits 27 41 27 2 3 1 Before/after school study support 14 22 3 9 50 2 Off-site residentials within the UK 1 20 3 7 67 2 Off-site residential experiences
overseas 0 19 2 7 70 1 Non-residential activities in holiday
periods 8 17 1 12 60 1
N = 147
A series of single response items
Due to rounding, percentages may not always sum to 100
Table 3.10
Reasons for increases and decreases in EOtC provision
Reasons: Reason for increase
%
Reason for decrease
% Recording main risks and how to manage them 12 35 Availability of suitable EOtC opportunities 44 17 Availability of staff to conduct EOtC activities 32 25 Teacher awareness of outcomes of EOtC 59 6 Level of teacher training in EOtC 27 14 Level of senior management support 41 5 Level of parental support 27 20 Level of teacher union/association support 5 19 Taking responsibility for pupil safety 7 40 Priority in the curriculum 62 7
Travel costs 2 50
Other costs associated with EOtC 2 40 Funding for EOtC provision 10 37 Focus in EOtC at a national level 34 12 Focus on EOtC at a local level 33 12
Other 1 1
No response 25 41
N = 147
More than one answer could be given so percentages may not sum to 100
A total of 110 and 87 respondents respectively a nswered at least one item in these two questions Source: NFER Foundation Stage coordinator survey of education outside the classroom, 2006
Table 3.11
Plans for EOtC provision in 2006/07
Activities: Plan to
increase % Plan to keep the same % Plan to decrease % Not sure % Not applicable % No response %
School site activities 69 30 0 1 0 1 Off-site day visits 37 55 0 4 2 2 Before/after school study support 12 16 0 14 54 4 Off-site residentials within the UK 1 11 1 4 81 2 Off-site residential experiences
overseas 1 10 1 2 84 2
Non-residential activities in holiday
periods 5 12 0 9 73 2 N = 147
A series of single response items
Due to rounding, percentages may not always sum to 100
Source: NFER Foundation Stage coordinator survey of education outside the classroom, 2006
Table 3.12
Challenges to EOtC provision in the future
Challenges: challenge Major
% Minor challenge % Not a challenge % No response % Taking responsibility for pupil safety 57 34 8 1 Recording main risks and how to manage
them 43 48 8 1
Paperwork 40 46 12 1
Cost of EOtC 71 24 3 2
Lack of appropriate teacher training 21 46 28 5 Lack of teacher understanding of the
outcomes of EOtC 10 39 46 5
Lack of senior management support for
EOtC 6 24 65 5
Lack of teacher union/association support 10 23 59 8 Lack of suitable EOtC provision 26 39 32 3 Lack of teacher support/motivation 6 26 63 5 Lack of potential in subject area 5 27 63 5 Restrictions of National Curriculum 5 22 68 5
Teacher workload 28 46 24 2
Lack of time in curriculum 17 28 50 5
Other 4 1 3 91
N = 147
A series of single response items
•
Other challenges identified included lack of staff availability (four
individuals), lack of funding (two individuals), difficulties providing equal
access (one individual) and fear of litigation (one individual).
Table 3.13
Changes to facilitate EOtC in the future
Changes/actions to enable more EOtC provision %
Increased funding 48
More support 20
Better outdoor facilities 19
Improved information/ awareness of EOtC 18 More staff available to be involved in activities 18
Wider support for EOtC 13
Cheaper provision available 10 More staff training in EOtC 10
Less risk assessment 6
Less focus on risks of EOtC 5
More time/flexibility in curriculum 4
Improved staff motivation 2
No changes needed 2
Compulsory EOtC 1
Improved transport 1
Changes in school policy 1
No response 14
N = 147
More than one answer could be put forward so percentages do not sum to 100 A total of 126 respondents gave at least one response to this question.
4.
Key Stage 1 coordinator tables
Table 4.1
Percentage of pupils in Key Stage 1 who have been offered EOtC
activities since September 2005
Percentage of pupils: %
0% 0
1 – 25 % 5
26 – 50% 2
51 – 75% 4
76 – 100% 87
No response 2
N =143
A single response item
Due to rounding, percentages may not sum to 100
Source: NFER Key Stage 1 coordinator survey of education outside the classroom, 2006
Table 4.2
Number of EOtC activities undertaken since September 2005
Activities: 0
%
1-3 %
4-6 %
7-9 %
10 or more %
No response
% School site activities 3 18 31 8 34 6 Off-site day visits 2 45 31 10 8 4 Before/after school study support 49 18 6 2 9 15 Off-site residentials within the UK 78 6 0 0 1 15 Off-site residential experiences
overseas 83 1 0 0 1 14 Non-residential activities in holiday
periods 71 11 1 0 1 16 N = 143
A series of single response items
Due to rounding, percentages may not always sum to 100
Table 4.3
Number of visits undertaken to different venues since September
2005
Venues: 0
%
1-3 %
4-6 %
7-9 %
10 or more %
No response
% Urban built environments 29 42 3 1 1 24 Urban nature (e.g. allotments,
playgrounds, scrubland, derelict sites) 26 41 9 1 1 22 Places of cultural interest (e.g. theatres) 37 40 2 1 0 20 Places of historical interest (e.g.
museums) 20 57 6 1 0 15 Community centres/places of worship 22 55 8 2 1 13 City farms 59 8 1 0 0 32 Rural farms 50 22 0 0 0 29 Field studies centres 55 14 1 0 0 30 Environmental centres 55 17 1 0 0 28 National nature reserve/Sites of Special
Scientific Interest 56 17 1 0 0 26 Forest/woodlands 42 27 2 0 0 29 Water bodies (e.g. rivers, lakes) 51 20 0 0 0 29 General countryside (e.g. country parks,
national parks, moors, mountains) 43 29 2 0 0 25 Outdoor pursuits/adventure centres 62 8 0 0 0 30 Other 47 19 3 0 0 31 N = 143
A series of single response items
Due to rounding, percentages may not always sum to 100
Table 4.4
Aims of EOtC
The main aims of EOtC are: %
Personal development for pupils 71
Link with outside world 71
Develop pupils’ knowledge 33
Develop pupils’ skills 30
Physical development 7
Fun 6
Accommodating different learning styles 4
Inclusion 3
Use of open space 1
Work-related learning 1
No response 6
N = 143
More than one answer could be put forward so percentages do not sum to 100 A total of 134 respondents ga ve at least one response to this question.
Source: NFER Key Stage 1 coordinator survey of education outside the classroom, 2006
Table 4.5
Topics delivered through EOtC activities
Topics: %
Science-related 79
Geography-related 63
Religious education-related 30
History-related 29
Art and design-related 22
Leisure and tourism 17
English-related 11
Environmental studies 9
PSHE-related 6
PE/Sports 4
Maths-related 3
Music-related 1
Non subject-related 1
All units of work 1
No response 2
N = 143
More than one answer could be put forward so percentages do not sum to 100 A total of 140 respondents gave at least one response to this question.
Table 4.6
Confidence in relation to EOtC activities
Activities: Very
%
Somewhat %
Not very %
Not at all %
No response
% Preparing pupils for EOtC 68 31 0 0 1 Planning EOtC activities 66 34 0 0 0 Running EOtC activities 55 43 2 0 0 Following up EOtC activities in
class 68 31 0 0 1 Gauging the quality of EOtC
activities 52 45 3 0 0 Evaluating the impact of EOtC
activities on pupils 43 52 4 0 1 Carrying out risk management 43 47 10 1 0 N = 143
A series of single response items
Due to rounding, percentages may not always sum to 100
Source: NFER Key Stage 1 coordinator survey of education outside the classroom, 2006
Table 4.7
Satisfaction with support in relation to EOtC
Support received from… Very %
Somewhat %
Not very %
Not at all %
Not applicable
%
No response
% Local Authority 13 43 15 5 20 3
Headteacher 68 27 3 0 1 1
Senior managers 58 27 2 0 10 3 Teaching assistants 72 22 2 1 2 1 School governors 35 22 15 10 16 1 Other teachers in the school 64 27 3 1 3 1 Educational Visits
Coordinator 42 13 3 7 31 3
External providers 29 43 6 3 14 5 Teacher unions/associations 5 19 13 14 45 4
Parents 43 39 10 3 3 1
N = 143
A series of single response items
Due to rounding, percentages may not always sum to 100
Table 4.8
Training for EOtC
Training received:
Initial teacher training
%
Subsequent training
%
Not received
training %
No response
% Preparing pupils for EOtC 26 32 49 1 Planning EOtC activities 25 36 45 1 Running EOtC activities 21 34 50 1 Following up EOtC activities in class 24 24 56 1 Gauging the quality of EOtC activities 12 20 69 1 Evaluating the impact of EOtC activities on pupils 12 24 65 1 Carrying out risk management 11 59 34 0 N = 143
More than one answer could be given so percentages may not sum to 100
Source: NFER Key Stage 1 coordinator survey of education outside the classroom, 2006
Table 4.9
Changes in the amount of EOtC activity in the last five years
Activities: Increased
%
No change
%
Decreased %
Not sure
%
Not applicable
%
No response
% On school site activities 57 33 3 3 0 3 Off-site day visits 36 36 22 4 0 1 Before/after school study support 31 27 2 8 27 5 Off-site residentials within the UK 6 28 6 7 51 1 Off-site residential experiences
overseas 1 22 6 7 61 2
Non-residential activities in holiday
periods 12 22 3 13 49 2
N = 143
A series of single response items
Due to rounding, percentages may not always sum to 100
Table 4.10
Reasons for incre ases and decreases in EOtC provision
Reasons: Reason for increase
%
Reason for decrease
% Recording main risks and how to manage them 13 30 Availability of suitable EOtC opportunities 42 8 Availability of staff to conduct EOtC activities 22 20 Teacher awareness of outcomes of EOtC 36 9 Level of teacher training in EOtC 11 18 Level of senior management support 36 6
Level of parental support 25 12
Level of teacher union/association support 4 12 Taking responsibility for pupil safety 10 36 Priority in the curriculum 50 13
Travel costs 8 49
Other costs associated with EOtC 4 33
Funding for EOtC provision 8 29
Focus in EOtC at a national level 17 12 Focus on EOtC at a local level 18 11
Other 4 4
No response 27 43
N = 143
More than one answer could be given so percentages may not sum to 100
A total of 104 and 81 respondents respectively answered at least one item in these two questions Source: NFER Key Stage 1 coordinator survey of education outside the classroom, 2006
Table 4.11
Plans for EOtC provision in 2006/07
Activities: increase Plan to
% Plan to keep the same % Plan to decrease % Not sure % Not applicable % No response %
School site activities 60 35 0 3 1 1 Off-site day visits 33 65 1 1 1 0 Before/after school study support 23 33 0 13 29 2 Off-site residentials within the UK 1 29 1 9 58 2 Off-site residential experiences
overseas 0 19 1 7 70 3
Non-residential activities in holiday
periods 8 17 1 13 59 2
N = 143
A series of single response items
Due to rounding, percentages may not always sum to 100
Source: NFER Key Stage 1 coordinator survey of education outside the classroom, 2006
Table 4.12
Challenges to EOtC provision in the future
Challenges: challenge Major
% Minor challenge % Not a challenge % No response % Taking responsibility for pupil safety 64 29 5 3 Recording main risks and how to manage
them 45 41 10 3
Paperwork 39 44 13 3
Cost of EOtC 73 22 3 1
Lack of appropriate teacher training 19 49 27 5 Lack of teacher understanding of the
outcomes of EOtC 9 41 44 6
Lack of senior management support for
EOtC 6 22 68 4
Lack of teacher union/association support 8 22 58 12 Lack of suitable EOtC provision 17 41 37 6 Lack of teacher support/motivation 10 30 55 4 Lack of potential in subject area 8 29 56 7 Restrictions of National Curriculum 17 30 50 3
Teacher workload 35 41 22 2
Lack of time in curriculum 24 43 27 5
Other 2 2 4 92
N = 143
A series of single response items
•
Other challenges identified included lack of staff availability (two
individuals), the cost of transport (one individual) and fear of litigation
(one individual).
Table 4.13
Changes to facilitate EOtC
Changes/actions to enable more EOtC provision %
Increased funding 50
More time/flexibility in curriculum 22
More support 18
Cheaper provision available 13 More staff available to be involved in activities 8
More staff training in EOtC 8
Improved information/ awareness of EOtC 8
Better outdoor facilities 8
Wider support for EOtC 7
Less focus on risks of EOtC 6
Less risk assessment 5
Improved staff motivation 2
Changes in school polic y 1
Compulsory EOtC 1
Improved transport 1
Quicker Criminal Records Bureau (CRB) checks 1
No changes needed 1
No response 21
N = 143
More than one answer could be put forward so percentages do not sum to 100 A total of 113 respondents gave at least one response to this question.
5.
Key Stage 2 coordinator tables
Table 5.1
Percentage of pupils in Key Stage 2 who have been offered EOtC
activities since September 2005
Percentage of pupils: %
0% 0
1 – 25 % 5
26 – 50% 3
51 – 75% 6
76 – 100% 83
No response 3
N = 144
A single response item
Due to rounding, percentages may not sum to 100
Source: NFER Key Stage 2 coordinator survey of education outside the classroom, 2006
Table 5.2
Number of EOtC activities undertaken since September 2005
Activities: 0
%
1-3 %
4-6 %
7-9 %
10 or more %
No response
% School site activities 3 17 21 12 38 10 Off-site day visits 0 14 22 18 42 5 Before/after school study support 22 23 10 6 29 10 Off-site residentials within the UK 15 74 3 0 2 6 Off-site residential experiences
overseas 84 6 0 0 1 10 Non-residential activities in holiday
periods 58 23 6 0 2 10 N =144
A series of single response items
Due to rounding, percentages may not always sum to 100
Table 5.3
Number of visits undertaken to different venues since September
2005
Venues: 0
%
1-3 %
4-6 %
7-9 %
10 or more %
No response
% Urban built environments 24 44 11 3 3 15 Urban nature (e.g. allotments,
playgrounds, scrubland, derelict sites) 39 31 10 1 3 15 Places of cultural interest (e.g. theatres) 12 63 10 3 3 9 Places of historical interest (e.g.
museums) 2 62 23 7 1 5
Community centres/places of worship 15 58 16 4 1 6 City farms 71 13 1 0 1 15 Rural farms 57 28 1 0 0 14 Field studies centres 40 47 1 0 0 12 Environmental centres 38 46 3 0 0 14 National nature reserve/Sites of Special
Scientific Interest 47 37 1 1 0 15 Forest/woodlands 40 38 4 1 1 15 Water bodies (e.g. rivers, lakes) 33 53 1 0 0 13 General countryside (e.g. country parks,
national parks, moors, mountains) 33 47 3 1 1 15 Outdoor pursuits/adventure centres 28 65 1 0 1 6 Other 29 17 6 1 0 47 N = 144
A series of single response items
Due to rounding, percentages may n ot always sum to 100
Table 5.4
Aims of EOtC
The main aims of EOtC are: %
Personal development for pupils 73
Link with outside world 52
Develop pupils’ skills 46
Develop pupils’ knowledge 29
Physical development 7
Fun 7
Accommodating different learning styles 3
Inclusion 2
Use of open space 1
No response 9
N = 144
More than one answer could be put forward so percentages do not sum to 100 A total of 132 respondents gave at least one response to this question.
Source: NFER Key Stage 2 coordinator survey of education outside the classroom, 2006
Table 5.5
Topics delivered through EOtC activities
Topics: %
History-related 71
Geography-related 56
Science-related 30
Religious education-related 21
PE/Sports 17
PSHE-related 17
Environmental studies 12
English-related 10
Art and design-related 8
All units of work 5
Maths-related 3
ICT-related 3
Music-related 3
No response 6
N = 144
More than one answer could be put forward so percentages do not sum to 100 A total of 136 respondents gave at least one response to this question.
Table 5.6
Confidence in relation to EOtC activities
Activities: Very
%
Somewhat %
Not very %
Not at all %
No response
% Preparing pupils for EOtC 69 30 1 0 0 Planning EOtC activities 65 33 3 0 0 Running EOtC activities 65 30 6 0 0 Following up EOtC activities in
class 69 28 2 0 0
Gauging the quality of EOtC
activities 48 47 5
0 0
Evaluating the impact of EOtC
activities on pupils 47 47 6 0 0 Carrying out risk management 44 47 9 0 0 N = 144
A series of single response items
Due to rounding, percentages may not always sum to 100
Source: NFER Key Stage 2 coordinator survey of education outside the classroom, 2006
Table 5.7
Satisfaction with support in relation to EOtC
Support received from… Very %
Somewhat %
Not very %
Not at all %
Not applicable
%
No response
% Local Authority 20 44 15 7 11 3
Headteacher 78 19 0 1 1 1
Senior managers 67 24 0 1 6 1 Teaching assistants 72 24 2 0 2 1 School governors 35 31 13 7 14 1 Other teachers in the school 60 35 1 0 1 1 Educational Visits
Coordinator 41 15 4 4 32 3
External providers 38 49 3 1 7 2 Teacher unions/associations 5 21 15 10 45 3
Parents 33 55 8 0 2 2
N = 144
A series of single response items
Due to rounding, percentages may not always sum to 100
Table 5.8
Training for EOtC
Training received:
Initial teacher training
%
Subsequent training
%
Not received
training %
No response
% Preparing pupils for EOtC 18 33 53 3 Planning EOtC activities 17 38 50 1 Running EOtC activities 17 36 50 4 Following up EOtC activities in class 19 22 60 3 Gauging the quality of EOtC activities 7 22 72 2 Evaluating the impact of EOtC activities on pupils 8 22 71 2 Carrying out risk management 8 61 35 1 N = 144
More than one answer could be given so percentages may not sum to 100
Source: NFER Key Stage 2 coordinator survey of education outside the classroom, 2006
Table 5.9
Changes in the amount of EOtC activity in the last five years
Activities: Increased
%
No change
%
Decreased %
Not sure
%
Not applicable
%
No response
% On school site activities 63 30 2 3 1 1 Off-site day visits 38 39 21 1 1 1 Before/after school study support 52 23 5 8 10 2 Off-site residentials within the UK 19 51 19 3 7 1 Off-site residential experiences
overseas 6 17 8 6 60 3
Non-residential activities in holiday
periods 24 19 2 11 40 3
N = 144
A series of single response items
Due to rounding, percentages may not always sum to 100
Table 5.10
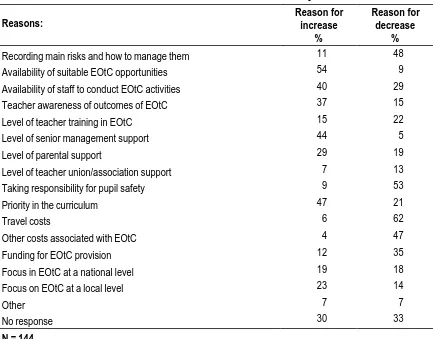
Reasons for increases and decreases in EOtC provision
Reasons: Reason for increase
%
Reason for decrease
% Recording main risks and how to manage them 11 48 Availability of suitable EOtC opportunities 54 9 Availability of staff to conduct EOtC activities 40 29 Teacher awareness of outcomes of EOtC 37 15 Level of teacher training in EOtC 15 22 Level of senior management support 44 5 Level of parental support 29 19 Level of teacher union/association support 7 13 Taking responsibility for pupil safety 9 53 Priority in the curriculum 47 21
Travel costs 6 62
Other costs associated with EOtC 4 47 Funding for EOtC provision 12 35 Focus in EOtC at a national level 19 18 Focus on EOtC at a local level 23 14
Other 7 7
No response 30 33
N = 144
More than one answer could be given so percentages may not sum to 100
A total of 101 and 97 respondents respectively answered at least one item in these two questions Source: NFER Key Stage 2 coordinator survey of education outside the classroom, 2006
•
Other reasons given for an increase in EOtC included EOtC being a
Table 5.9
Plans for EOtC provision in 2006/07
Activities: Plan to
increase % Plan to keep the same % Plan to decrease % Not sure % Not applicable % No response %
School site activities 60 36 0 2 0 2 Off-site day visits 37 54 1 4 0 4 Before/after school study support 33 41 1 11 9 4 Off-site residentials within the UK 15 72 1 5 6 2 Off-site residential experiences
overseas 3 21 1 10 60 5
Non-residential activities in holiday
periods 12 24 0 17 43 4 N = 144
A series of single response items
Due to rounding, percentages may not always sum to 100
Source: NFER Key Stage 2 coordinator survey of education outside the classroom, 2006
Table 5.10
Challenges to EOtC provision in the future
Challenges: challenge Major
% Minor challenge % Not a challenge % No response % Taking responsibility for pupil safety 76 17 4 2 Recording main risks and how to manage
them 47 47 4 2
Paperwork 54 41 3 2
Cost of EOtC 81 17 1 1
Lack of appropriate teacher training 22 58 17 3 Lack of teacher understanding of the
outcomes of EOtC 8 56 33 3
Lack of senior management support for
EOtC 3 28 65 4
Lack of teacher union/association support 9 33 53 5 Lack of suitable EOtC provision 6 41 49 3 Lack of teacher support/motivation 13 35 48 5 Lack of potential in subject area 7 37 53 3 Restrictions of National Curriculum 22 37 40 2
Teacher workload 50 37 11 2
Lack of time in curriculum 45 38 13 3
Other 2 1 1 95
N = 144
A series of single response items
•
Other challenges included the cost of transport (one individual) and lack of
senior management vision for EOtC (one individual).
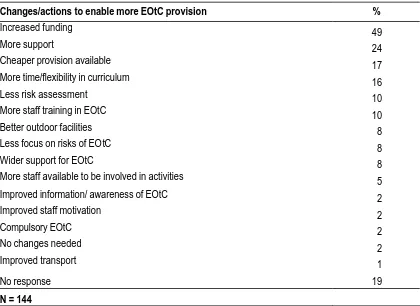
Table 5.13
Changes to facilitate EOtC in the future
Changes/actions to enable more EOtC provision %
Increased funding 49
More support 24
Cheaper provision available 17 More time/flexibility in curriculum 16
Less risk assessment 10
More staff training in EOtC 10
Better outdoor facilities 8
Less focus on risks of EOtC 8
Wider support for EOtC 8
More staff available to be involved in activities 5 Improved information/ awareness of EOtC 2
Improved staff motivation 2
Compulsory EOtC 2
No changes needed 2
Improved transport 1
No response 19
N = 144
More than o ne answer could be put forward so percentages do not sum to 100 A total of 116 respondents gave at least one response to this question.
[image:43.596.91.511.142.448.2]6.
Secondary headteacher tables
Table 6.1
EOtC activities available to pupils since September 2005
Activities: %
School site activities 98
Off-site day visits 100
Before/after school study support 96 Off-site residentials within the UK 94 Off-site residentials overseas 94 Non-residential activities in holiday periods 72
No response 0
N = 185
More than one answer could be given so percentages do not sum to 100 A total of 185 respondents answered at least one item in this question.
Source: NFER secondary headteacher survey of education outside the classroom, 2006
Table 6.2a
Planning for EOtC
Within your school is EOtC a
feature of: Yes
%
Not yet, plan to include in
future %
No, no plans for inclusion
%
Not applicable
%
No response
% The school
improvement/development plan 58 15 21 2 5 Curriculum strategy/development
plans 63 14 11 3 9
Key Stage strategy/development
plan 36 15 18 12 19
Health and Safety policies 81 4 6 2 7 The Self-Evaluation Form 83 6 5 6
Other 4 1 1 2 93
N = 185
A series of single response items
Due to rounding, percentages may not always sum to 100
Source: NFER secondary headteacher survey of education outside the classroom, 2006
Table 6.2b
Overall policy for EOtC
Does the school have an overall policy for EOtC: %
Yes 34
Not yet, plan to include in future 37
No, no plans for inclusion 29
No response 1
N = 185
A single response item
Due to rounding, percentages may not sum to 100
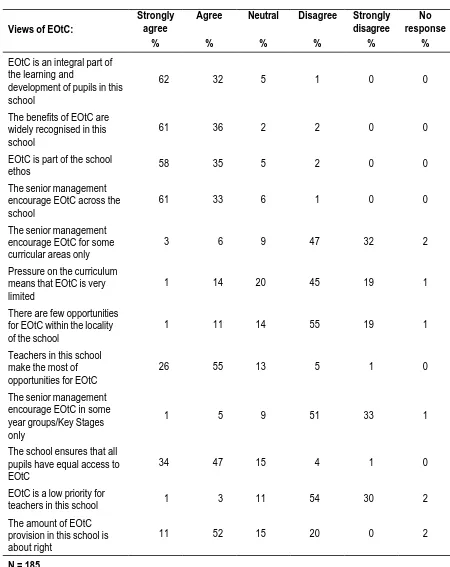
Table 6.3
Views of EOtC in the school
Views of EOtC:
Strongly agree % Agree % Neutral % Disagree % Strongly disagree % No response % EOtC is an integral part of
the learning and
development of pupils in this school
62 32 5 1 0 0
The benefits of EOtC are widely recognised in this school
61 36 2 2 0 0
EOtC is part of the school
ethos 58 35 5 2 0 0
The senior management encourage EOtC across the school
61 33 6 1 0 0
The senior management encourage EOtC for some curricular areas only
3 6 9 47 32 2
Pressure on the curriculum means that EOtC is very limited
1 14 20 45 19 1
There are few opportunities for EOtC within the locality of the school
1 11 14 55 19 1
Teachers in this school make the most of opportunities for EOtC
26 55 13 5 1 0
The senior management encourage EOtC in some year groups/Key Stages only
1 5 9 51 33 1
The school ensures that all pupils have equal access to EOtC
34 47 15 4 1 0
EOtC is a low priority for
teachers in this school 1 3 11 54 30 2 The amount of EOtC
provision in this school is about right
11 52 15 20 0 2
N = 185
A series of single response items
Due to rounding, percentages may not always sum to 100
Table 6.4
Aims of EOtC
The main aims of EOtC are: %
Personal development for pupils 74
Develop pupils’ skills 37
Link with outside world 32
Develop pupils’ knowledge 31
PSHE/ Citizenship 5
Inclusion 4
Physical development 3
Fun 2
Work-related learning 2
All areas of curriculum 2
Accommodating different learning styles 1
Other 1
No response 20
N = 185
More than one answer could be put forward so percentages do not sum to 100 A total of 148 respondents gave at least one response to this question.
Source: NFER secondary headteacher survey of education outside the classroom, 2006
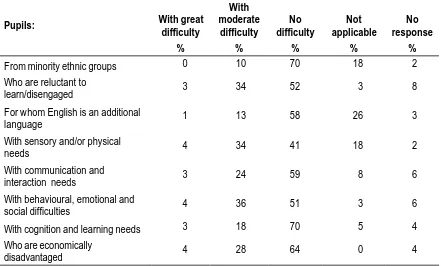
Table 6.5a
Extent to which schools are able to provide access to EOtC for
pupils
Pupils: With great difficulty
%
With moderate
difficulty %
No difficulty
%
Not applicable
%
No response
% From minority ethnic groups 0 10 70 18 2 Who are reluctant to
learn/disengaged 3 34 52 3 8 For whom English is an additional
language 1 13 58 26 3
With sensory and/or physical
needs 4 34 41 18 2
With communication and
interaction needs 3 24 59 8 6 With behavioural, emotional and
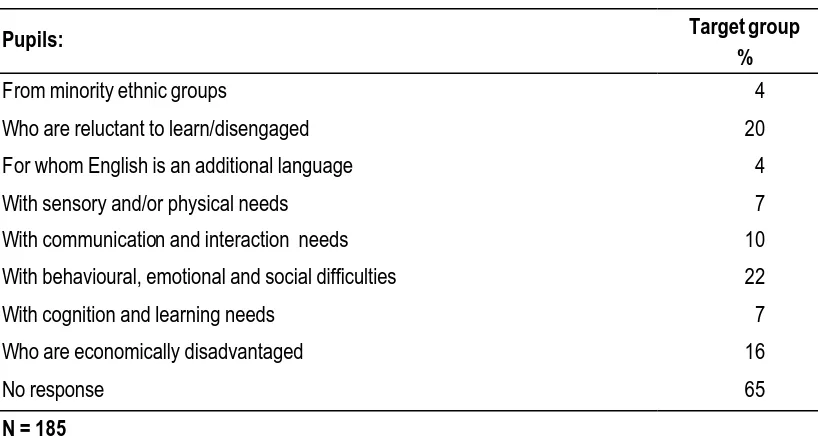
Table 6.5b
Extent to which schools target specific pupils for EOtC
Pupils: Target group
%
From minority ethnic groups 4
Who are reluctant to learn/disengaged 20 For whom English is an additional language 4 With sensory and/or physical needs 7 With communication and interaction needs 10 With behavioural, emotional and social difficulties 22 With cognition and learning needs 7 Who are economically disadvantaged 16
No response 65
N = 185
More than one answer could be given so percentages do not sum to 100 A total of 64 respondents answered at least one item in this question.
[image:48.596.95.504.88.307.2]Source: NFER secondary headteacher survey of education outside the classroom, 2006
Table 6.6
Providing access to EOtC for pupils who need extra support
The school… %
Provides funding for pupils 88 Adapts EOtC tasks/activities 56 Provides alternative activities 40 Provides funding for extra staff 60
Modifies pupil groups 45
Other 4
No response 4
N= 185
More than one answer could be given so percentages do not sum to 100 A total of 178 respondents answered at least one item in this question.
Table 6.7
Member of staff in school with responsibility for coordinating
EOtC
Member of staff %
Headteacher 4
Assistant or deputy head 51
Department/faculty/Key Stage head 7
Subject teacher 4
Another member of staff 19
Responsibility is left to individual teachers 7
No response 8
N= 185
A single response item
Due to rounding, percentages may not sum to 100
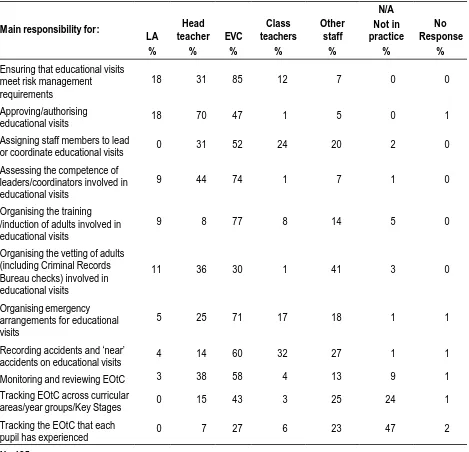
Table 6.8
Responsibility for organising and monitoring EOtC activities
Main responsibility for:
LA %
Head teacher
%
EVC %
Class teachers
%
Other staff
%
N/A Not in practice
%
No Response
% Ensuring that educational visits
meet risk management requirements
18 31 85 12 7 0 0
Approving/authorising
educational visits 18 70 47 1 5 0 1 Assigning staff members to lead
or coordinate educational visits 0 31 52 24 20 2 0 Assessing the competence of
leaders/coordinators involved in educational visits
9 44 74 1 7 1 0
Organising the training /induction of adults involved in educational visits
9 8 77 8 14 5 0
Organising the vetting of adults (including Criminal Records Bureau checks) involved in educational visits
11 36 30 1 41 3 0
Organising emergency arrangements for educational visits
5 25 71 17 18 1 1
Recording accidents and ‘near’
accidents on educational visits 4 14 60 32 27 1 1 Monitoring and reviewing EOtC 3 38 58 4 13 9 1 Tracking EOtC across curricular
areas/year groups/Key Stages 0 15 43 3 25 24 1 Tracking the EOtC that each
pupil has experienced 0 7 27 6 23 47 2 N= 185
A series of single response items
Due to rounding, percentages may not always sum to 100
Table 6.9
Staffing for EOtC since September 2005
Activities: Teachers who volunteer
%
Teachers in the relevant curriculum
area %
Teachers of the relevant age group
of pupils %
Teachers with particular experience/
skills %
Other adults
%
No response
% School site activities 41 86 44 51 30 3 Off-site day visits 49 86 47 55 32 1 Before/after school
study support 45 45 18 35 32 6 Off-site residentials
within the UK 65 62 32 57 23 5 Off-site residentials
overseas 67 60 26 56 21 8
Non-residential activities in holiday periods
57 40 17 35 25 16
N = 185
A series of single response items
Due to rounding, percentages may not always sum to 100
Source: NFER secondary headteacher survey of education outside the classroom, 2006
•
Other adults involved in staffing activities included parents, sports
coaches, specialist staff, Connexions Personal Advisers and youth
workers.
Table 6.10
Support for staff involved in organising and planning EOtC
Support available: %
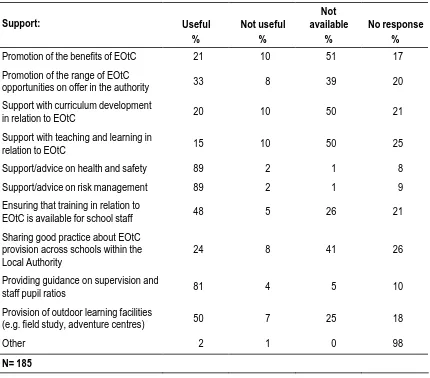
Table 6.11a Support received from Local Authority in relation to EOtC
Support: Useful
%
Not useful %
Not available
%
No response % Promotion of the benefits of EOtC 21 10 51 17 Promotion of the range of EOtC
opportunities on offer in the authority 33 8 39 20 Support with curriculum development
in relation