1
University of Southern Queensland
Faculty of Engineering and Surveying
A Preliminary Analysis of the
Effectiveness of the New QLD GDL
Program
A dissertation submitted by
Neil William Randall
In fulfilment of the requirements of
Courses ENG4111 and 4112 Research Project
Towards the degree of
Bachelor of Civil Engineering
Submitted: October 2011
Prepared by Neil Randall
University Supervisor Soma Kathirgamalingam
2
Abstract
Globally traffic accidents are the leading cause of death for young people aged 15 to 19 years. More than 40% of all road traffic deaths occur among people aged 0 – 25 years, (WHO, 2007; WHO, 2006).
Australia is not immune to this epidemic. In 2007 nearly a quarter of all individuals killed in Australian road accidents where aged between 17 and 25 years, (Albanese A, 2008).
The current literature identifies many reasons for why young drivers are so overrepresented in accident statistics. These reasons are termed ‘risk factors’ with the majority of research identifying the following risk factors:
• Inexperience.
• Less developed visual perception and cognitive skills. • Deliberate risk taking.
• Inability to identify risks or hazards. • Overconfidence.
• Inattention / Distraction.
• Tendency to drive at high risk times. • Alcohol or Drugs.
• Choice of vehicle.
Many programs have been implemented to address these risk factors, resulting in varying levels of success. However one particular strategy, aimed specifically at young novice drivers, has produced significant results internationally. This strategy is graduated drivers licensing. Graduated Drivers Licence (GDL) programs differ from jurisdiction to jurisdiction however they all adhere to a fundamental philosophy of providing a step wise approach to full licensing. In their most basic form GDL programs generally involve a three stage licensing system
consisting of an extended learner’s period, an intermediate licence stage and a full licence. GDL licence holders are required to not only adhere to all standard traffic and licensing regulations but also have special restrictions and criteria that specifically apply to the stage of licensing the novice driver has achieved.
In July 2007 the Queensland Government implemented a new GDL program aimed at reducing the overrepresentation of young drivers in road accident statistics for the State of Queensland. The preliminary data available at the time of writing this paper indicates the new GDL program has had some success in reducing hospitalisation crashes for young novice drivers however there is little evidence to suggest the new GDL program has been solely responsible for any reduction in fatal crashes for young novice drivers.
Additionally the available data indicates the new GDL program has had little to no impact on addressing crashes attributed to alcohol and therefore it is recommended that further
3
Disclaimer
University of Southern Queensland Faculty of Engineering and Surveying
ENG 4111 & ENG 4112 Research Project
Limitations of Use
The Council of the University of Southern Queensland, its Faculty of Engineering and Surveying, and the staff of the University of Southern Queensland, do not accept any
responsibility for the truth, accuracy or completeness of material contained within or associated with this dissertation.
Persons using all or any part of this material do so at their own risk, and not at the risk of the Council of the University of Southern Queensland, its Faculty of Engineering and Surveying or the staff of the University of Southern Queensland.
This dissertation reports an educational exercise and has no purpose or validity beyond this exercise. The sole purpose of the course pair entitled ‘Research Project’ is to contribute to the overall education within the student’s chosen degree program. This document, the associated hardware, software, drawings, and other material set out in the associated appendices should not be used for any purpose: if they are so used, it is entirely at the risk of the user.
Prof Frank Bullen
Dean
4
Candidates Certification
I certify that the ideas, designs and experimental work, results, analysis and conclusions set out in this dissertation are entirely my own efforts, except where otherwise indicated and
acknowledged.
I further certify that the work is original and has not been previously submitted for assessment in any other course or institution, except where specifically stated.
Name: Neil Randall
Student Number: 0050075615
_______________________________________ Signature _______________________________________
5
Acknowledgements
This research was carried out under the principal supervision of Soma Kathirgamalingam. The author also wishes to thank staff from the Maroochydore Office of the Queensland Department of Transport and Main Roads for their support and access to the ‘Road Crash 2’ data used within this analysis.
6
Contents
Abstract ... 2
Disclaimer ... 3
Candidates Certification ... 4
Acknowledgements ... 5
List of Figures ... 8
List of Graphs ... 8
List of Tables ... 12
Nomenclature and Acronyms (or Abbreviations) ... 13
1 Chapter 1: Introduction ... 14
1.1 Outline of the study ... 14
1.2 Introduction ... 14
1.3 The Problem ... 16
1.4 Research Objectives ... 17
1.5 Conclusions ... 17
2 Chapter 2: Literature Review ... 18
2.1 Introduction ... 18
2.2 Risk Factors ... 18
2.2.1 Inexperience ... 18
2.2.2 Less Developed Visual Perception and Cognitive Skills ... 19
2.2.3 Deliberate risk taking ... 20
2.2.4 Inability to identify risk or hazards... 21
2.2.5 Overconfidence ... 21
2.2.6 Inattention / Distraction ... 21
2.2.7 Tendency to drive at high risk times (e.g. at night with a number of young passengers) ... 22
2.2.8 Alcohol or drugs ... 23
2.2.9 Choice of Vehicle ... 24
2.3 Graduated Drivers Licence (GDL) ... 24
2.3.1 Arguments surrounding GDL components ... 25
2.3.2 Success of GDL Programs around the World ... 28
2.3.3 Graduated Licence Schemes Operating in Other Australian States and Territories .... 30
2.3.4 Queensland’s Graduated Drivers Licence Program ... 36
2.4 Conclusions ... 37
3 Chapter 3: Methodology... 38
4 Chapter 4: Data Analysis ... 40
4.1 Risk Factor: Inexperience ... 40
7
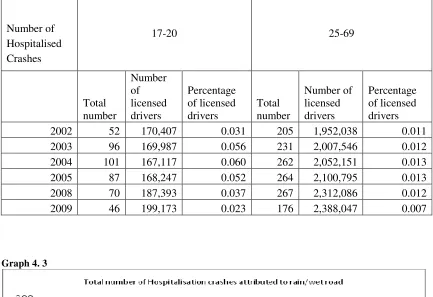
4.1.2 Contributing Circumstance: Inexperience ... 44
4.1.3 Discussion for Risk Factor: Inexperience ... 47
4.2 Risk Factor: Less Developed Visual Perception and Cognitive Skills ... 49
4.2.1 Contributing Circumstance: Age (Lack of Perception) ... 49
4.2.2 Contributing Circumstance: Failure to Give-way or Stop ... 52
4.2.3 Discussion for Risk Factor: Less Developed Visual Perception and Cognitive Skills 55 4.3 Risk Factor: Deliberate Risk Taking... 57
4.3.1 Contributing Circumstance: Speed Related ... 57
4.3.2 Contributing Circumstance: Negligence ... 60
4.3.3 Discussion for Risk Factor: Deliberate Risk Taking ... 63
4.4 Risk Factor: Inability to Identify Risks or Hazards ... 65
4.4.1 Contributing Circumstance: Illegal Traffic Manoeuvre ... 65
4.4.2 Contributing Circumstance: Undue Care and Attention ... 68
4.4.3 Discussion for Risk Factor: Inability to Identify Risks or Hazards ... 71
4.5 Risk Factor: Overconfidence ... 73
4.5.1 Contributing Circumstance: Dangerous Driving ... 73
4.5.2 Discussion for Risk Factor: Overconfidence ... 76
4.6 Risk Factor: Inattention / Distraction ... 78
4.6.1 Contributing Circumstance: Inattention ... 78
4.6.2 Contributing Circumstance: Distraction ... 81
4.6.3 Discussion for Risk Factor: Inattention / Distraction ... 84
4.7 Risk factor: Tendency to Drive at High Risk Times ... 86
4.7.1 Contributing Circumstance: Crashes between the hours of 6pm and 6am ... 86
4.7.2 Discussion for Risk Factor: Tendency to Drive at High Risk Times ... 88
4.8 Risk Factor: Alcohol or Drugs ... 89
4.8.1 Contributing Circumstance: Alcohol Related ... 89
4.8.2 Contributing Circumstance: Drug Related ... 92
4.8.3 Discussion for Risk Factor: Alcohol or Drugs ... 94
4.9 Total Crashes ... 97
4.9.1 Fatal Crashes ... 97
5 Chapter 5: Conclusions ... 100
5.1 Introduction ... 100
5.2 Conclusions ... 100
5.3 Further Research and Recommendations ... 102
6 References ... 104
7 Appendix A: Queensland Drivers Licence Holders 2004-2010 ... 109
8
List of Figures
Number Page Title
Figure 1 19 Learner, provisional and open licence casualty crashes
List of Graphs
Number Page Title
Graph 1 16 Road safety initiatives and their affect on fatalities and hospitalisation
Graph 4.1 41 Total number fatal crashes attributed to rain/wet roads Graph 4.2 41 Fatal crashes attributed to rain / wet road as a percentage of
licensed drivers
Graph 4.3 42 Total number of hospitalisation crashes attributed to rain / wet roads
Graph 4.4 43 Hospitalisation crashes attributed to rain / wet road as a percentage of licensed drivers
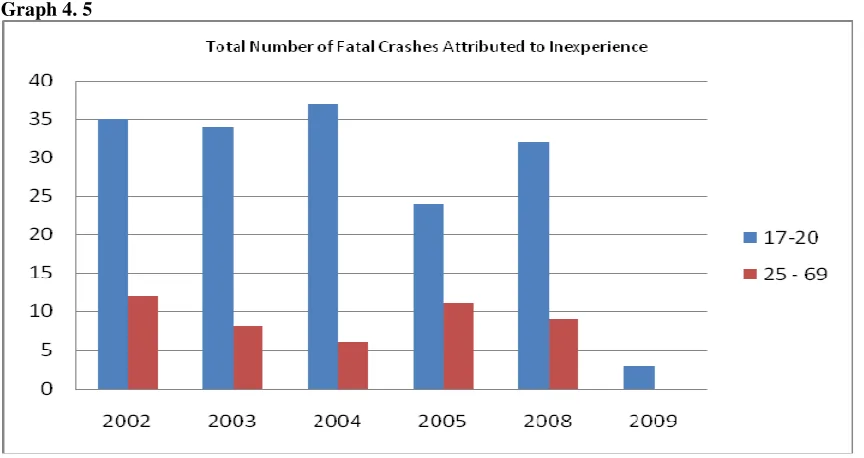
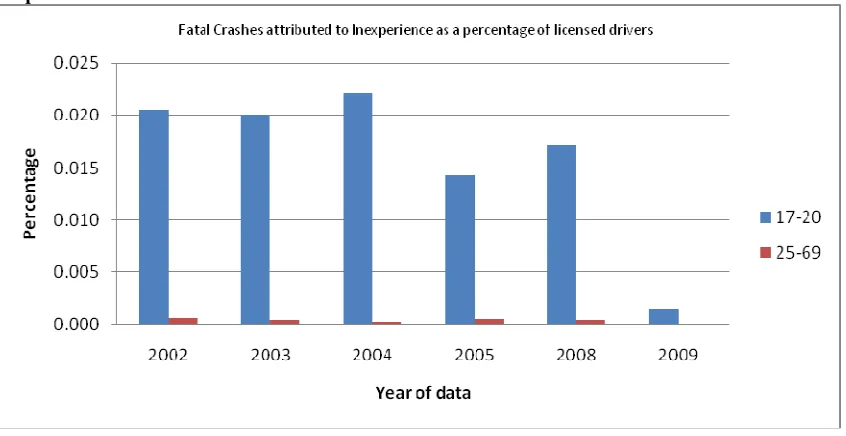
Graph 4.5 44 Total number of fatal accidents attributed to inexperience Graph 4.6 45 Fatal crashes attributed to inexperience as a percentage of
licensed drivers
Graph 4.7 46 Total number of hospitalised crashes attributed to inexperience
Graph 4.8 47 Hospitalisation crashes attributed to inexperience as a percentage of licensed drivers
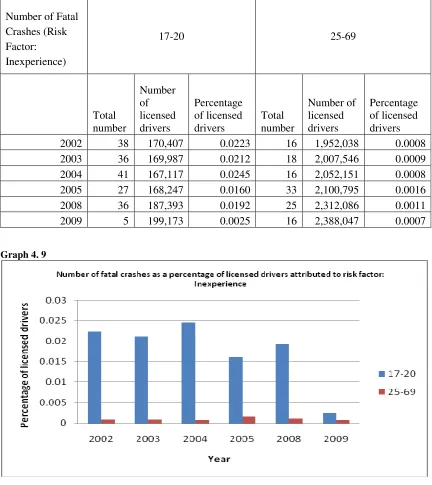
Graph 4.9 47 Fatal crashes attributed to the risk factor ‘Inexperience’ as a percentage of licensed drivers
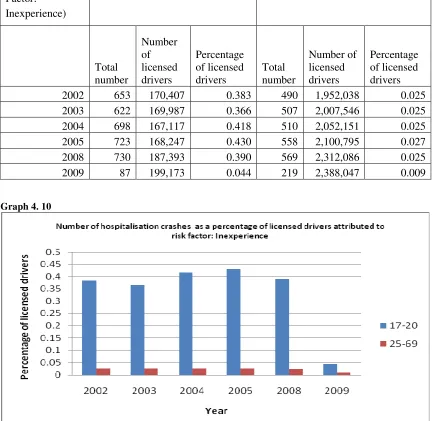
Graph 4.10 48 Hospitalisation crashes attributed to the risk factor ‘Inexperience’ as a percentage of licensed drivers Graph 4.11 49 Total number of fatal crashes attributed to age (lack of
perception)
Graph 4.12 50 Fatal crashes attributed to age (lack of perception) as a percentage of licensed drivers
Graph 4.13 51 Total number of hospitalisation crashes attributed to age (lack of perception)
Graph 4.14 51 Hospitalisation crashes attributed to age (lack of perception) as a percentage of licensed drivers
9
Graph 4.16 53 Fatal crashes attributed to fail to give way /stop as a percentage of licensed drivers
Graph 4.17 54 Total number of hospitalisation crashes attributed to fail to give way /stop
Graph 4.18 54 Hospitalisation crashes attributed to fail to give way /stopas a percentage of licensed drivers
Graph 4.19 56 Fatal crashes attributed to the risk factor ‘less developed visual perception and cognitive skills’ as a percentage of licensed drivers
Graph 4.20 57 Hospitalisation crashes attributed to the risk factor ‘less developed visual perception and cognitive skills’ as a percentage of licensed drivers
Graph 4.21 58 Total number of fatal crashes attributed to speed related Graph 4.22 58 Fatal crashes attributed to speed related as a percentage of
licensed drivers
Graph 4.23 59 Total number of hospitalisation crashes attributed to speed related
Graph 4.24 59 Hospitalisation crashes attributed to speed related as a percentage of licensed drivers
Graph 4.25 61 Total number of fatal crashes attributed to negligence Graph 4.26 61 Fatal crashes attributed to negligence as a percentage of
licensed drivers
Graph 4.27 62 Total number of hospitalisation crashes attributed to negligence
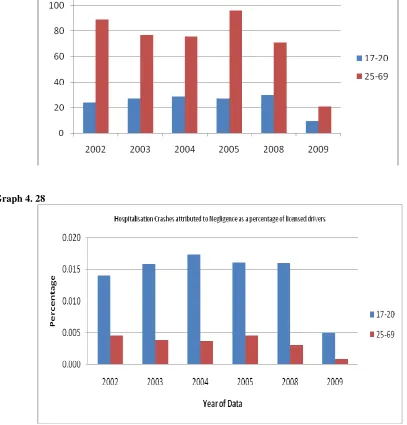
Graph 4.28 62 Hospitalisation crashes attributed to negligence as a percentage of licensed drivers
Graph 4.29 63 Fatal crashes attributed to the risk factor ‘deliberate risk taking’ as a percentage of licensed drivers
Graph 4.30 64 Hospitalisation crashes attributed to the risk factor ‘deliberate risk taking’ as a percentage of licensed drivers
Graph 4.31 65 Total number of fatal crashes attributed to illegal traffic manoeuvre
Graph 4.32 66 Fatal crashes attributed to illegal traffic manoeuvre as a percentage of licensed drivers
Graph 4.33 67 Total number of hospitalisation crashes attributed to illegal traffic manoeuvre
10
Graph 4.35 68 Total number of fatal crashes attributed to undue care and attention
Graph 4.36 69 Fatal crashes attributed to undue care and attention as a percentage of licensed drivers
Graph 4.37 70 Total number of hospitalisation crashes attributed to undue care and attention
Graph 4.38 70 Hospitalisation crashes attributed to undue care and attention as a percentage of licensed drivers
Graph 4.39 72 Fatal crashes attributed to the risk factor ‘inability to identify risks or hazards’ as a percentage of licensed drivers
Graph 4.40 73 Hospitalisation crashes attributed to the risk factor ‘inability to identify risks or hazards’ as a percentage of licensed drivers Graph 4.41 74 Total number of fatal crashes attributed to dangerous driving Graph 4.42 74 Fatal crashes attributed to dangerous driving as a percentage
of licensed drivers
Graph 4.43 75 Total number of hospitalisation crashes attributed to dangerous driving
Graph 4.44 75 Hospitalisation crashes attributed to dangerous driving as a percentage of licensed drivers
Graph 4.45 77 Fatal crashes attributed to the risk factor ‘Overconfidence’ as a percentage of licensed drivers
Graph 4.46 78 Hospitalisation crashes attributed to the risk factor
. ‘Overconfidence’ as a percentage of licensed drivers
Graph 4.47 79 Total number of fatal crashes attributed to inattention Graph 4.48 79 Fatal crashes attributed to inattention as a percentage of
licensed drivers
Graph 4.49 80 Total number of hospitalisation crashes attributed to inattention
Graph 4.50 80 Hospitalisation crashes attributed to inattention as a percentage of licensed drivers
Graph 4.51 82 Total number of fatal crashes attributed to distraction Graph 4.52 82 Fatal crashes attributed to distraction as a percentage of
licensed drivers
Graph 4.53 83 Total number of hospitalisation crashes attributed to distraction
Graph 4.54 83 Hospitalisation crashes attributed to distraction as a percentage of licensed drivers
11
Graph 4.56 85 Hospitalisation crashes attributed to the risk factor ‘Inattention / distraction’ as a percentage of licensed drivers
Graph 4.57 86 Total number of fatal crashes occurring between 6pm and 6am Graph 4.58 87 Fatal crashes occurring between the hours of 6pm and 6am as
. a percentage of licensed drivers
Graph 4.59 87 Total number of hospitalisation crashes occurring between 6pm and 6am
Graph 4.60 88 Hospitalisation crashes occurring between 6pm and 6am as a
. percentage of licensed drivers
Graph 4.61 89 Total number of fatal crashes attributed to alcohol
Graph 4.62 90 Fatal crashes attributed to alcohol as a percentage of licensed drivers
Graph 4.63 91 Total number of hospitalisation crashes attributed to alcohol Graph 4.64 91 Hospitalisation crashes attributed to alcohol as a percentage of
licensed drivers
Graph 4.65 93 Fatal crashes attributed to drugs as a percentage of licensed drivers
Graph 4.66 94 Hospitalisation crashes attributed to drugs as a percentage of licensed drivers
Graph 4.67 95 Fatal crashes attributed to the risk factor ‘Alcohol or drugs’ as a percentage of licensed drivers
Graph 4.68 96 Hospitalisation crashes attributed to the risk factor ‘Alcohol or drugs’ as a percentage of licensed drivers
Graph 4.69 97 Total number of fatal crashes recorded in the years under analysis
Graph 4.70 98 Total fatal crashes as a percentage of licensed drivers
recorded in the years under analysis
Graph 4.71 99 Total number of hospitalisation crashes recorded in the years under analysis
Graph 4.72 99 Total hospitalisation crashes as a percentage of licensed drivers recorded in the years under analysis
12
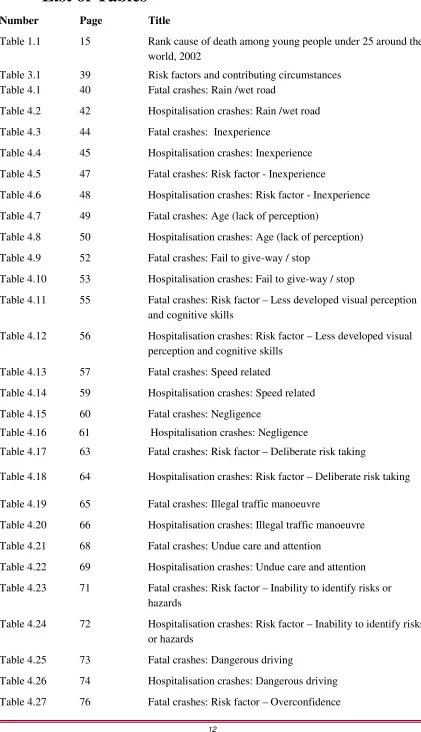
List of Tables
[image:12.595.114.535.72.804.2]Number Page Title
Table 1.1 15 Rank cause of death among young people under 25 around the world, 2002
Table 3.1 39 Risk factors and contributing circumstances Table 4.1 40 Fatal crashes: Rain /wet road
Table 4.2 42 Hospitalisation crashes: Rain /wet road Table 4.3 44 Fatal crashes: Inexperience
Table 4.4 45 Hospitalisation crashes: Inexperience Table 4.5 47 Fatal crashes: Risk factor - Inexperience
Table 4.6 48 Hospitalisation crashes: Risk factor - Inexperience Table 4.7 49 Fatal crashes: Age (lack of perception)
Table 4.8 50 Hospitalisation crashes: Age (lack of perception) Table 4.9 52 Fatal crashes: Fail to give-way / stop
Table 4.10 53 Hospitalisation crashes: Fail to give-way / stop
Table 4.11 55 Fatal crashes: Risk factor – Less developed visual perception and cognitive skills
Table 4.12 56 Hospitalisation crashes: Risk factor – Less developed visual perception and cognitive skills
Table 4.13 57 Fatal crashes: Speed related
Table 4.14 59 Hospitalisation crashes: Speed related Table 4.15 60 Fatal crashes: Negligence
Table 4.16 61 Hospitalisation crashes: Negligence
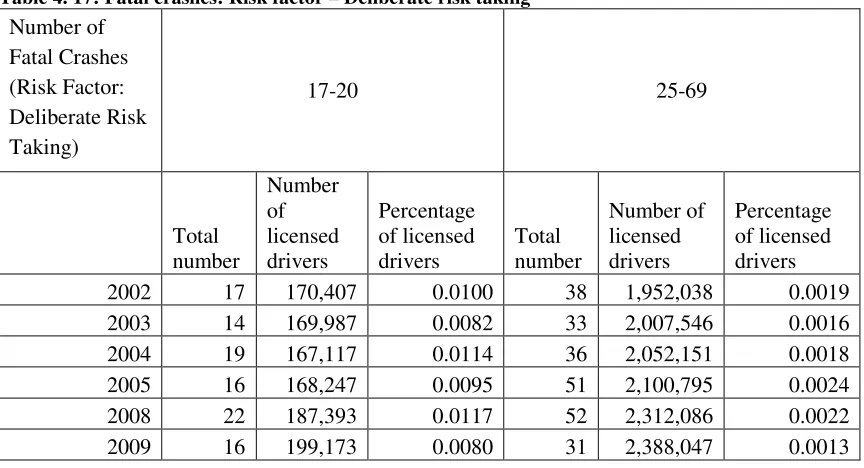
Table 4.17 63 Fatal crashes: Risk factor – Deliberate risk taking
Table 4.18 64 Hospitalisation crashes: Risk factor – Deliberate risk taking Table 4.19 65 Fatal crashes: Illegal traffic manoeuvre
Table 4.20 66 Hospitalisation crashes: Illegal traffic manoeuvre Table 4.21 68 Fatal crashes: Undue care and attention
Table 4.22 69 Hospitalisation crashes: Undue care and attention Table 4.23 71 Fatal crashes: Risk factor – Inability to identify risks or
hazards
Table 4.24 72 Hospitalisation crashes: Risk factor – Inability to identify risks or hazards
Table 4.25 73 Fatal crashes: Dangerous driving
13
Table 4.28 77 Hospitalisation crashes: Risk factor – Overconfidence Table 4.29 78 Fatal crashes: Inattention
Table 4.30 80 Hospitalisation crashes: Inattention Table 4.31 81 Fatal crashes: Distraction
Table 4.32 82 Hospitalisation crashes: Distraction
Table 4.33 84 Fatal crashes: Risk factor – Inattention / distraction
Table 4.34 85 Hospitalisation crashes: Risk factor – Inattention / distraction Table 4.35 86 Fatal crashes: between the hours of 6pm and 6am
Table 4.36 87 Hospitalisation crashes: between the hours of 6am and 6pm Table 4.37 89 Fatal crashes: Alcohol related
Table 4.38 91 Hospitalisation crashes: Alcohol related Table 4.39 92 Fatal crashes: Drug related
Table 4.40 93 Hospitalisation crashes: Drug related
Table 4.41 94 Fatal crashes: Risk factor – Alcohol or drugs
Table 4.42 95 Hospitalisation crashes: Risk factor – Alcohol or drugs Table 4.43 97 Total number of fatal crashes
Table 4.44 98 Total number of hospitalisation crashes
Nomenclature and Acronyms (or Abbreviations)
The following Abbreviations have been used throughout the text and Bibliography:- GDL Graduated Drivers Licence
14
1
Chapter 1: Introduction
1.1
Outline of the study
In July 2007 the Queensland Government introduced a new Graduated Drivers Licence (GDL) program. The program increased the time frames and requirements for learner drivers and imposed new requirements and restrictions for provisional drivers.
The purpose of these new licensing components was to improve young driver safety, skill and road awareness, with the aim of reducing the number of crashes involving young novice drivers.
1.2
Introduction
Of all the systems that people interact with on a daily basis, road transport is arguably one of the most complex and dangerous. Globally, deaths resulting from traffic crashes each year have been estimated at 1.2 million, while injuries have been estimated as high as 50 million (WHO, 2004). By 2020, it is estimated that road traffic injuries will account for 2.3 million deaths globally (Norton et al 2001).
Along with the personal distress to families of road traffic victims there is also an economic cost. The World Health Organisation (WHO) (2004) estimate the economic cost for low income countries to be 1% of gross national product (GNP), 1.5% of middle income countries and 2% in higher income countries. The direct economic cost of road crashes globally has been estimated at US$518 billion annually (WHO, 2004).
These figures are staggering but amazingly the epidemic that is traffic injury does not seem to receive the same media attention as other catastrophes around the world and hence the significance of programs designed to curtail the traffic crash epidemic are often overlooked. Those programs that are implemented are often highly politicised, with everyone having an opinion of how ‘the problem’ can be quickly fixed (WHO, 2004). Evidence indicates though, that effective programs are those based on data and objective information, not anecdotal evidence. Unfortunately there is no quick fix.
Traffic crashes result from a plethora of issues ranging from poor road design, poor vehicle design, human error, speed, alcohol, fatigue, inattention, etc. All ages are impacted upon by the epidemic of road crashes however the WHO has identified one high risk group in particular. That group is young road users.
15
Table 1. 1: Rank cause or death among young people under 25 around the world, 2002
Source: Who 2007 Youth and Road Safety page 10
This is not just a developing world problem. Chisholm and Naci (2008) identified that the age distribution for fatalities and non-fatal injuries from road crashes does not greatly differ among countries. In the European Union one in every three people killed on the road is younger than 25 years with the risk of being involved in a light or serious crash being five times higher for learner drivers than for experienced drivers (WHO, 2000).
Australia is not immune to this epidemic. The Australian road toll for 2007 was 1616 people, costing the Australian economy approximately $18 billion dollars (Albanese A, 2008). The Queensland Department of Transport (2003) estimated the cost of road accidents for
16
Source: Department of Transport 2003, ‘Queensland Road Safety Strategy 2004-2011: Safe4life, page 2
Like the rest of the world young drivers represent a high proportion of these deaths and injuries. In 2007 nearly a quarter of all individuals killed in Australian road crashes were aged between 17 and 25, (Albanese A, 2008).
In Queensland, road users aged between 17 and 24 years accounted for 28% of the 2004 road toll however 17 to 24 year olds represented only 12% of Queensland’s 2004 population, (Department of Transport and Main Roads, 2009a). These figures indicate that in 2004 the road fatality rate for 17 to 24 year olds was three times the fatality rate for the entire Queensland population.
This trend is also evident in other Australian states. The Transport Accident Commission of Victoria cited in Vassallo et al (2007) reported that over a quarter (28%) of those killed in traffic crashes in the state of Victoria in 2002 were aged between 18 and 25 years, despite the fact that drivers in this range accounted for only 14% of all licensed drivers. Tay (2005) expands on this stating that of all road fatalities recorded in Victoria in 2002, 22.6% were males aged between 16 and 25.
The question is then, why are young drivers so at risk of road traffic injury and death?
1.3
The Problem
Despite the efforts of many well intentioned advertising campaigns, educational programs and governments, young drivers continue to be over represented in traffic crashes.
In July 2007 the Queensland government implemented several changes to its GDL program with the aim of addressing young driver crash rates. This study aims to determine the
17
1.4
Research Objectives
This study aims to address the following objectives:
• Identify the risk factors that cause young drivers to be so overrepresented in accident
statistics.
• Determine the GDL programs impact on addressing fatal and hospitalisation crashes
attributed to each identified risk factor.
• Determine the overall impact that the new GDL program has had on addressing fatal
and hospitalisation traffic crashes for young drivers in Queensland.
• Identify if there are any risk factors where the new GDL program has had no effect,
thereby exposing potential weaknesses of the GDL program.
To achieve the above objectives this study contains a literature review identifying the risk factors that have been attributed to be the cause for the overrepresentation of young novice drivers in traffic crashes.
A ‘before and after study with comparison group’ of young novice drivers aged 17-20 years has then been conducted to determine the impact the new GDL program has had on addressing the identified risk factors for young Queensland drivers.
Crash data attributed to identified contributing circumstances has been collated from before the implementation of the new GDL program and then after the implementation of the new GDL program to determine the effects this program has had on addressing fatal and hospitalisation crashes.
A control group of drivers aged 25 – 69 years has also be analysed to establish if any external events may have impacted on the young novice driver data.
This research methodology adheres to World Health Organisation (2010) and to the Institute of Transportation Engineers (2009) recommendations for conducting an impact and outcome evaluation of road safety programs.
The analysis has utilised the Department of Transport and Main Roads crash data base, (Web Crash2). This data base identifies contributing circumstances determined as the predominant cause for the recorded road crashes.
These contributing circumstances have been linked to identified young driver risk factors and an analysis of the crash data has been conducted to determine if there has been a reduction in the number of recorded traffic crashes.
1.5
Conclusions
This study aims to identify the preliminary achievements of the Queensland GDL program at addressing young driver fatal and hospitalisation crash rates.
The review of literature for this research has identified young driver risk factors, components of GDL programs, successes of GDL programs from other jurisdictions, and highlighted the components of GDL programs operating in all states and territories of Australia with particular focus on Queensland.
18
2
Chapter 2: Literature Review
2.1
Introduction
This chapter will review literature to identify the risk factors that have been attributed to be the cause for the overrepresentation of young novice drivers in traffic crashes.
Additionally this chapter identifies GDL as a program that has been successfully implemented in many jurisdictions to reduce the crash rates involving young novice drivers.
After doing this, the chapter will identify the components of GDL programs operating in all States and Territories of Australia with particular emphasis on the new Queensland GDL program.
2.2
Risk Factors
Many factors have been attributed to the cause of young driver crashes. However the majority of research indicates inexperience, deliberate risk taking, less developed visual and perception skills, inability to identify risks and hazards, overconfidence, inattention, driving at high risk times, alcohol and drugs, and choice of vehicle as the significant factors bringing about the high rates of young driver crashes and impacting on the severity of injuries that result from these crashes.
The following paragraphs aim to highlight research justifying why each factor has been identified as a contributing aspect for young driver crash rates.
2.2.1
Inexperience
Driving experience is developed through actual driving in the road environment. Consequently new drivers, who have had less exposure to the road environment, have less experience. This lack of experience, according to the California Office of Traffic Safety, results in 16 year old drivers (the age of provisional drivers in California) being 20 times more likely to be killed in a crash than an adult (Opiela, Sant and Childers 2006).
The Queensland Department of Main Roads (2004) supports this view implying that younger drivers, due to inexperience, exhibit slower reaction times with regards to the driving
environment. The department continues, identifying young drivers as possessing less well-developed skills and suggesting young drivers do not find it easy to select the appropriate driving behaviour when confronted by various situations. The department argues that young drivers can often suffer from information overload leading to some information being ignored. These statements are supported by data presented by the Travel Safe Committee in the
Commission for Children and Young People and Child Guardian 2006 response to Queensland youth: on the road and in control. This data identifies that inexperience was a factor in 70% of all crashes involving 17 to 19 year old drivers from 1996 to 2001.
McKnight and McKnight (2003) argue that research has shown accident rates vary both with experience and maturity however they believe that experience plays the stronger role in preventing crashes for young drivers. An extensive analysis of vehicle crash rates by age and years of driving experience in the UK, conducted by Maycock et al, cited in McKnight and McKnight (2003), revealed that the likelihood of a crash reduced by an average of 30% after the first year of licensed driving.
19 Source: Department of Transport 2005 page 2
2.2.2
Less Developed Visual Perception and Cognitive Skills
According to the Department of Main Roads (2004), young drivers tend to focus on the immediate task at hand. They do not scan the visual field efficiently and consequently make poor use of peripheral vision. Lee’s (2007) research also indicates that the visual search skills of young drivers, at identifying hazards, is less effective than experienced drivers.
McKnight and McKnight (2003) support this. They showed younger less experienced drivers have a significantly greater proportion of their crashes due to lack of visual search prior to left turns (for Australia this correlates to right turns), not watching the car ahead as well as driving too fast for conditions and a failure to adjust to wet roads. A similar conclusion was also reached by Clark, Ward and Jones (1998) who found in a British study that young drivers were more than three times more likely to be involved in right turn crashes.
Lee (2007) states that inexperienced drivers took an average of 250msec longer to respond to peripheral targets/hazards. He suggests that young drivers have not automated many driving skills and lack the spare ‘attentional capacity’ that enables experienced drivers to respond quickly to peripheral targets. He identifies ‘spare attentional capacity’ as the difference between cognitive resources demanded by the task and the resources available to invest in the task. The Department of Main Roads (2004) also state ‘many young drivers have under developed cognitive and perceptual skills.’
This view is supported by Whissell and Bigelow (2003) who argue that young drivers tend to be cognitively less mature in their general decision-making abilities. They further claim that car crashes involving young drivers are positively correlated with decisional driving error.
Ferguson, cited in Prato et al (2010), also identifies cognitive aspects, such as a lower ability to assess driving hazards and a higher tendency to perceive a crash risk as low, as reasons to explain the over representation of young drivers in road crashes.
20
2.2.3
Deliberate risk taking
Sabey and Tayloy, cited in Ulleberg and Rundmo (2003), concluded from a study of 2041 traffic crashes that human factors contributed to 95% of all crashes. In particular they identified driving behaviour as the most central of these risk factors.
Travelling at inappropriate speeds is one form of risky driving behaviour. It refers not just to exceeding the speed limit but also to travelling too fast for the conditions. Excessive speed for the road conditions is considered one of the most common contributors to road crashes,
regardless of age (Machin & Sankey 2008). Chisholm and Naci (2008) report that exceeding the speed limit is probably the most common form of traffic violation and contributes significantly to the overall road toll in all regions of the world. Finch et al, cited in Giles (2004) found that one-third of road deaths could be attributed to speeding.
Gonzales et al cited in Chen et al (2010) identify excessive speed as a major contributing factor for young driver crashes and a survey conducted by Vassallo et al (2007) on young Australian drivers’ behaviour reported 80% of participants had driven at speeds exceeding the posted limit by at least 10km/h during their past 10 trips. However, WHO (2009) report that a 5% increase in average speed leads to a 20% increase in mortality. Coupled with speeding is evidence
indicating that teenage drivers and passengers use seat belts less often than older drivers, increasing the risks associated with speed (Ferguson 2003).
A survey conducted by Tay et al cited in Tay (2005) found many young drivers in Australia believe that they were able to avoid detection for speeding by being more vigilant and looking out for speed radars. Tay also reports that speeding among young drivers was considered socially acceptable if the driver could safely do so. Stead et al cited in Machin and Sankey (2008) suggest that speeding does not suffer from the same stigma as drink driving and is therefore accepted by the majority of drivers. Clarke et al cited in Machin & Sankey (2008) indentified speeding as the most common driving offence for young drivers.
Perceptions recorded by Tay (2005) indicate that many Australian drivers believe anti-speed enforcement is implemented more for the purpose of revenue raising instead of road safety and that these attitudes were especially prevalent among young male drivers.
Aggressive driving has also been implicated as a major factor for risky driving. Ulleberg and Rundmo (2003) report that attitudes towards traffic safety have been found to correlate with aggressive driving behaviours. Aggressive driving manifests itself in many forms ranging from outright road rage to driving at inappropriate speeds. Behaviours like tailgating fall into this realm.
Arnett, cited in the Department of Transport and Main Roads (2009c), suggest that being young and aggressive and taking more risks should not be unexpected. He reports that increased testosterone (hormone linked with aggression) and decreased serotonin (hormone that regulates moods) is evident during the late teens.
Aggressive driving according to Whissel and Bigelow (2003) also has obvious links with sensation seeking. Sensation seeking is a personality trait where people tend to seek intense sensations and experiences. Sensation seekers tend to underestimate the likelihood of negative consequences from hazardous behaviour and the threat it presents to theirs and their passengers’ lives (Prato et al, 2010). Young people generally report greater sensation seeking behaviour than older people, (Department of Transport and Main Roads, 2009c).
21
2.2.4
Inability to identify risk or hazards
The available literature indicates that young drivers either rate situations as less risky than they are or that young drivers are unable to identify the risk associated with particular actions. Fergusson (2003) suggests young people differ in the way they define safe driving and consequently risk. He states that younger drivers tend to rate hazardous situations as less risky than older drivers.
Brown and Groeger, cited in Ulleberg and Rundmo (2003), support this suggesting that young drivers are more likely to underestimate the probability of the specific risk caused by traffic situations. Boyce and Geller cited in McKnight and McKnight (2003) found the behaviour of young drivers to be characterised by higher speeds and closer following distances than older drivers. Summalla and Wilde cited in Whissell and Bigelow (2003) argue that accident prone young drivers and youth in the workplace tend to distort the actual safety risks that their behaviour may incur. McKnight and McKnight cited in Ferguson (2003) reported deficits in a young drivers ability to identify potential risks on the road.
This argument is expanded upon in the Department of Transport and Main Roads (2009c) where it is suggested that young drivers, who tend to have a greater misunderstanding of crash risks, engage more in risky driving behaviour. However McKnight and McKnight (2003) concluded in their review of a sample of crashes involving young novice drivers from California and Maryland that only a small minority of the crashes reviewed resulted from what could be deemed deliberate risk taking. Instead they attribute most crashes result from a failure to employ routine safe operating practices due to an inability to recognise the risk involved.
Milech et al, cited in Ulleberg and Rundmo (2003), support this view, stating that young drivers tend to perceive the hazards in traffic less holistically. Castella and Perez cited in Machin and Sankey (2008) also identify that young drivers involved in high levels of speed underestimate the potential risk of driving situations and Rhodes, Brown and Edison (2005) conclude that young drivers in general do not see certain behaviours while driving as particularly risky, such as driving with multiple friends, loud music, or eating while driving.
2.2.5
Overconfidence
According to the Department of Main Roads (2004) young drivers tend to exhibit traits of impulsive driving, display poor risk management and a lack of strategic driving skills. Brown, cited in Clarke, Ward and Truman (2005), suggests that one of the reasons young drivers exhibit such traits is due to overconfidence in their control and recovery skills. Brown continues by stating that ‘relatively naive drivers tend to create accident opportunities for themselves because they often over-estimate their ability to recover from error’.
Castella and Perez, cited in Machin and Sankey (2008), support this by stating ‘young drivers who drive at excessive speed over-estimate their level of skill and underestimate the risks involved’. Moe, cited in Ulleberg and Rundmo (2003), also supports Brown by stating ‘young drivers overestimate their own driving skills’.
The Department of Transport (2004) further refine demographic groups prone to overconfidence by highlighting that young male drivers in particular often overestimate their ability and
therefore their ability to correct a situation. Deery, cited in Clark, Ward and Truman (2005), supports this view suggesting that people are generally overconfident about their level of skill but young males especially have a higher degree of risk acceptance while driving.
Overconfidence is strongly linked to deliberate risk taking.
2.2.6
Inattention / Distraction
22 Driver distraction may contribute in one of four ways:
• Visual distraction: when the driver’s eyes are diverted from the road ahead to another
object inside or outside the vehicle.
• Auditory distraction: attention is diverted from the road to listen to sounds such as the
radio or passenger conversations.
• Attentional / Cognitive distraction: When the thoughts of the driver absorb attention to
the point where driving performance is impaired
• Physical Distraction: removing one or both hands from the wheel to manipulate another
object, i.e. changing radio station.
These factors impact on all drivers regardless of age or experience. However, Dr Michael Regan of Monash University, cited in The Commission for Children and Young People and Child Guardian (2006), reports that young drivers are particularly vulnerable. He states that young drivers are more willing to engage in distracting activities and embrace new technologies that present distraction risks.
The high take up of new technologies by teenage demographics, linked with developing driving skills therefore places young drivers at a higher risk of distraction.
A report by Telstra, cited in Lee (2007), indicates that 30% of people surveyed had used text messaging while driving and that 16% regularly used text messaging while driving. Lee (2007) indentifies all forms of infotainment technologies, of which mobile phones are a part,
exacerbate all risks factors for driving and undermine the safety of young drivers.
2.2.7
Tendency to drive at high risk times (e.g. at night with a number of
young passengers)
Research suggests serious crashes involving younger drivers tend to occur at night and with passengers of similar age (Department of Transport and Main Roads, 2009c; Doherty and Andrey, 1997).
Clarke, Ward and Truman (2005) suggests the reason for increased young driver crashes during darkness is caused by the purposes for which young drivers are on the road during these hours, not the time of day. They highlight increased young driver crashes during night time driving is not caused by darkness but rather the purpose for which young drivers are on the road during these hours and the manner in which they drive while there. These include driving for social purposes and driving for pleasure.
Williams, cited in The Commission for Children and Young People and Child Guardian (2006), also recognises the increased risk associated with driving for social purposes. However he indicates that the complexity of night time driving, lack of experience with night time driving and fatigue also play a role in increasing the risk factors. In fact a survey of young drivers conducted by Vassallo et.al (2007) indicated that two-thirds of participants reported that they had driven when very tired at least once in their last 10 trips. However it must be remembered that fatigue can play an impact regardless of the time of day.
Driving for social purposes and pleasure tends to involve peer passengers. This is supported by the Commission for Children and Young People and Child Guardian (2006) who indicate that teenagers are more likely to be passengers in transport incidents.
So who are considered ‘peer passengers’? The Department of Transport (2005) indentifies peer passengers as someone under the age of 21 and not a family member.
23
Engstrom et al (2008) however identify that some studies indicate passengers present a protective factor, but clarifies by indicating the negative effect on young drivers is associated with the number and identity of the passengers. Doherty and Andrey (1997) agree stating that in terms of young drivers, it is generally believed that adult accompaniment has a safety benefit while the presence of peers has the opposite effect.
A study by Simons-Morton, Lerner and Singer (2005) found young male passengers led both male and female teen drivers to drive faster. They further elaborate indicating that when two or more peer passengers travel with a young driver there is a two to three fold increase in fatal crash risk. This is supported by Ouimet et al (2010) who concluded that teenagers, especially males, drive at higher speeds and with smaller headways when carrying male teenage
passengers. They found higher fatalities for young male drivers occurred when one or more of the passengers were male.
The task of driving at night time presents very few additional dangers to driving during the day time. Research indicates it is not the lack of day light but the attitude towards driving at night that increases the risk of crashing. Factors such as increased speed, alcohol and drugs, and recklessness is what places young drivers at risk during night time driving.
2.2.8
Alcohol or drugs
In the 2002 and 2003 U.S. National Survey on Drug Use and Health of over 32,000 persons aged 16-20, 21% reported that they had driven in the past year under the influence of alcohol or drugs (Hedlund et.al, 2006).
The use of alcohol and or drugs significantly impacts on driver performance regardless of age or experience. Alcohol can, in small amounts, act as a relaxant, giving the sensation of improved mood. But even small amounts of alcohol have a deteriorating affect on judgement and decision making. Large amounts of alcohol have a more pronounced affect, impacting on muscle co-ordination, slowing reflexes, impairing vision and hearing and diminishing the brains ability to process information (CIV3703, 2010).
Twisk and Stacey (2007) indicate that young drivers are more susceptible to the effects of alcohol, even at lower levels, increasing the danger alcohol poses. Doherty and Andrey (1997) support this, indicating that the risk of crash involvement is higher for young drivers at any blood alcohol level.
The effects alcohol presents to driving have been well documented but drugs, both legal and illegal, also impact on driver performance. Illegal drugs such as marijuana, amphetamines, cocaine and opium have been shown to have dramatic effects on driver performance.
Studies indicate the effects of these drugs range, depending on the type and dose, from dramatic increases in high risk driving behaviour (cocaine and amphetamines) to severe muscle co-ordination, visual and auditory impairment and even hallucinations (marijuana and opium). However it is not just illicit drugs. Some legal prescription drugs also have a negative impact on driver behaviour and performance (CIV3703, 2010).
24
Armstrong et al, cited in the Department of Transport and Main Roads (2009c), indicate many young drivers perceive the social rewards from drug driving exceed the punishments that can result and Hedlund, Shults and Compton (2006) indicate that alcohol and drug driving has strong connections with sensation seeking. The Department of Transport and Main Roads (2009c) also adds that young male drivers were less likely than young female drivers to believe drink driving was dangerous.
2.2.9
Choice of Vehicle
The literature indicates that young novice drivers tend to drive older and smaller vehicles (Department of Transport and Main Roads, 2009c; Ferguson, 2003).
However smaller vehicles provide less protection for occupants than larger vehicles (Ferguson 2003). Additionally, older vehicles tend not to be fitted with crash protection and driver assist features that are standard on newer vehicles; consequently they provide less protection for vehicle occupants before and during a crash (Ferguson, 2003; Department of Transport and Main Roads 2009c).
Twisk and Stacey (2007) and Keall and Newstead (2011) support this stating that for economic reasons young people tend to drive older vehicles with fewer safety features.
However vehicle design plays a key role in reducing the severity of injury resulting from a crash for passengers, drivers and other road users.
Newer technologies that support the driver and/or protect vehicle occupants and other road users, such as electronic stability control (ESC), anti-lock braking system (ABS), and crumple zones, plus emerging technologies like collision warning systems and intelligent speed adaption can enhance driving safety and according to Lee (2007) even mitigate some of the risks
associated with young drivers.
While age and size of vehicle is one element of vehicle choice, performance is another.
There is significant anecdotal reporting in the media suggesting vehicle performance is a factor leading to young driver fatalities. But Yannis, Golias and Papadimitriou, cited in Hedlund et al (2006), concluded from an investigation in to the combined effects of driver age and engine size for motorcycle crashes in Greece, that engine size had no effect.
Clarke, Ward and Truman (2005) also indicated that young drivers of performance cars are no more likely to exhibit skill deficits in their crash involvement than other young drivers however they conclude that young drivers of high performance cars tend to engage in higher levels of voluntary risk taking leading to a higher proportion of more severe crashes. This view is supported by Corbett in Giles (2004) who, after conducting a study on the effectiveness of speed cameras at reducing speed, found that 65% of drivers of high performance vehicles either ignored speed cameras or only temporarily slowed their speed.
2.3
Graduated Drivers Licence (GDL)
Many strategies have been implemented worldwide with varying levels of success aiming to reduce the number of serious crashes involving young drivers. These strategies have ranged from school based education programs aiming to improve young driver awareness to
specifically targeted advertising campaigns. Advertising campaigns have ranged from shock and scare tactics to humorous but with a serious message, (Tay, 2005; Sibley, 2009; TMR, 2010; Department of Transport and Main Roads, 2009c).
25
GDL programs differ from region to region however they do tend to have some similarities. In their most basic form GDL programs generally involve a three stage licensing system consisting of an extended learner’s period, an intermediate licence stage and a full licence. GDL licence holders are required to not only adhere to all standard traffic and licensing regulations but also have special restrictions and criteria that specifically apply to the stage of licensing the novice driver has achieved.
GDL differs from traditional probationary/provisional licence systems by the systemic, step wise approach to full licence status.
The learners permit allows driving only while supervised by a fully licensed driver and the intermediate licence allows unsupervised driving under certain conditions / restrictions. Both the learners permit and the intermediate licence have minimum age requirements and must be held for a specified minimum period of time with licensing privileges curtailed or removed if driving infringements are recorded. Progression from one stage to the next is only possible after successful completion of all requirements of the preceding stage.
GDL programs, according to Doherty and Andrey (1997), aim to target high risk driving situations for young drivers by focussing on the principles that ‘driving is a privilege, not a right’ and that those new to driving should ‘walk before they run’.
Doherty and Andrey (1997) suggest that GDL programs impose restrictions on new drivers that theoretically allow them the opportunity to gain experience in environments where risk is minimised.
Restrictions they identify that aim to reduce risk are:
• What (e.g. type of vehicle),
• When (night time or after drinking alcohol),
• Where (roadway restrictions e.g. high speed environment restrictions), • Why (certain trip purposes),
• With whom (number and/or characteristics of passengers).
The United State’s Insurance Institute for Highway Safety also defines good GDL programs as requiring at least a 6 month learning period, and either prohibiting driving between 10pm and 5am or allowing only one passenger during unsupervised driving times. They also stipulate that an unrestricted licence should not be issued prior to the age of 17, (Morrisey et al, 2006).
2.3.1
Arguments surrounding GDL components
How safely someone drives is based on a combination of factors in which driving skill is only one element. Unsafe driving arises not only from a lack of skill but also from attitudes about driving, including perceptions about the likelihood of being involved in a crash and beliefs about what safe driving involves. Historical approaches to driver education focussed only on skill development however GDL does not.
GDL programs aim to address young driver attitudes and perceptions of risk by establishing additional steps that need to be addressed in order to gain full licensing rights. However there are several arguments that surround the perceived benefits of various GDL steps. The following sections aim to highlight some of those issues.
26
Mandating a long learner period also, according to Foss (2007), encourages young drivers to obtain a wider range of experience with driving in different environments before they move to driving without supervision.
While most literature recommends at least 50 hours of pre-licensing practice, studies in Sweden show that increasing this to 120 hours can further reduce crash risk following licensing (Twisk and Stacey, 2007).
Feguson (2003) agrees, indicating that the longer periods of supervised driving included in GDL programs addresses risky driving that is a function of inexperience. However she states that risky driving resulting from ‘youthful exuberance’ and a ‘greater tendency to take risks’ requires additional motivation to ensure young drivers drive in a more cautious manner. Ferguson identifies the threat of meaningful penalties as the required powerful motivator. Males (2007) also cautions that the extended learner period stage of GDL programs runs the risk of perpetuating bad intergenerational driving habits rather than mitigating them when parents or other unqualified adults are deputised as driving instructors for novice teenage drivers.
Other programs such as advanced driver training have also been found to be counter-productive, particularly if they focus on vehicle skills, as they increase the young driver’s confidence, potentially increasing the risk of crashing (Twisk and Stacey, 2007).
The ability to detect and identify potential hazards is a skill, research indicates, that novice drivers generally have not fully developed. Many GDL programs aim to address this by including specific hazard perception training as part of a secondary stage driver education component of the GDL program (Ferguson, 2003).
The approaches range from formal in-class courses (Michigan USA) to second stage driver tests (New Zealand) to computerised testing and skill development, (New South Wales, Queensland and Victoria). Ferguson (2003) indicates that laboratory studies indicate many of these
approaches appear promising however she concludes that further research is required. However Sagberg and Bjornskau, cited in Twisk and Stacey (2007), found that a hazard perception test does not result in any important safety improvements in the first nine months after licensing. But Fisher, Pollatsek and Pradham, also cited in Twisk and Stacey (2007), found that after young drivers had attended computer based training programs focussing on
recognising potential risks, substantial improvements in their scanning behaviour on open roads was recorded.
2.3.1.2 Vehicle Restrictions
The RACQ (2003), in their report to the Travel Safe Committee, suggest that efforts to restrict probationary drivers from ‘performance vehicles’ will have a minimal effect considering the acceleration rates and top speeds of most vehicles, regardless of engine capacity and power. However, as mentioned earlier, Clarke, Ward and Truman (2005) and Corbett, cited in Giles (2004), indicate that young drivers of performance cars tend to engage in higher levels of voluntary risk taking leading to a higher proportion of more severe crashes.
2.3.1.3 Night Driving and Passenger Restrictions
Most GDL programs identified in this literature review have contained some measures aimed at:
• limiting the number of passengers in the vehicle, with the goal of reducing the
distractions and negative peer influences faced by the inexperienced driver,
• restricting the time when young drivers can drive.
27
Hasselberg and Laflamme (2009) support this, stating that night time driving restrictions have shown to be one of the most effective crash preventative measures among newly licensed drivers. But Chen et al (2010), while acknowledging that night time driving restrictions have been effective in reducing crashes among young drivers worldwide, questions the overall effect such restrictions would have in an Australian context.
Ferguson (2003) also questions whether GDL night driving restrictions can actually address fatigue issues, an issue that night time crashes are often attributed to. She states that while night time restrictions address night time drowsy driving they have no effect on day time drowsy driving.
The Commission for Children and Young People and Child Guardian (2006) also identifies that in 2005-2006, while Queensland teens were at greatest risk of involvement in a fatal crash between 10pm and midnight on a Saturday, the greatest number of fatal crashes involving teens actually occurred between 9am and 3pm on any given day.
Morrisey (2006) also concludes that passenger restrictions simply put fewer teens at risk of a fatal crash rather than substantially reducing the distraction factor associated with others in the vehicle.
These views are supported by Mandic and Ridgeway (2010) who state that GDL programs restricting passenger numbers have little impact on the number of teen driver fatalities however they do state that there is a reduction in the number of passenger fatalities.
The Commission for Children and Young People and Child Guardian (2006) also concedes that reductions in young driver crash rates resulting from passenger and curfew restrictions are the result of reduced exposure rather than safer driving.
Shoe and Molnar (2004) however identified that GDL programs in the United States have reduced the number of crashes involving passengers and Hedlund, Shults and Compton (2003) state that research has established conclusive evidence that night time driving restrictions reduce crashes.
2.3.1.4 Alcohol Restrictions
Twisk and Stacey (2007) and Doherty and Andrey (1997) indicated that young drivers are more susceptible to the effects of alcohol, even at lower levels, increasing the danger that alcohol poses.
All GDL programs identified aim to remove the impact alcohol can have on driving ability by imposing strict blood alcohol restrictions. These restrictions can only have a positive effect on driving ability and performance.
2.3.1.5 Restricting the environments in which novice drivers can drive in
While some jurisdictions restrict beginner drivers to lower speeds or even lower speed roads, according to Hedlund, Shults and Compton (2003), there is little evidence of the effectiveness of these measures.
Doherty and Andrey (1997) concluded, in their study of the GDL program in Ontario Canada, that restricting novice drivers to low speed roads actually increases cash risk due to road design. They highlight that low speed roads tend not to have the design protection factors that are inherently incorporated into high speed road design, safety factors that make the road safer, even though the speed environment is faster.
28 2.3.1.6 Enforcement
In many jurisdictions, advancement through the graduated licence program is contingent on the young driver recording no driving infringements.
This punitive approach to compliance is supported by Whissell and Bigelow (2003) who report that drivers in general tend to reduce their excessive speeding and other risky activities after punitive measures are imposed. Williams (2007) also concludes that restricting young drivers advancement through a GDL program if driving infringements are recorded should motivate teenage drivers to drive safely and obey the rules.
However enforcement of some GDL components will always be difficult. Police cannot tell if an unsupervised teen driver is violating GDL laws without actually stopping the vehicle. This is particularly difficult when considering night time driving and passenger restrictions.
Scott-Parker, Watson and King (2009) support this, emphasising that the threat of police detection for risky driving is extensively relied upon to curtail risky young driving behaviour, but adds that young drivers are less likely to comply with road rules if the anticipation of punishment is low.
Ferguson (2003) also reports that there is evidence that many of the night time and passenger restrictions, aimed to reduce the incidence of driving under these conditions, are regularly flouted.
This is where parents need to be involved. Parents play a central role in the licensing process, both providing supervision and ensuring compliance with licensing provisions. Several recent studies concluded that risky driving, traffic infringements and crashes are lower among teens whose parents set strict driving conditions and expectations, (Hedlund 2007).
Therefore the introduction of young driver measures needs to be accompanied by effective awareness raising campaigns not only targeting young drivers but (and perhaps even more importantly) directed at parents, politicians and other stakeholders (Twisk and Stacy, 2007).
2.3.2
Success of GDL Programs around the World
GDL programs have been implemented in many jurisdictions throughout the world including the USA, Canada, New Zealand, Israel and Australia to name a few. While the programs differ from region to region they all follow the same principal. To develop young driver’s skills through a procession of steps, aimed at providing young drivers the opportunity to gain experience in environments where risk is minimised.
GDL programs are unique in the history of traffic safety in the size of the effect they have had on reducing accidents among their target group.
In the United States for example North Carolina’s GDL laws reduced the rate of fatal crashes involving 16 year old drivers by 57% (Shope and Molnar, 2003).
After implementation of California’s GDL program there was a 24% decline in crashes where the young driver was considered ‘at fault’ and fatality rates for 16 year old drivers decreased significantly (Shope and Molnar, 2003; Males, 2007).
Ohio’s GDL program saw a reduction of 23% in crashes involving 16-17 year old drivers (Shope and Molnar, 2003).
Florida’s GDL reforms reduced the crash rates among 15-17 year old drivers by 9% (Morrisey et.al, 2006).
Michigan’s program reduced the crash rate for 16 year old drivers by 25% (Shope and Molnar, 2004).
Pennsylvania saw a 27% reduction in crashes and 58% reduction in fatalities since the implementation of their GDL program (Shope and Molnar, 2003).
29
O’Conner, Lin, Tinkoff and Ellis (cited in Williams and Schults, 2010) found reductions in crash rates and hospitalisation rates resulting from vehicle accidents among 16 and 17 year olds in Delaware following the introduction of graduated licensing.
Williams and Schults (2010) indicate GDL programs lead to a reduction in police reported crashes and fatal crashes in New Jersey.
Dee et al (2005), cited in Morrisey et al (2006), concluded that good GDL programs implemented in the USA have reduced motor fatalities involving 15–17 year old drivers by 19%.
Mandic and Ridgeway (2010), concluded from their analysis of 12 different GDL programs that teen fatalities reduced after the GDL programs were implemented.
Morrisey (2006) also concludes that GDL programs categorised as good by the Insurance Institute for Highway Safety were estimated to reduce motor vehicle fatalities among 15-17 year old drivers in the USA by 19.4%.
Williams and Shults (2010) further add that at the 2007 Tucson symposium Shope concluded, from a review of 27 studies completed since 2002, that GDL programs reduced crash
involvement of young drivers in the USA by 20–40%.
However some of the literature concludes that the GDL programs implemented in the United States may have an adverse impact on driver safety.
Males (2007), for example suggests the Californian GDL program has merely shifted the dangers of risky behaviour from 16 year olds to 18 year olds, (age of full licensure under the Californian system).
Hedlund, Shults and Compton (2006) however rebut this indicating that GDL systems, defined as any system with an intermediate licensing phase, reduced traffic fatalities among 15-17 year olds by at least 5.6% and did not increase fatalities among older teens.
GDL successes are not only limited to the United States. In jurisdictions outside of the United States, evaluations have reported declines in accidents involving young novice drivers ranging from 7% to 37% (Schope and Molnar 2004).
Begg and Stephenson (2003) indicate that immediately following the introduction of the GDL program in New Zealand there was a marked decrease in the rate of 15-19 year old drivers involved in crashes reported to the police. Additionally they add there was also a reduction in admissions to hospital for crash related injuries for this age group. In the 12 years since implementation the number and rate of fatality or seriously injured motor vehicle occupants aged 15-24 years of age in New Zealand has nearly halved (Begg and Stephenson, 2003). While Begg and Stephenson (2003) acknowledge there are a range of factors other than GDL which have contributed to this result they conclude that GDL is the most important factor influencing this outcome.
Doherty and Andrey (1997) support this indicating that evidence from New Zealand suggests that casualties (fatalities and injuries combined) dropped initially by about 25 percent for young drivers and, although the long term rates have been lower, continue to show a positive impact on young driver crash rates (Doherty and Andrey, 1997).
Prato et.al (2010) while providing no actual percentage, conclude that the higher level of experience acquired during the supervised period of the Israeli GDL program lowers the risk indices for young drivers during the solo driving period.
Twisk and Stacey (2007) highlight that alterations to the practice driving period in Sweden reduced the crash risk for young drivers by 40%.
30
Doherty and Andrey (1997) indicate the Ontario, Canada GDL program reduced crash
involvement by 9%, casualty crash involvement by 10% and fatal crash involvement by 24%. Williams and Shults (2010) identified that the Saskatchewan, Canada, GDL program reduced at fault crashes and injury crashes among novice drivers.
Williams and Shults concluded from their analysis of the literature that populations targeted by GDL programs experience significant reductions in crash rates. They do however concede that it is unclear whether the crash reduction effects of GDL persist beyond the time young drivers receive full licence privileges.
However Begg and Stephenson (2003) suggest that drivers in New Zealand, who began driving under GDL, have lower crash rates in later years than similar aged non GDL drivers.
2.3.3
Graduated Licence Schemes Operating in Other Australian States
and Territories
Graduated licensing programs are not new to Australia. The concept of a GDL was first raised as part of the Federal Government's Road Safety Initiative in December 1989. This Road Safety Initiative stipulated that all States and Territories were required to adopt a GDL program that reflected the Federal Governments proposed program. The components of the Federal Government Graduated Licensing program were:
• zero blood alcohol concentration (BAC) for learner drivers
• zero BAC for the first three years after obtaining a non-learners licence up to 25 years of age
• no learners’ permits to be issued before 16 years of age • no probationary licence to be issued before 17 years of age • the minimum period for a learners’ permit to be six months
• licences issued for automatic vehicles to apply for the probationary period unless a manual test is undertaken or other requirements, specified by the State or Territory, are met.
(Monash University Accident Research Centre, 2005).
As a consequence of this initiative, all Australian States and Territories have implemented GDL programs and, over the last 20 years, have further refined these programs.
While most elements of the State and Territory programs are similar there are some minor differences.
2.3.3.1 Victoria
The current Victorian graduated licensing program commenced on 1st July 2008. According to Vic Roads (2010) and Youth Central (2010) the Key features of the Victorian GDL program include:
• Written test required to obtain a learners permit. • A minimum 12 month learner period.
• Compulsory 120 hours of logged supervised driving during the learner period. Of these
120 hours at least 10 hours must involve night time driving.
• A computerized hazard perception test as part of the probationary driving test. • A two stage probationary drivers licence system. First stage (P1) is one year. Second
31
• P1 drivers permitted to carry only one passenger aged between 16 and 21.
• For P1 drivers, mobile phone use, including hands free and hand-held, or any messaging
of any kind, is not allowed.
• P1 drivers are prohibited from towing anything unless under supervision or work
related.
• P1 and P2 drivers are prohibited from driving certain types of vehicles.
• To progress to a full licence, probationary drivers must record no speeding, drug, drink
or other driving offences. If offences are recorded, that do not result in the suspension of the licence, then the probationary period is extended.
• No blood alcohol volume is permitted during P1 and P2 period.
• Licence must be surrendered if five or more demerit points are accrued in one year. • All other road and licensing rules apply.
(Vic Roads, 2010).
2.3.3.2 New South Wales
On the 19th December 2009 the NSW government refined their GDL program.
The new GDL program, like the original GDL program, consisted of three beginning driver stages:
• Learners permit.
• Provisional licence 1 (P1). • Provisional licence 2 (P2).
However the new learners’ period was extended to a minimum of 12 months and required a minimum of 120 logged hours of driving practice (later reduced to 100). At least 20 of these hours had to involve night time driving. This lengthening of the learners’ period resulted in solo driving not being permitted until the learner driver was at least 17 years old.
In an effort to encourage professional driving instruction, lessons conducted by a professional instructor accrue log hours at an increased rate of 3:1. However the fast tracked rate is limited to a maximum of 30 logged hours; 10 hours of professional instruction. Additional professional lessons conducted over the 10 hour threshold are only accrued at a 1:1 ratio (Transport Roads and Traffic Authority, 2011).
Restrictions that apply to learner drivers are as follows:
• Be supervised at all times by the holder of a full Australian drivers licence.
• Have L plates displayed on the f