Research Report DFE-RR033
Young People
and Community
Cohesion:
Analysis from the
Longitudinal Study of
Young People in England
(LSYPE)
Sean Demack, Deborah Platts-Fowler,
David Robinson, Anna Stevens, Ian Wilson
Sheffield Hallam University (Centre for
Regional Economic and Social Research
and the Centre for Educational and
This research report was written before the new UK Government took office on
11 May 2010. As a result the content may not reflect current Government policy and
may make reference to the Department for Children, Schools and Families (DCSF)
which has now been replaced by the Department for Education (DFE).
Table of Contents
Executive Summary ... 5
1.
Introduction and Background to the Study ... 10
1.1
The Community Cohesion Agenda: A Short History ... 10
1.2
Young People, Schools and Community Cohesion Policy ... 12
1.3
Explaining Community Cohesion ... 14
1.4
Aims of this Study ... 15
1.5
Structure of the Report ... 16
2.
Approach and Methods ... 17
2.1
Introduction ... 17
2.2
Measuring Community Cohesion... 17
2.3
Explaining Community Cohesion ... 20
2.4
Modelling and Analysis ... 20
3.
Exploring Predictors of Cohesion ... 23
3.1
Introduction ... 23
3.2
Explaining Local Cohesion ... 23
3.3
Explaining Societal Cohesion ... 26
3.4
Conclusion ... 27
4.
Local Cohesion ... 28
4.1
Introduction ... 28
4.2
Individual Predictors of Local Cohesion ... 30
4.3
School and District Level Predictors of Local Cohesion ... 38
4.4
Conclusion ... 39
5.
Societal Cohesion ... 41
5.1
Introduction ... 41
5.2
Individual Predictors of Societal Cohesion ... 43
5.3
Conclusion ... 49
References ... 55
Glossary ... 57
Appendix 1: A Description of the Explanatory Variables ... 61
A1.1
Introduction ... 61
A1.2
Individual level variables ... 61
A1.3
School level variables ... 66
A1.4
LAD level variables ... 68
Appendix 2: Relationships between Explanatory Variables and Community
Cohesion Outcome Measures ... 70
Appendix 3: Modelling ... 80
A3.2
Modelling approach ... 81
Executive Summary
Introduction
Little is currently known about what factors help explain variations in cohesion among young people. This report helps fill this gap in understanding. Variations in perceptions of
community cohesion among different groups of young people are described and the factors informing these variations in community cohesion are explored. These objectives are delivered through multi-level statistical modelling of data from the Longitudinal Study of Young People in England (LSYPE).
Approach
Analysis focuses on two measures of community cohesion:
local cohesion - a measure focused on the headline question on community cohesion in the LSYPE, which asks young people whether "people from different racial and ethnic and religious backgrounds mix well together", supplemented by a second local measure based on responses to a question about whether young people agree or disagree that "people round where I live usually respect each others' religious differences".
societal cohesion - a national measure of cohesion among young people generated in response to criticism of previous similar studies regarding the limitations of the headline measure of community cohesion in differentiating between different spatial scales to which a person might feel they belong. It also responded to the emphasis in official definitions of community cohesion on key dimensions of citizenship,
including people having similar life opportunities, trusting one another and institutions to act fairly and having a sense of belonging to Britain. The societal measure was constructed from five variables relating to citizenship rights, fairness and equality within British society.
Two types of analyses form the basis of this report. First, descriptive analyses were undertaken, which set the scene by examining the nature of the 75 explanatory variables, how they relate to the outcome variables (local and societal cohesion) and how they inter-relate to other explanatory variables. Second, statistical modelling was used to identify the key influences on (local and societal) cohesion whilst controlling for (or holding constant) other influences. This involved looking at how helpful the individual level variables are in predicting the likelihood of a young person having low cohesion and exploring if school and local authority district (LAD) level variables are also helpful in predicting low cohesion among young people.
Local Cohesion
A young person's perception of local cohesion is a product of their individual characteristics (socio-demographic characteristics, attitudes and perceptions), the school they attend and the local authority district they live in. However, individual characteristics account for the vast majority of the variation in levels of cohesion among young people.
opportunity in the UK (societal cohesion); and perceptions of local services.
Increased mix of children from different ethnic backgrounds (ethnic mix) in the school increases the likelihood of perceptions of low cohesion. However, this broad finding masks wide variations in the relationship between different forms of ethnic mix (the particular ethnic groups mixing and proportion of each group) and levels of
cohesion1.
There is a complex relationship between ethnic mix and cohesion among young people. Ethnic mix is a significant predictor of local cohesion, but increased mix is associated with low local cohesion, apparently contradicting the findings of studies on the adult population. However, low cohesion appears to be linked to particular types of mix (proportion of particular ethnic groups involved in the mix). Clearly, there is need for further research into this issue.
Increased economic mix (that is, a greater mix of pupils from different socio-economic backgrounds) appears to have a positive influence on cohesion, a finding raising significant questions for policy and worthy of further research and analysis. These findings suggest that if local community cohesion is what needs to happen in a community to enable different (racial and ethnic) groups to get on well together, the key priorities for promoting this vision among young people are:
tackling perceptions of crime and promoting feelings of safety
promoting a sense of fairness, belonging and opportunity in the UK (societal cohesion)
tackling deprivation and promoting socio-economic well-being improving local services, and
promoting social mix in schools.
More targeted interventions might usefully focus on detached and excluded young people (those involved in personal risk behaviours, anti-social behaviour) and young people who are achieving academically in the context of deprivation, who appear to be at risk of becoming disillusioned, perhaps as a result of limited opportunities.
Societal Cohesion
The measure of societal cohesion spotlights perceptions of social mobility, fairness, freedom, respect, discrimination and inclusion. It extends analysis beyond the reach of previous studies that have been limited to modelling the influences on the headline measure of cohesion and the question of whether people mix and get on together in the local area.
A young person‟s perception of societal cohesion is primarily a product of their individual characteristics and circumstance. The characteristics of the school they attend are less important and the local authority district did not emerge as significant during analysis.
There is a strong relationship between perceptions of local cohesion and societal cohesion. Local cohesion is the strongest predictor of societal cohesion.
There is a close relationship between local cohesion and societal cohesion, but the
1
only significant predictors of both measures of cohesion are ethnicity, perceptions of crime, perceptions of local services and respondents‟ perceptions around teachers, school and education.
Socio-economic factors have a less noticeable impact on societal, compared with local cohesion.
Ethnic mix at the school or local authority district level are not significantpredictors of societal cohesion.
These findings suggest that if community cohesion involves working toward a society in which young people believe they are accepted as worthy and valued citizens, whose rights are respected and they are treated fairly, key priorities for action could include:
promoting local cohesion
supporting young people to recognise and exercise their citizenship rights
improving the school experience, reducing exclusions and suspensions and tackling bullying, and
supporting post-16 engagement in full-time education and training.
More targeted interventions might usefully focus on: young White British/Irish people; people born in the UK; and detached and excluded young people who are involved in anti-social behaviour.
Conclusions
Individual level factors are the most important influence on cohesion - a young person‟s perception of local and societal cohesion appears to be, first and foremost, a product of their individual characteristics and circumstance. The characteristics of the school they attend and the local authority district they live in are far less
important.
Individual disadvantage undermines cohesion - deprivation consistently undermines local cohesion among young people. This finding chimes with analysis of the adult population. Lower socio-economic groups are more likely to have low cohesion. Socio-economic status interacts with educational attainment so that higher attainment in more deprived areas is a negative influence on perceptions of local cohesion, pointing to the possibility of alienation in situations where limited
opportunities thwart ambition and potential. Young people in full-time education are more positive about societal cohesion.
The school a young person attends is an influence on cohesion - individual level factors are the most important influence on cohesion, but school characteristics do have a role in influencing cohesion. This influence is most pronounced in relation to local cohesion. The school experience - the ethos, approach and perceived quality of teaching - impact on cohesion among young people. Perceptions of teacher quality and discipline, and enjoyment of school also affect levels of cohesion.
There is a strong relationship between local and societal cohesion - there is a strong and consistent relationship between perceptions of cohesion in the local area and
Ethnicity and country of birth are important influences on cohesion - young people from minority ethnic backgrounds tend to have more positive views about local and societal cohesion than White young people. One finding contradicts this; Black-Caribbean young people are most likely to report negative perceptions of fairness, belonging and opportunity, as measured by societal cohesion. People not born in the UK tend to have more positive views about cohesion than people born in the UK.
There is a complex relationship between ethnic mix and cohesion among young people - the ethnic mix (i.e. mix of pupils from different ethnic backgrounds) in the school a young person attends or in the local area where they live is not a significant influence on levels of societal cohesion. Ethnic mix is a significant predictor of local cohesion, but increased mix is associated with low local cohesion, apparently contradicting the findings of studies on the adult population. However, the way that ethnic mix is measured does not recognise the difference between ethnic groups, and consequently masks important findings that are more supportive of ethnically mixed schools. Indeed, greater ethnic mix can have a positive effect on cohesion at the school level, mirroring findings from previous studies. However, low cohesion appears to be linked to particular types of mix (proportion of particular ethnic groups involved in the mix). Clearly, there is need for further research into this issue.
Migration is not a significant predictor of cohesion among young people- the level of national and international migration into a local authority district is not a significant predictor of local or societal cohesion among young people. This finding appears to contradict the findings of previous studies of the adult population, which suggest that an increasing percentage of in-migrants born outside the UK is a negative predictor of cohesion, raising the potential of different experiences of and attitudes toward immigration among young people.
Recommendations for improving cohesion
The findings summarised above suggest that tackling deprivation and disadvantage is likely to have the most profound effect on levels of community cohesion among young people. The findings also point to other more immediately realisable priorities for action. Six of these priorities are outlined below, in no particular order:
Bullying - There is a strong association between personal safety and cohesion. Bullying not only makes the lives of victims a misery, undermining their confidence, self esteem and sense of security, it appears that it can also undercut cohesion. This finding underlines the importance of schools creating and implementing a whole school anti-bullying policy. Bullying within schools can also spill out into the local community, promoting concerns about well-being and safety among young people and, potentially, informing perceptions of crime that are so important to notions of local cohesion. Efforts to prevent and respond to bullying at play and leisure amenities, at youth activities and during journeys to and from school are therefore also important to promoting cohesion.
Fairness, Belonging and Opportunity - perceptions of fairness, belonging and opportunity are strongly associated with levels of cohesion among young people. This finding raises important questions about the way that citizenship is taught in schools. In particular, it points to the importance of complementing efforts to promote political literacy and participation and to strengthen notions of identity, with efforts to support young people to recognise and realise the rights and opportunities of
citizenship. The curriculum, in delivering on the aim of enabling young people to become responsible citizens who make a positive contribution to society, should seek to support young people to recognise their citizenship rights and to negotiate the processes that might prevent them from exercising these rights. It also appears, judging from the relatively large proportion of young people reporting low levels of societal cohesion, that many young people do not perceive themselves to be accepted as worthy, valuable and responsible members of society. This finding reaffirms the importance of the citizenship agenda.It also suggests that promoting positive images of young people and their contributions to local community and society could improve cohesion.
Ethos, Approach and Perceived Quality of Teaching - the ethos, approach and quality of teaching (as perceived by pupils) and enjoyment of school can affect levels of cohesion. This finding would appear to support the aim of ensuring that in every school there will be good behaviour, strong discipline, order and safety. It is also a finding that points to the importance of inspection regimes focusing on 'softer' measures of the school experience, in addition to core concerns around academic achievement, leadership and management. The school inspection system currently reports on the contribution made by the school to the well-being of pupils and the contribution made by the school to community cohesion. There is a need to reflect upon whether, in responding to these conditions, adequate information is collected and collated regarding the pupil experience: life in the classroom; life in and around school; and enjoyment of being at school.
Selection and Social Mix in Schools - children who attend comprehensive schools are more positive about local cohesion than children who live in areas that operate selective education and attend either a grammar school or a secondary modern (or 'community') school. This finding suggests that cohesion benefits would flow from an end to selection in schools. It also points to the importance of ensuring that, as required by the Schools Admissions Code, admission arrangements in non-selective schools do not permit selection or „cherry picking‟ of the wealthiest or brightest children by covert means.
1.
Introduction and Background to the Study
If policy is to promote a cohesive society it needs to know what factors explain variations in cohesion. There is therefore interest in the predictors of community cohesion. A series of questions about community cohesion have been inserted into national surveys and a
number of studies have used these nationally representative data to explore the relationship between community cohesion and a range of variables (see Laurence and Heath, 2008; Lloyd, 2010; Wedlock, 2006). Important insights have been provided, but an important gap in understanding remains regarding the predictors of community cohesion among young people. This is despite young people and schools being a key concern within the community cohesion agenda since its emergence in 2001. This report helps fill this gap in
understanding by presenting findings from analysis of data from the Longitudinal Study of Young People in England (LSYPE). Using multi-level statistical modelling, it examines the demographic, experiential and attitudinal predictors of community cohesion at the individual, school and district level.
This chapter provides an overview of the broad context within which the study is situated. A brief summary of formal understandings and definitions of community cohesion is provided, before discussion goes on to consider policy on young people, schools and community cohesion. Attention then turns to previous attempts to describe and explain variations in levels of community cohesion. The chapter concludes with a summary of the key objectives of the study to be explored through analysis of the LSYPE.
1.1
The Community Cohesion Agenda: A Short History
The community cohesion agenda emerged in the immediate aftermath of a series of street disturbances in northern towns and cities in 2001. The various reports into the disturbances commissioned by government were consistent in their conclusions. Residential segregation was assumed to lead to social isolation and limited cross-cultural contact, which allows misunderstanding and suspicion to flourish and can lead to inter-community tensions and violence and disorder. Different groups, defined on the basis of their ethnic origin, were reported to be living separate or 'parallel lives'; living in different locations, going to different schools and socialising separately. Suggesting that community cohesion is about helping micro-communities gel or mesh into an integrated whole (Independent Review Team, 2001), the challenge was reported to be the development of common goals and a shared vision for communities divided by a 'them and us' attitude (Home Office, 2001). To this end, it was suggested that greater contact should be promoted between different communities by tackling the residential segregation that promotes separation in schooling, employment, service use and social life.
In 2002, Guidance on Community Cohesion (LGA et al., 2002) was issued providing the first formal definition of the concept. A cohesive community was defined as one where:
there is a common vision and a sense of belonging for all communities
the diversity of people‟s different backgrounds and circumstances are appreciated and valued
those from different backgrounds have similar life opportunities, and
strong and positive relationships are being developed between people from different backgrounds in the workplace, in schools and within neighbourhoods.
2003, and the Faith and Cohesion Unit of the Home Office. Various other reports and guidance documents were produced in 2004 and 2005, including the final report of the Community Cohesion Panel, which reviewed progress made since the publication of the report of the Independent Review Team (Independent Review Team, 2004) and an update of the guidance on community cohesion originally published in 2002 (LGA, 2004).
In 2005, government's commitment to community cohesion policy was formalised in the publication Improving Opportunity, Strengthening Society (Home Office, 2005), which married the cohesion and race equalities agendas. According to the introduction to the strategy, the aim was to set out:
…how we will ensure that a person’s ethnicity is not a barrier to their success and foster the social cohesion necessary to enable people from minority and majority communities to work together for social and economic progress.
(Home Office, 2005, p.16)
The strategy reinforced the notion that community cohesion was, first and foremost, about relations between different groups defined on the basis of race or ethnicity. Life chances were reported as important to the building of strong and cohesive communities. Deprivation and a lack of opportunity were recognised as significant contributory factors underpinning the disturbances in 2001. Two subsequent updates of Improving Opportunity, Strengthening Society (CLG, 2006; 2007) also drew attention to material inequalities. First and foremost, however, attention remained focused on the promotion of a shared belonging and identity, nurtured through interaction and shared participation:
a strong society relies on more than simply good individual life chances. Experience suggests that people also need a sense of common belonging and identity, forged through shared participation in education, work and social activities, and through mutual understanding of cultural difference. National cohesion rests on an inclusive sense of Britishness which couples the offer of fair mutual support – from security to health and education – with the expectation that people will play their part in society and respect others.
(Home Office, 2005, p.20)
The community cohesion agenda was consolidated in 2007 with the launch of Our Shared Future, the final report of the Commission on Integration and Cohesion (CIC). The CIC was charged with updating community cohesion agenda in light of two key developments that were perceived to be destabilising society. The first was the problem of 'violent extremism', most obviously evidenced by the London bombings of 2005. The second was the arrival of relatively large numbers of migrant workers following the accession of Eastern European states to the European Union in 2004. In response, the CIC report sought to merge the policy response to cohesion and integration, while recognising the two concepts as distinct. The final report of the CIC presented a new framework for cohesion. Four key principles were identified as underlying this understanding of integration and cohesion: „shared futures‟; a new model of rights and responsibilities; a new emphasis on mutual respect and civility; and visible social justice (p.1). The CIC report also broadened the range of locality types considered likely to experience cohesion problems, beyond the inferred focus on inner city locations with relatively large South Asian populations.
confirmed integration and cohesion as twin concerns. Community cohesion was defined as "what must happen in all communities to enable different groups of people to get on well together. A key contributor to cohesion is integration which is what must happen to enable new residents to adjust to one another" (p.10). The vision of an integrated and cohesive society was reported to be based on three foundations:
people from different backgrounds having similar life opportunities; people knowing their rights and responsibilities;
people trusting one another and trusting local institutions to act fairly. and on three ways of living together:
a shared future vision and sense of belonging;
a focus on what new and existing communities have in common, alongside a recognition of the value of diversity;
strong and positive relationships between people from different backgrounds. This new definition claimed to be different from the old definition of community cohesion in two key ways. First, it placed greater emphasis on the importance of citizenship and community empowerment to building cohesion; "ranging from rights and responsibility to a shared future vision" (p.10). Second, it spotlighted the increasing importance of integration to cohesion; "how important a sense of having things in common is to building trust and positive relationships between new and existing residents" (p.10).
1.2
Young People, Schools and Community Cohesion Policy
Young people and schools have been a key concern within the community cohesion agenda ever since it emerged as a distinct policy in 2001. The terms of reference of the
Independent Community Cohesion Review Team emphasised the importance of obtaining the views, opinions and experiences of young people. To this end, the Review team's visits to towns and cities across England included meetings with youth and community workers and visits to schools and community projects involving young people. The resulting report (Independent Review Team, 2001) emphasised the importance of younger people being engaged in the national debate that was called for in a bid to develop some shared principles of citizenship and ensure ownership across the community.
The report identified schools as having a central role to play in breaking down barriers between young people and helping to create cohesive communities. Recommendations included the need to place a statutory duty on schools to promote understanding and respect for different cultures through a programme of cross-cultural contact and to consider the ways in which to ensure that their intake is representative of local cultures and ethnicities. Advice to schools about their contribution to community cohesion soon followed.
The emphasis placed on schools as an agent of change reflects their recognised potential to serve as sites of integration, bringing together young people from different backgrounds („race‟, ethnic, faith, gender, and social class); sites of citizenship training, promoting shared understandings and sense of belonging; and sites of knowledge and skills acquisition, promoting similar life opportunities:
In 2004, the Home Office published guidance on community cohesion standards in schools (Home Office, 2004), which were framed by four strategic aims focused on: closing the achievement gap between students from different backgrounds; promoting common values of citizenship; building good community relations; and removing barriers to access and participation. Subsequently, the Education and Inspections Act 2006 introduced a duty on the governing body of schools in England to promote community cohesion and on Ofsted to report on the contributions made in this area, a requirement that emerged out of debate about admissions and faith schools and concerns about segregation in schooling. These developments were in addition to the duty placed on all schools by the Race Relations Act 2000 to eliminate unlawful racial discrimination and to promote equality of opportunity and good relations between people of different groups.
Guidance for schools on the duty to promote community cohesion was published in July 2007 (DCSF/CLG, 2007) and contained the following working definition of community cohesion:
By community cohesion, we mean working towards a society in which there is a common vision and sense of belonging by all communities; a society in which the diversity of people’s backgrounds and circumstances is appreciated and valued; a society in which similar life opportunities are available to all; and a society in which strong and positive relationships exist and continue to be developed in the workplace, in schools and in the wider community. (DCSF/CLG, 2007 p.3; emphasis in original)
Each school was encouraged to develop its own approach to community cohesion reflecting the nature of the school‟s population (whether it serves pupils drawn predominantly from one or a small number of religions or beliefs, ethnic or socio-economic groups or from a broader cross-section of the population, or whether it selects by ability from across a wider area) and the location of the school (for instance, whether it serves a rural or urban area and the level of ethnic, socio-economic, religious or non-religious diversity in that area). Equal emphasis was placed on activities targeted at the pupil base and engagement with the wider
community:
Teaching, learning and curriculum – helping children and young people to learn to
understand others, to value diversity whilst also promoting shared values, to promote awareness of human rights and to apply and defend them, and to develop the skills of participation and responsible action – for example through the new „Identity and Diversity: living together in the UK‟ strand within citizenship education.
Equity and excellence – to ensure equal opportunities for all to succeed at the
highest level possible, striving to remove barriers to access and participation in learning and wider activities and working to eliminate variations in outcomes for different groups.
Engagement and extended services – to provide reasonable means for children,
young people, their friends and families to interact with people from different backgrounds and build positive relations, including: links with different schools and communities; the provision of extended services; and opportunities for pupils,
gender, sexual orientation, disability and age - are interconnected with the aspiration to promote community cohesion. However, schools were reminded that the main focus of the duty is cohesion across different cultures, ethnic, religious or non-religious and socio-economic groups (DCSF/CLG, 2007; p.5).
Other policy developments in relation to young people, schools and community cohesion have included the Diversity and Citizenship Curriculum Review, led by Sir Keith Ajegbo. The Review team's report was published in January 2007 and made a series of
recommendations aimed at promoting diversity across the schools curriculum and the content of the curriculum for Citizenship Education. The Government has been working to implement the report's recommendations, including the introduction of the revised secondary curriculum for citizenship including a new identity and diversity strand and establishing a new agency to support school linking2. The Government response to the report of the
Commission for Integration and Cohesion also encouraged local authorities to consider how they can improve community cohesion and support schools in their duty to promote
community cohesion through the renewal of school buildings under the Building Schools for the Future programme and the Primary Capital programme. Finally, in 2007 Government published Aiming High for Young People: a ten year Strategy for positive activities. Among other things, the strategy underlined the important role positive activities can have in developing community cohesion, particularly in bridging the gaps between young people from different ethnic and faith groups as well as improving relationships across different generations.
1.3
Explaining Community Cohesion
There have been various attempts to explain the factors influencing community cohesion (DTZ, 2007; IpsosMORI, 2007; Lloyd, 2010; Wedlock, 2006). Some common themes have emerged, including the importance of deprivation and crime as predictors of community cohesion, but there are also inconsistencies. The significance or otherwise of ethnicity as a predictor is one obvious example. It has therefore been difficult to venture beyond the broad conclusion that an individual's sense of cohesion is a product of their individual
characteristics and the characteristics of the community they live in, and that the factors influencing community cohesion are therefore numerous and vary between areas (CLG, 2010). Even less is known about the predictors of community cohesion among young people, little attention having been paid to community cohesion among children and young people (Hetherington et al., 2007).
The most robust, nationally representative evidence on community cohesion in England is provided by the work of Laurence and Heath (2008). This study used data from the 2005 Citizenship Survey, the 2001 Census and the Indices of Deprivation 2004 to construct a number of different statistical models that explored potential socio-demographic and
attitudinal predictors of community cohesion at the individual and community levels. The key conclusion to emerge was that, irrespective of the level of diversity in a community,
disadvantage consistently undermines perceptions of cohesion. Diversity does not interact (statistically) with disadvantage to further divide areas with larger minority populations. Even in White homogeneous areas with little diversity, disadvantage has a similar effect on
undermining cohesion between individuals. Disadvantage is thus the stronger negative predictor of cohesion: this is the case at both the individual and the community level. Disadvantage is, however, not the only negative predictor of cohesion. Other key explanatory variables identified by Laurence and Heath included:
2
• the undermining effect of crime - the strongest negative predictor of community
cohesion at the community level was found to be the levels of and fear of crime. At the individual level, fear of crime and fear of racist attack were two of the strongest
negative drivers of cohesion. This finding corresponds with the findings of analysis of the 2003 Citizenship Survey, which found that as recorded rates of crime decreased the "sense of community" increased (Wedlock, 2006).
• the effect of having friends from different backgrounds - in most cases, ethnic diversity was reported to be a positive predictor of cohesion once other factors have been accounted for. People in ethnically diverse communities were reported to be much more likely to mix with people from different backgrounds and as a result may experience greater levels of cohesion. Having friends from different ethnic groups was found to have a significant positive effect on perceptions of cohesion.
• cohesion in White and Pakistani & Bangladeshi areas - for the most part, ethnic diversity and cohesion were positively associated. Just one exception was found: living in an area with both a large White and a large Pakistani & Bangladeshi population (but no other significant minority ethnic population) was reported to be a negative predictor of cohesion. There was no clear relationship between population change and cohesion at the local level, but if a large proportion of people moving into an area are non-White and born outside the UK, there is a negative effect on
cohesion.
• the positive effect of community empowerment -people who felt they could influence local level decisions were more likely to think that their local area was cohesive (although ability to influence national level decisions had no effect on cohesion). Feeling cut off from the local decision making process was thus a negative predictor of cohesion.
1.4
Aims of this Study
It is difficult to actively promote cohesion when little is known about the factors that influence it. In response, a number of studies have been commissioned to explore the relative
significance of individual and community characteristics in explaining levels of cohesion. This study adds to this emerging body of evidence by focusing on a group that has been central to the community cohesion agenda since its emergence but neglected in analysis of the factors influencing cohesion; young people.
The study addresses two key aims:
to describe different perceptions of community cohesion among different groups of young people, and
to explore the factors informing these variations in community cohesion. These aims were pursued through multi-level statistical modelling of data from the Longitudinal Study of Young People in England (LSYPE). The LSYPE3 is a large-scale panel survey, managed by the Department for Education (DfE). It is following thousands of young people across England and its key role is to identify and improve understanding of the factors which affect young people‟s progression from the later years of compulsory
education through to further and higher education, training, work, or other outcomes. It is a
longitudinal study, in that it interviews the same cohort of young people (and their parents) annually and can track changes in their circumstances, attitudes and other factors. LSYPE began in Spring 2004 with an achieved initial sample of almost 16,000 young people drawn from Year 9 schools rolls (in both maintained and independent sectors) in England. Young people respondents were aged 13-14 years old at the time of first interview. Interviews have taken place annually (in the spring/summer), resulting in a total of six annual interviews or „waves‟ up until 2009. For the first four years the young person‟s parents or guardians were also interviewed. There have also been sample boosts for the six major minority ethnic groups. One effect of this is to also boost sample numbers of members of non-Christian faiths, in particular Muslims.
The LSYPE brings together rich and detailed data from these annual interviews with the sample (most of which also had interviews with at least one parent) with public examination results and other data from the National Pupil Database (NPD); data about the schools
sample members have attended since entering education and data about the
neighbourhoods sample members were resident in each year of interviewing (from postcode derived links). Data collected from parents included detailed family history and employment histories (both back to birth of young person sampled). For further information on the LSYPE please see: https://ilsype.gide.net/workspaces/public/wiki/Welcome
1.5
Structure of the Report
Chapter 2 outlines the definition of community cohesion employed in the study and summarises the approach to modelling and analysing variations in community cohesion. Chapter 3 presents the descriptive analysis of the 75 potential explanatory variables considered during analysis. Chapters 4 and 5 present the results to emerge from the multi-level modelling. Conclusions and recommendations for promoting cohesion are presented in Chapter 6. More detailed information regarding the definition of community cohesion
2.
Approach and Methods
2.1
Introduction
This chapter reviews the process and profiles the measure of community cohesion used in this study and the predictor variables analysed, before going on to provide an overview of the analytical techniques used to explore the main factors associated with low cohesion among young people in England.
2.2
Measuring Community Cohesion
Community cohesion is a multi-dimensional and complex concept that simultaneously addresses issues of citizenship rights and responsibilities, inclusion within the normal business of living and working within society, perceptions of belonging, acceptance and worth and relations between different groups, identified on the basis of race, faith and socio-economic backgrounds. It is a concept rooted in the perceptions, attitudes, behaviours and actions of individuals, groups and institutions. It is first and foremost concerned with
relations within and between communities of place, but also speaks to identities and notions of belonging at other geographical scales, including the town, city and the nation-state. This complexity renders the measurement of community cohesion a challenging prospect. In 2003 the Home Office set out a list of 10 indicators to be used by local authorities and their partners to help build a picture of community cohesion in their area. A headline indicator was presented as capturing the main essence of community cohesion in a single survey question: "to what extent do you agree or disagree that this local area (within 15/20 minute walking distance) is a place where people from different backgrounds get on well together" (Home Office, 2003). A further nine indicators were grouped under the themes of the broad definition of community cohesion which appeared in the guidance to local
authorities issued in 2002. The headline indicator has been widely used to measure community cohesion.
A number of limitations have been recognised with these indicators and warnings issued about the insights that can be inferred from their application. A general concern relates to the use of ambiguous terms, which can be interpreted in different ways. In relation to the headline indicator, Ratcliffe et al. (2008) argue that the focus on 'background' prevents the attribution of causal factors to any one variable, such as ethnicity, age or gender. The reliance on indicators based upon perceptions is also open to a number of problems. These include issues around survey completion and the 'acquiescent response set' problem, whereby people agree with a statement regardless of its content, and complex issues around understanding and interpretation of definitions (for example, of 'background' and 'getting along'). Ratcliffe et al. (2008) also raise concerns about the reference to multiple spatial scales, making it difficult to determine to what entity a person might feel they belong (neighbourhood, town, region, country), and the tendency for indicators to focus on negative elements of ethnic relations (tensions and disturbances), even when seeking to measure positive relations.
of: openness of British society, treatment of young people by the media, importance of religion or religious values, treatment of young people by police and fairness and respect for rights in Britain today; perceptions of prevalence of, and own past experience of,
discrimination based ethnicity or religion; if and how discrimination might affect them in the future and perceptions of neighbourhood. Drawing on this data, two outcome measures were constructed for the current analyses.
One output measure focused on local cohesion and one on elements of cohesion within the national context (referred to as societal cohesion), in an attempt to distinguish between and explore notions of belonging at these different spatial scales. These measures were
generated through a process of statistical techniques (primarily correlation) and critical judgement, to create measures that address the key dimensions of community cohesion. The local cohesion measure follows the lead of Laurence and Heath (2008) and focuses on the headline indicator of community cohesion. However, the headline question on community cohesion in the LSYPE is notably different to the headline indicator employed in the Citizenship Survey. Rather than asking if "people from different backgrounds get on well togetherin the local area" the LSYPE asks young people whether "people from different racial and ethnic and religious backgrounds mix well together". The focus is squarely on ethnic and religious attributes, the prime concerns of the community cohesion agenda (DCSF/CLG, 2007), helping to address the problem of attribution raised by Ratcliffe et al. (2008).
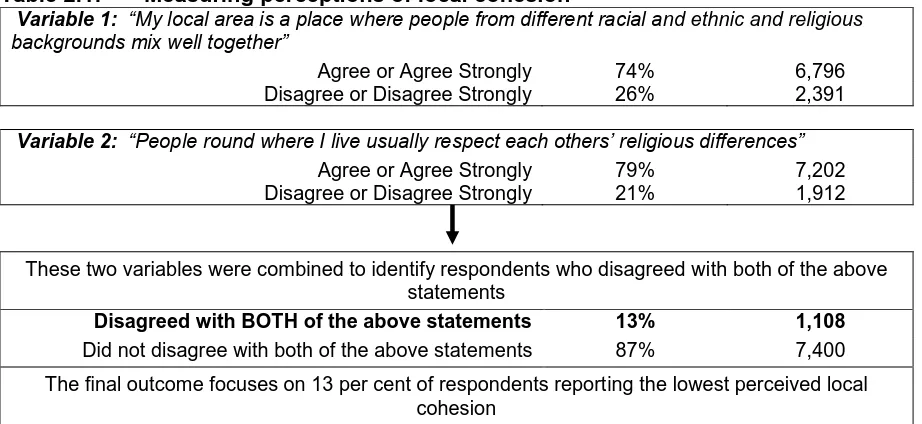
[image:18.595.72.533.473.685.2]This headline measure is supplemented by a second local measure, based on responses to a question about whether young people agree or disagree that "people round where I live usually respect each others' religious differences". Together, these two questions capture how a young person perceives the attitudes of people in their local area toward others, defined on the basis of ethnicity and religion. Respondents who disagreed with both original statements (13 per cent of all respondents) are defined as exhibiting low local cohesion.
Table 2.1: Measuring perceptions of local cohesion4
Variable 1: “My local area is a place where people from different racial and ethnic and religious
backgrounds mix well together”
Agree or Agree Strongly 74% 6,796 Disagree or Disagree Strongly 26% 2,391
Variable 2: “People round where I live usually respect each others’ religious differences”
Agree or Agree Strongly 79% 7,202 Disagree or Disagree Strongly 21% 1,912
These two variables were combined to identify respondents who disagreed with both of the above statements
Disagreed with BOTH of the above statements 13% 1,108
Did not disagree with both of the above statements 87% 7,400 The final outcome focuses on 13 per cent of respondents reporting the lowest perceived local
cohesion
4 In the LSYPE questions, the local area was defined as „within a 10/15 minute walk‟ of the
The measure of national or societal cohesion among young people responds to criticisms about the limitations of the headline measure of community cohesion in differentiating between different spatial scales to which a person might feel they belong. It also responds to the emphasis in official definitions of community cohesion on key dimensions of
[image:19.595.70.531.189.589.2]citizenship, including people having similar life opportunities, trusting one another and institutions to act fairly and having a sense of belonging to Britain. Table 2.2 summarises the construction of this outcome.
Table 2.2: Measuring perceptions on societal cohesion
Variable 1: “It is easier now for people like me to get on and improve things for themselves than it
was for my parents”
Agree or Agree Strongly 78% 7,365 Disagree or Disagree Strongly 22% 2,078
Variable 2: “Britain today is a place where people are usually treated fairly no matter what
background they come from”
Agree or Agree Strongly 54% 5,400 Disagree or Disagree Strongly 46% 4,525
Variable 3: “Britain is a free country where everyone’s rights are respected no matter what their
background ”
Agree or Agree Strongly 60% 5,919 Disagree or Disagree Strongly 40% 3,906
Variable 4: “How much discrimination do you feel there is in Britain today?”
A little / none 55% 5,416 A lot 45% 4,497
Variable 5: “How fairly do you think people like yourself are treated by Government in Britain today ”
Neutral / fairly / Very fairly 79% 7,842 Unfairly (very or quite) 21% 2,081
The above five variables were combined create a 5-point scale: Overall Perceptions on societal cohesion = V1+V2+V3+V4+V5
Highest societal cohesion 0 24% 2,084
1 24% 2,086
2 22% 1,878
3 17% 1,512
Lowest societal cohesion 4 or 5 13% 1,090
The final outcome focuses on the 13 per cent of respondents who report the lowest perceived societal cohesion
Analysis focused on exploring factors explaining low perceptions of local and societal cohesion and involved profiling the respondent types exhibiting negative perceptions of cohesion. This approach was rooted in the presumption that focusing on low cohesion was more likely to facilitate analysis and interpretation that would point to relevant and
2.3
Explaining Community Cohesion
The LSYPE questionnaire covers a range of topics that facilitate exploration of potential key influences on cohesion among young people. These include issues identified as important in previous studies (see section 1.3) and various school related factors that have not been tested before in relation to cohesion. In addition, other datasets were brought into the analysis to extend the exploration of school and local authority district (LAD) level factors. These came from a range sources, including administrative data from DfE; Department of Communities and Local Government; Department for Work and Pensions; Office of National Statistics; the Home Office; and the School Level Annual Schools Census; and the local authority Place Survey, co-ordinated by CLG. The result was a total of 75 explanatory variables, which were organised into three levels, summarised in Tables 2.3, 2.4 and 2.5 below:
Level 1: The respondent, household & local area 48 variables Level 2: The school and the area around the school. 11 variables Level 3: Local Authority District (LAD) 16 variables
For more information about and full definitions of the explanatory variables see Appendix 1.
2.4
Modelling and Analysis
5Two types of analyses6 were undertaken. Descriptive analyses set the scene, by examining the nature of the explanatory variables, how they relate to the outcome variables and how they inter-relate to other explanatory variables. This involved looking at the distributions of all variables selected for the analysis and looking for relationships between variables, particularly to identify those that are strongly associated. The results are discussed in Chapter 3.
Statistical modelling identified the key factors associated with low cohesion whilst controlling for (or holding constant) other factors. This involved looking at how helpful the individual level variables (i.e. those relating to the young person, including their household and local area) are in predicting the likelihood of a young person having low cohesion, using logistic regression techniques. It also involved exploring if school and LAD level variables are also helpful in predicting low cohesion among young people, using multilevel logistic regression techniques. These techniques allow analysis to explore complex interrelationships between variables. For example, a young person's school and LAD may influence their perceptions of cohesion over and above individual level factors, or school and LAD level factors may influence individual level factors, which in turn influence their perceptions of cohesion. A multilevel model 'untangles' these kinds of relationships by controlling for factors at all levels to determine which are most strongly associated with cohesion. The findings from the multilevel modelling are the focus of discussion in Chapters 4 (on local cohesion) and 5 (on societal cohesion).
5
See Appendix 3 for a detailed discussion of the modelling approach.
6
Table 2.3: List of Individual level explanatory variables used in the cohesion analysis
Demographics Ethnicity
Age (month of birth within the academic year) Religion
Disability
English language ability
Household composition (number of parents) Whether the young person is born in the UK Geographical region
Gender
Type of location (urban/rural indicator)
Socio-economics
Main educational / economic activity of young person (age 17-19) Housing tenure
Parental social class (NS-SEC)
Local area Index of Multiple Deprivation (IMD). Household income
Local area (reported) crime incidents
Educational experience and engagement
GCSE attainment
Whether young person has a Special Educational Need (SEN) School suspension
Parental education
Frequency of truanting (age 13-16)
Parental engagement with education (attendance at parents evenings) Experience of being bullied (age 13-19)
Use of private tuition
Wellbeing and behaviour
Emotional well-being (GHQ12) Attendance at a community centre Whether young person is a carer Attendance of a youth club/centre Participation in sport
Personal risk behaviour (smoking, alcohol, cannabis) Playing a musical instrument
Anti-social behaviour (fighting, vandalism, graffiti, shoplifting)
Educational perceptions
Young person's perception of teacher quality and discipline Parental perceptions of the quality of their child's school
Young person's perception of their engagement and enjoyment of school Parental satisfaction with their child's schooling
Young person's perception of being happy at school Parental perceived involvement with their child's education
Young person's educational aspirations and expectations for the future Parental educational aspirations and expectations for their child's future
Social, political and cultural perceptions
Young person's satisfaction with local services (shops and buses) Young person's perception of their relative poverty/wealth
Young person's likelihood of voting in the next general election (civic engagement / belonging)
Young person's perception of local area cohesion Young person's perception of being proud to be British Young person's perception of crime in the local area
Perception of how (un)fairly young people are treated by the media and the Government
Table 2.4: List of School level explanatory variables used in the cohesion analysis
The School Items sourced from the National Pupil Database (NPD):
School admissions policy (e.g. comprehensive/modern/selective) Ethnic mix (categorised entropy index)
Proportion of pupils whose first language is known (or understood to be) a language other than English
Size of school Pupil teacher ratio Faith status
Percentage of pupils eligible for Free School Meals (FSM)
Percentage of pupils attaining 5+ A*-C GCSEs (including Maths and English)
Type of school
[image:22.595.76.525.330.567.2]Contextual Value Added (CVA) score Single sex or mixed school
Table 2.5: List of Local Authority District (LAD) level explanatory variables used in the cohesion analysis
The Local Authority District
Ethnic mix (categorised entropy index) (source: ONS)
Population size (mid-year population estimates 2007) (source: ONS) Deprivation (indices of deprivation 2007) (source: CLG)
GCSE attainment: % 5+ A*-C including Maths and English by pupil residence (source: DfE)
Proportion in the LAD who gained access to their highest preference secondary school in 2008 (source: DfE)
Crimes rates per 10K population (against the person and against property) (source: Home Office)
National and international migration into the LAD (source: ONS) Place Survey (2008/09)7 adult survey items:
Proportion who feel they belong to their immediate neighbourhood Proportion who agree that they can influence decisions in their local area Proportion who are satisfied with their local area as a place to live
Overall satisfaction with council services Satisfaction with local council services Satisfaction with local transport services Satisfaction with local leisure services
7
3.
Exploring Predictors of Cohesion
Summary
Perceptions of crime are strongly associated with perceptions of cohesion (in
particular, local cohesion). The more young people perceive crime in their local area to be a problem, the more likely they are to have low cohesion.
Perceptions of local and societal cohesion are related. On average, young people with low local cohesion are likely to have low societal cohesion as well (and vice versa).
Factors at the individual, school and Local Authority District level are all associated with local cohesion, but societal cohesion is primarily influenced by factors at the individual level.
Socio-economic factors (such as parental social class, income, local deprivation and educational/economic activity) are associated with both local and societal cohesion, but they are particularly strong for local cohesion.
Experiences (e.g. truancy and bullying) and perceptions (e.g. of teacher quality and engagement) of school are associated with perceptions of local and societal
cohesion. The more negative these experiences and perceptions, the more likely the young person is to have low cohesion.
Demographic and socio-economic factors tend to be inter-related and are highly influential on a range of other factors that are associated with levels of cohesion among young people.
3.1
Introduction
This chapter introduces the key associations between local and societal cohesion (i.e. the two outcome measures) and the 75 potential explanatory factors considered during analysis. These findings serve to set the scene before discussion goes on to present and interpret the findings from the statistical modelling, which was used to explore in more depth the key influences on cohesion.
3.2
Explaining Local Cohesion
Individual level factors
Perception of local crime - perception of local crime was the explanatory factor most strongly associated with local cohesion. Over half of respondents who reported the highest perceived crime problem locally also reported low levels of local
cohesion. This compares with less than five per cent of respondents who reported the lowest perceived crime problem locally. This finding is consistent with analysis of predictors of community cohesion within the adult population, which found that crime and fear of crime strongly undermine cohesion. However, it is interesting to note that recorded crime did not emerge as a significant influence on cohesion among young people, despite being a strong negative predictor of community cohesion within the adult population (Laurence and Heath, 2008).
Perception of societal cohesion - just over a third of respondents who reported the lowest levels of societal cohesion also reported low levels of local cohesion, while only four per cent reported the highest levels of societal cohesion.
Local area deprivation (as measured through the Index of Multiple Deprivation) - 27 per cent of respondents in the 10 per cent most deprived areas reported low local cohesion, compared with five per cent of respondents in the 10 per cent least deprived areas.
Perception of teacher quality and discipline8 - respondents who reported more negative perceptions of teacher quality and discipline were more likely to report low local cohesion.
Involvement in anti-social and personal risk behaviour - higher levels of self-reported involvement in anti-social behaviour (i.e. fighting, vandalism, graffiti, shoplifting) and personal risk behaviour (i.e. alcohol, cigarettes, cannabis) were associated with more negative perceptions of local cohesion.
Frequency of truanting- low local cohesion was reported by 22 per cent of
respondents who self-reported being a persistent truant, compared with 10 per cent of respondents who reported no truancy.
Happiness at school and perceived engagement / enjoyment at school - more positive experiences at school were associated with decreased likelihood of low local cohesion.
Experience of being bullied - respondents who reported being bullied in Years 9, 10 and 11 were more likely to report low local cohesion compared with respondents who reported no experience of being bullied.
Exclusion(permanent or temporary) - young people who had been excluded from school (permanently or temporarily) were most likely to report low local cohesion.
Ethnicity - White British/Irish respondents were more likely than other ethnic groups to report low local cohesion.
8
Religion - respondents with no religion were more likely to have low local cohesion compared with young people reporting a religious affiliation.
English language ability and whether respondents were born in the UK - these factors were significantly (but relatively weakly) associated with local cohesion. Respondents who were born in the UK and who spoke English fluently were most likely to report low cohesion.
GCSE attainment- GCSE attainment of respondents was found to be significantly (but very weakly) associated with perceptions of local area cohesion. Young people with five GCSEs A*-C (including English and Maths) were less likely to report low local cohesion than young people without these qualifications. GCSE attainment was more strongly associated with local cohesion at the school and LAD levels,
suggesting that the level of attainment within a school cohort (or area of residence) is more influential on perceptions of local cohesion than a young person‟s own GCSE attainment.
School level factors
GCSE attainmentand Value Added - respondents attending schools with higher levels of GCSE attainment and those with higher Contextual Value Added (CVA) scores were less likely to report low local cohesion.
Proportion of pupils eligible for Free School Meals - respondents attending schools with greater proportions of pupils eligible for Free School Meals (used here as a proxy for school level deprivation) were more likely to report low local cohesion.
Local Authority District (LAD) level factors
Satisfaction with local area as a place to live - respondents living in LADs with greater overall satisfaction with their area as a place to live were less likely to have low cohesion.
GCSE attainment - respondents living in LADs with higher overall GCSE attainment were less likely to have low cohesion.
Rates of crime against property - respondents living in LADs with higher rates of property crime were more likely to have low cohesion.
Deprivation (IMD) - respondents living in LADs with higher levels of deprivation were more likely to have low cohesion.
3.3 Explaining Societal Cohesion
The 15 explanatory factors listed below were significantly associated with young people's perceptions of societal cohesion. The analysis looked across all three levels - the individual, school and Local Authority District (LAD) level factors - but only individual level factors were found to be significantly associated with levels of societal cohesion. The factors below are listed in order of strength of association with societal cohesion.
Perceptions of local area cohesion - perception of societal cohesion is most strongly associated with perceptions of local area cohesion. Just over 30 per cent of respondents who reported the lowest local area cohesion also reported low societal cohesion. This compares with seven per cent for respondents who reported the highest perceived level of local area cohesion.
Perceptions of local crime - 27 per cent of respondents who perceived crime to be a major problem locally also reported low societal cohesion. This compares with nine per cent for respondents who reported the lowest perceived crime problem.
Involvement in anti-social and personal risk behaviour - higher levels of self-reported involvement in anti-social behaviour (i.e. fighting, vandalism, graffiti, shoplifting) and personal risk behaviour (alcohol, cigarettes, cannabis) were associated with increased likelihood of low societal cohesion.
Young person's activity at age 17/18 - the association between societal cohesion and socio-economic factors was weaker than for local cohesion. The strongest association was between the economic/educational activity of respondents at age 17/18. Respondents in full-time education were least likely to report low societal cohesion; 11 per cent compared with 22 per cent for respondents who were Not in Education, Employment or Training (NEET) and 19 per cent for respondents in employment with training.
School experiences - there were significant associations between attitudes towards and experiences at school and societal cohesion. Increased levels of truancy, being bullied, being excluded (permanently and temporarily) and reduced engagement, enjoyment and happiness at school were all associated with increased likelihood of low societal cohesion. For example, low societal cohesion was reported by 27 per cent of respondents who were persistent truants compared with 10 per cent of respondents who reported no truancy.
Intention of voting - there is a relatively weak but substantive association between intention to vote and societal cohesion for young people. Young people who
reported an intention to vote in the next general election were less likely to have low societal cohesion than those who do not intend to vote.
Young Person's Higher Education aspirations (age 17/18) - young people who had applied or intend to apply for Higher Education (HE) were less likely to have low cohesion than those who do not intend to apply.
GCSE attainment - young people gaining five or more GCSEs A*-C (including maths and English) were less likely to report low cohesion than those who did not.
Parental satisfaction with their child's schooling - greater satisfaction reduced
the likelihood of low societal cohesion. Where parents were satisfied with their child‟s schooling, young people were less likely to report low societal cohesion.
Satisfaction with local services - young people's perceptions of their local services (e.g. shops and buses) were significantly, but weakly, associated with societal
cohesion. A fifth of respondents who reported local services to be poor had low societal cohesion, compared with only a tenth of respondents who reported services to be good.
Importance of ‘being British’ - young people's perceptions of how important it was to them "being British" was weakly associated with societal cohesion. Perhaps unsurprisingly, the less important being British was to a young person, the more likely they were to report low societal cohesion.
Ethnicity - Across all ethnic groups, the Black-Caribbean group was most likely to report low societal cohesion.
Religion - Non-religious respondents were more likely than young people with a religious affiliation to report low societal cohesion.
Parental satisfaction with the school - the quality of the school, or at least perceptions of the quality of the school, were associated with societal cohesion. Twenty-six per cent of respondents whose parents reported the quality of the school to be poor had low societal cohesion, compared with just 13 per cent of respondents whose parents reported the school to be good.
English language ability and whether born in the UK - these were significant but very weakly associated with societal cohesion. Respondents who were fluent in English and born in the UK were most likely to report low cohesion.
3.4
Conclusion
This chapter has introduced the key associations between (local and societal) cohesion and the 75 potential explanatory factors included in the analysis. Nineteen individual, school and LAD level variables have been revealed to have a significant association with levels of local cohesion. Fifteen individual level variables were identified as being significantly associated with societal cohesion.
4.
Local Cohesion
Summary
A young person‟s perception of cohesion in the local area was, first and foremost, a product of their individual characteristics and circumstance. The characteristics of the school they attend and the local authority district they live in were less influential.
Low socio-economic status and high deprivation were strongly and consistently associated with low local cohesion.
Perception of crime is a strong predictor of local cohesion. Controlling for all other factors, the more young people perceive crime in their local area to be a problem, the more likely they are to have low local cohesion. Other perceptions associated with low local cohesion include: a low perceived sense of fairness; a low feeling of belonging and opportunity in the UK (i.e. societal cohesion); and dissatisfaction with local services (i.e. shops and buses).
lower educational attainment and a higher proportion of pupils eligible for free school meals were significant predictors of low cohesion at the school level. A selective school admissions policy was also a significant predictor of low local cohesion. Increased levels of ethnic mix within the school were negatively associated with local
cohesion. However, there is strong evidence that the relationship between ethnic mix and cohesion depends on which ethnic groups are mixed together and in what concentrations. In many circumstances school ethnic mix was positively associated with local cohesion.
The only significant predictor of local cohesion at the local authority district level is the level of satisfaction with the area as a place to live.
4.1
Introduction
Local cohesion was measured by the headline question exploring whether people from different racial and ethnic and religious backgrounds mix well together, supplemented by a second local measure based on responses to a question about whether young people agree or disagree that „people round where I live usually respect each others' religious differences’. Respondents who disagreed with both statements were defined as exhibiting low local
cohesion.
Variables significantly associated with low local cohesion among young people were reviewed across three levels: the young person (individual); the school; and the local
authority district (LAD). Analytical techniques were used to estimate the relative importance of these three levels in explaining the variation in young people's perceptions of local
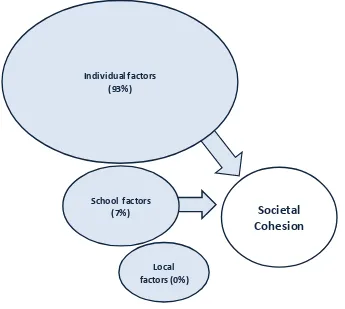
Figure 4.1: The relative importance of individual, school and LAD level factors in explaining local cohesion among young people (not to scale)
Local
Cohesion
Local factors (4%) School factors
(15%) Individual factors
(81%)
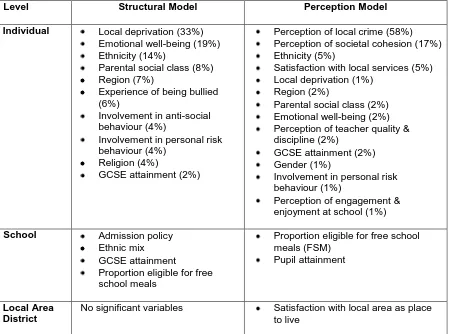
The discussion below draws on findings to emerge from two models - a structural model and a perception model - to explore this relationship between local cohesion and individual, school and LAD factors. It is worth explaining at the outset the difference between the two models:
the structural model - focuses on 'fixed' factors at the individual level, such as socio-demographic characteristics, past behaviours and experiences. Young people‟s perceptions were not included. In the structural model, individual factors have by far the greatest explanatory power. Table 4.1 shows (in order of importance) the individual, school and local authority district level factors that were significant predictors of low local cohesion in the structural model. Appendix 3 contains more detailed information about the structural model.
the perception model - takes account of structural and perceptional variables at the individual, school and LAD levels. By taking account of perceptions, this model is able to explain more of the variation in local cohesion among young people. Table 4.1 shows the individual, school and local authority district level factors that were significant predictors of low local cohesion in the perception model, ordered according to importance. Comparing this with the significant variables in the structural model reveals that controlling for perceptions results in changes in the significant variables highlighted by analysis. Appendix 3 contains more detailed information about the perception model.
Table 4.1: Factors significantly associated with low local cohesion among young people
(ordered by strength of association)
Level Structural Model Perception Model
<