This is a repository copy of
The Impact of Inter-Virtual Machine Traffic on Energy Efficient
Virtual Machines Placement
.
White Rose Research Online URL for this paper:
http://eprints.whiterose.ac.uk/149173/
Version: Accepted Version
Proceedings Paper:
Alharbi, HA, Elgorashi, TEH, Lawey, AQ orcid.org/0000-0003-3571-4110 et al. (1 more
author) (2019) The Impact of Inter-Virtual Machine Traffic on Energy Efficient Virtual
Machines Placement. In: Proceedings of the 2019 IEEE Sustainability through ICT Summit
(StICT). The 2019 IEEE Sustainability through ICT Summit (StICT), 18-19 Jun 2019,
Montréal, QC, Canada. IEEE . ISBN 978-1-7281-0308-2
https://doi.org/10.1109/STICT.2019.8789381
© 2019, IEEE. This is an author produced version of a paper published in Proceedings of
the 2019 IEEE Sustainability through ICT Summit (StICT). Personal use of this material is
permitted. Permission from IEEE must be obtained for all other uses, in any current or
future media, including reprinting/republishing this material for advertising or promotional
purposes, creating new collective works, for resale or redistribution to servers or lists, or
reuse of any copyrighted component of this work in other works. Uploaded in accordance
with the publisher's self-archiving policy.
[email protected] https://eprints.whiterose.ac.uk/
Reuse
Items deposited in White Rose Research Online are protected by copyright, with all rights reserved unless indicated otherwise. They may be downloaded and/or printed for private study, or other acts as permitted by national copyright laws. The publisher or other rights holders may allow further reproduction and re-use of the full text version. This is indicated by the licence information on the White Rose Research Online record for the item.
Takedown
If you consider content in White Rose Research Online to be in breach of UK law, please notify us by
The Impact of Inter-Virtual Machine Traffic on Energy
Efficient Virtual Machines Placement
Hatem A. Alharbi, Taisir E.H. Elgorashi, Ahmed Q. Lawey and Jaafar M.H. Elmirghani
School of Electronic and Electrical Engineering, University of Leeds, LS2 9JT, United Kingdom
Abstract— In this work, we investigate the energy efficiency of placing virtual machines (VMs) in geo -distributed data centers taking into account inter-VM traffic in addition to users traffic. The problem of VMs placement is formularized as a mixed integer linear programming (MILP) model with an objective to minimize the network and cloud power consumption taking into consideration cooperation
traffic between different VMs and synchronization traffic
between replicas of the same VM in addition to the download
traffic from VMs to users. The model results show that the
number of VMs replicas across geo-distributed clouds is limited by the existence of inter-VM traffic in the core network. The total power consumption can potentially increase by a factor of 39 if inter-VM traffic is not taken into consideration when optimizing the placement of VMs.
Keywords— Virtual machine, inter-VM traffic, VMs cooperation, VMs synchronization, energy efficiency, IP over WDM networks.
I. INTRODUCTION
There is no denying that cloud computing is the main commodity and possessing most of today’s Internet traffic. According to Cisco [1], in 2016, total cloud traffic was 52% of all global Internet traffic. Further astronomical growth is projected within the approaching years as total cloud computing traffic is expected to be 71% of the total Internet traffic in 2021. Cloud computing provides ubiquitous on-demand access to an Internet-based pool of compute, storage, and communication resources to a large set of geographically distributed users. Cloud computing scalability is highly dependable on the efficient provisioning of the datacenter physical resources. Virtualization provides a promising resource allocation management approach where the datacenter physical resources are abstracted into numerous logical entities called virtual machines (VMs) [2]. Each VM is allocated its own CPU, memory, network bandwidth and storage resources to run a logically isolated application from other VMs. Further dynamism in resource management can be achieved by relocating VMs within or across cloud datacenters through replication and migration. VMs relocation can serve workload balancing, optimization of the physical resources utilization, datacenter maintenance, failover recovery and energy efficiency.
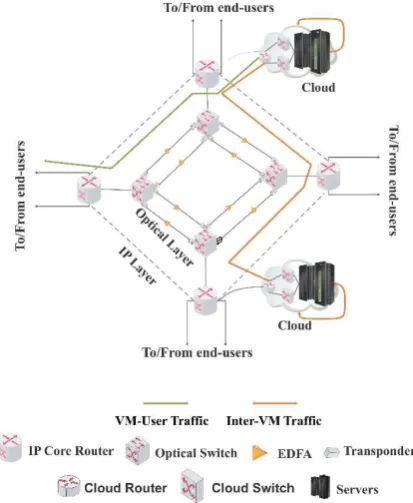
In a cloud environment, different VMs may need to communicate to complete their processing jobs as seen Fig.1(a) [3]. As well, in case of replication, replicas of a VM need to communicate to ensure synchronization (see Fig. 1(b)) [4]. This inter-VM traffic is a major contributor to the east-west traffic (server to server traffic) which is expected to be responsible of 85% of the global cloud traffic by 2021 as opposed to north-south traffic (between server and client), which accounts for the remaining traffic [5]. Inter-VM traffic has been intensively investigated in
the literature. The authors in [6] studied the traffic of communicating VMs hosted by a group of servers. The trace analysis shows that inter-VM traffic varies significantly between different VMs pairs. In [7], the authors developed a system that measures the throughputs between data-intensive VMs pairs inside Amazon EC2 and Rackspace clouds. They found that the throughputs vary from as low as 100 Mbps to almost 4.5 Gbps. Also, they developed an integer linear programming (ILP) model and an algorithm to formulate the problem of intra-datacenter network-aware VM placement.
Designing energy efficient cloud services requires co-optimization of north-south traffic and east-west traffic. For example, migrating an application VM, which has high inter-traffic with a database VM, to another datacenter in order to satisfy the increasing users demand may raise the burden on inter data center network infrastructure. The authors in [8] studied the energy efficient placement of VMs inside a datacenter taking into consideration inter-VM traffic. The problem of energy efficient VMs placement over geo-distributed cloud datacenters while taking into account inter-VM traffic has not received much attention. In this paper, we investigate this problem by developing a mixed integer linear programming (MILP) model to optimize the placement of VMs in geo-distributed clouds in IP over WDM core networks, as seen in Fig. 2, so the total power consumption is minimized taking into consideration the cooperation traffic between different VMs and synchronization traffic between replicas of the same VM in addition to the download traffic from VMs to users.
The rest of this paper is organized as follows: The MILP model for energy efficient VM placement in IP over WDM network considering inter-VM traffic is introduced in Section II. In Section III, we present and discuss the model results. Finally, the paper is concluded in Section IV.
[image:2.595.310.543.604.703.2]Fig. 2: IP over WDM networks supported by clouds.
II. OPTIMIZATION OF VMS PLACEMENT In this section, we extend the models developed in [9] and [10] to optimize the placement of VMs with the objective of minimizing the total power consumption considering download traffic between users and VMs. The models are extended to study the effect of inter-VM traffic on the energy efficient placement of VMs. The CPU workload of VMs vs the number of users is considered to follow a linear profile as seen in Fig. 3, where the CPU workload varies linearly with the number of users served by the VM [10]. To maintain the SLA, each VM needs a minimum workload to run an application regardless of the number of users served by the VM. In the following, we present the parameters, variables and constraints introduced in [9] for completeness and introduce the new parameters, variables and constraints to model the inter-VM traffic and inter-VMs workload.
The following parameters and variables represent the cloud datacenter;
Cloud datacenter parameters Cloud switch port bit rate.
Cloud switch port power consumption. Cloud switch redundancy.
Cloud router port bit rate.
Cloud router port power consumption.
Power consumption of a server.
Maximum workload of a server. Cloud power usage effectiveness.
Cloud datacenter variables
if a cloud is hosted in node , otherwise .
Number of routers ports in the cloud hosted in node . Number of switches ports in the cloud hosted in node .
Number of processing servers in the cloud hosted in node .
Fig. 3: Linear relationship between VM workload and number of users.
The VMs to be hosted in the cloud and the traffic resulting from them are defined by the following parameters and variables;
VMs parameters: Set of VMs.
Indices of source and destination nodes of a traffic demand.
Number of VMs. Number of VM users.
Users download rate of each VM
1, if there is a cooperating traffic between VM and VM , otherwise 0.
Cooperation traffic between VM and VM .
Synchronization traffic between VM replicas.
Maximum workload of VM .
VM minimum CPU usage under a linear workload profile.
Traffic resulting from VM replica serving the maximum number of users.
Workload per traffic unit of VM replica calculated as:
Large enough number.
VMs variables:
Workload of VM replica hosted in cloud in node s.
Total workload of cloud hosted in node .
Traffic demand from VM hosted in cloud located in node to users located in node .
Upload traffic from cloud hosted in node to node d.
Download traffic of cloud hosted in node .
if the cloud hosted in node hosts a copy of VM , otherwise
if there is a possibility for cooperation traffic from VM located in node to VM located in node , otherwise
if cooperation traffic exists from VM located at any node to VM located in node , otherwise
if cooperation traffic exists from VM located in node to VM located in node , otherwise
Binary variables set to 1 only if one or two of the following conditions are satisfied; there is a cooperating traffic from VM to VM , VM is located in node or VM is located in node , otherwise set to 0.
Cooperating traffic from VM to VM located in different nodes and .
[image:3.595.58.265.62.314.2]respectively, otherwise
1, if only one VM replica is located in either node or node , otherwise = 0.
Synchronization traffic between VM replicas located in nodes and , respectively.
The clouds power consumption ( ) is composed of: 1) Power consumption of clouds servers:
2) Power consumption of clouds routers and switches:
The following parameters and variables represent the IP over WDM core network;
IP over WDM parameters:
Set of IP over WDM network nodes.
Indices of the end nodes of a physical link.
Indices of the end nodes of a virtual link.
Set of neighbouring nodes of node .
Router port power consumption.
Transponder power consumption.
EDFA power consumption.
Optical switch power consumption in node .
Regenerator power consumption.
Number of wavelengths per fiber.
Wavelength bit rate.
Maximum span distance between two EDFAs.
Distance in kilometres between node pair .
Number of EDFAs between node pair
A = where is the reach of the EDFA. Number of regenerators between node pair Typically
= where is the reach of the regenerator.
IP over WDM network power usage effectiveness.
IP over WDM variables:
Number of wavelengths in virtual link ( .
Number of wavelengths in physical link .
Number of router ports in node that aggregate the traffic from clouds.
Number of router ports in node that aggregate the traffic to clouds.
Number of router ports in node that aggregate the traffic to users.
Number of fibers on physical link .
Amount of traffic flow between node pair traversing virtual link
Number of wavelengths of virtual link traversing physical link
Under the non-bypass approach [11], the IP over WDM
network power consumption ( ) is
composed of:
1) The power consumption of routers ports:
2) The power consumption of transponders:
3) The power consumption of EDFAs:
4) The power consumption of optical switches:
5) The power consumption of regenerator:
The model is defined as follows:
The objective: Minimize total power consumption given as:
Subject to:
Placing VMs in clouds constraints:
Constraints (9) and (10) relate the binary variable that indicates whether a VM is hosted in a cloud or not ( ) to the traffic between users of this VM and the cloud
( ) by setting if
and otherwise. Clouds locations constraints:
Constraints (11) and (12) ensure that a cloud is built in core nodes selected to host VMs by setting
if and otherwise.
Clouds workload constraint:
M
Constraint (13) calculates the workload of a VM replica in a cloud as a linear function of the traffic resulting from serving users of the replica with a minimum CPU usage. Constraint (14) calculates the total workload of a cloud by summing the workload of VMs hosted in it.
Number of servers in a cloud:
Constraint (15) calculates the number of servers in each cloud based on the CPU utilization as the CPU draws the largest proportion of the server power consumption [12].
Traffic demand between cooperating VMs:
and
Constraints (16) to (22) represent the traffic demand between different cooperating VMs ( ). Constraint (16) ensures that if VM is located in node , VM is located in node and there is a cooperation traffic between them (i.e. , otherwise
Constraints (17) and (18) ensure that if there is at least one cooperation traffic between VMs located at any node and located at
node ( , otherwise .
Constraint (19) ensures that only one replica of VM is selected to cooperate with VM at node . Constraint (20) ensures that the node selected to provide VM with cooperation traffic from VM contains a replica of which is indicated by variable . The aim of constraints (17) to (20) is to ensure that each replica of a VM receives cooperation only from a single replica of
VM . Constraint (21) calculates the cooperation traffic between VMs and , if they are located in different nodes, whereas, Constraint (22), calculates the cooperation traffic between VMs, if they are located in the same node.
VM replicas synchronization traffic:
Constraints (23) and (24) represent the synchronization traffic among VM replicas. Constraint (23) ensures that =1 if VM replicas are located in node and node , respectively, otherwise Constraint (24) calculates the synchronization traffic sent by VM replica in node to another replicain node .
Cloud upload traffic:
Constraint (25) calculates the demands between the IP over WDM nodes by summing the VMs upload traffic due to users demand and inter-VM traffic
( and .
Cloud download traffic:
Constraint (26) calculates the VMs download traffic in node due to inter-VM traffic.
Number of routers and switches ports in clouds:
Constraint (27) calculates the number of routers ports in each cloud that aggregate upload and download traffic of each cloud. Constraint (28) calculates the number of switches ports in each cloud required for switching inter-VM traffic.
Flow conservation constraint in the IP layer:
L L
Constraint (29) represents the flow conservation for IP layer on the IP over WDM network. It ensures that the total incoming traffic equal the total outgoing traffic in all node; excluding the source and destination nodes.
Virtual link capacity constraint:
through a virtual link does not exceed its maximum capacity.
Flow conservation constraint in the optical layer:
Constraint (31) represents the flow conservation for the optical layer. It ensures that the total number of incoming wavelengths in a virtual link is equal to the total number of outgoing wavelengths in all nodes excluding the source and destination nodes of the virtual link.
Physical link capacity constraint:
Constraints (32) represent the physical link capacity limit. It ensures that the traffic flow in a link does not exceed the capacity of wavelengths in its fibres.
Total number of router aggregation ports in a core node:
Constraints (33)-(35) calculate the total number of router ports in each core node that aggregate the traffic from the clouds, to the clouds and to edge routers, respectively.
III. RESULTS AND DISCUSSIONS
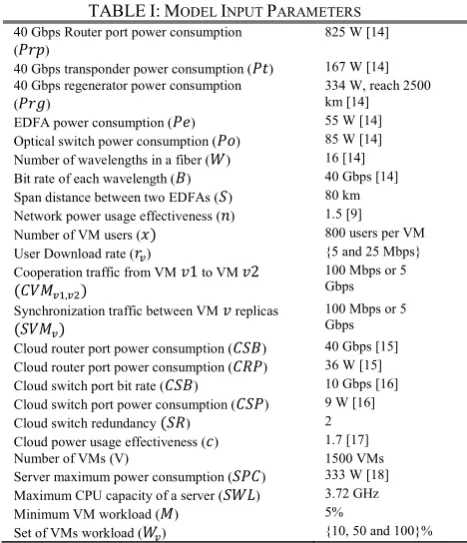
The NSFNET network, depicted in Fig. 4, is considered as an example of a core network topology to optimize the placement of 1500 VMs in clouds located in its core nodes. VMs users are uniformly distributed over the NSFNET 14 nodes. Each VM has 800 users. The users are considered to access the VMs with a download rate uniformly distributed between two data rates; 5 and 25 Mbps. The workload of serving the maximum number of users of VMs are uniformly distributed among three workloads: 10%, 50% and 100% of the server CPU capacity. VMs are considered to have a minimum CPU workload of 5% of the server CPU capacity in order to maintain the SLAs.
We consider each VM to cooperate with 50% of the other VMs selected randomly, whereas for VM replicas synchronization, all VM replicas exchange traffic. The placement is studied under two inter-VM traffic scenarios; low traffic of 100 Mbps and high traffic of 5 Gbps [7]. VMs in cloud datacenters are hosted in IBM Power System S814 server [13], which has eight cores of 3.72 GHz of IBM power8 processors, 128 GB memory, 96 GBps network bandwidth and 1.55 TB storage while consuming 333 Watt. In IP over WDM networks, we consider each router port operating at 40 Gbps while
consuming 825 W [14]. In cloud datacenter network, the Juniper MX204 router [15] is considered as an aggregation router, which can deliver up to 800 Gbps throughput while consuming 0.9 W/Gbps (36 watt for each 40 Gbps router port). The Juniper EX4550 Ethernet switch [16] is considered as cloud LAN switch with capacity of 960 Gbps and power rating of 9 W/10GbE interface. Table I shows the input data of our evaluation scenarios.
[image:6.595.59.283.322.428.2]In the following results, we compare the VMs placement and the power consumption associated with optimization scenarios considering cooperation and synchronization inter-VM traffic with those of optimizations scenarios ignoring them.
Fig. 4: NSFNET topology.
TABLEI:MODEL INPUT PARAMETERS
40 Gbps Router port power consumption ( )
825 W [14] 40 Gbps transponder power consumption ( ) 167 W [14] 40 Gbps regenerator power consumption
( )
334 W, reach 2500 km [14] EDFA power consumption ( ) 55 W [14] Optical switch power consumption ( ) 85 W [14] Number of wavelengths in a fiber ( ) 16 [14] Bit rate of each wavelength ( ) 40 Gbps [14] Span distance between two EDFAs ( ) 80 km Network power usage effectiveness ( ) 1.5 [9] Number of VM users ( 800 users per VM User Download rate ( ) {5 and 25 Mbps} Cooperation traffic from VM to VM 100 Mbps or 5
Gbps Synchronization traffic between VM replicas 100 Mbps or 5
Gbps Cloud router port power consumption ( ) 40 Gbps [15] Cloud router port power consumption ( ) 36 W [15] Cloud switch port bit rate ( ) 10 Gbps [16] Cloud switch port power consumption ( ) 9 W [16] Cloud switch redundancy ) 2 Cloud power usage effectiveness ( ) 1.7 [17] Number of VMs (V) 1500 VMs Server maximum power consumption ( ) 333 W [18] Maximum CPU capacity of a server ( ) 3.72 GHz Minimum VM workload ( ) 5%
Set of VMs workload ( ) {10, 50 and 100}%
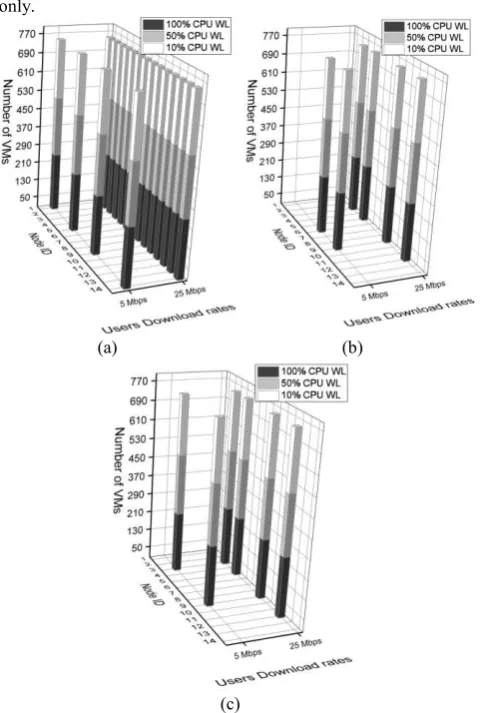
[image:6.595.310.544.353.625.2]traffic only (three replicas). This placement allows cooperation traffic between VMs of 25 Mbps (replicated everywhere) and VMs of 5 Mbps to traverse a maximum of single hop in the IP over WDM network. In (Fig 6 (b)), the existence of synchronization traffic has limited the number of replicas of each VM into two and four replicas under 5 and 25 Mbps download rates, respectively. The optimum placement when considering cooperation and synchronization traffic jointly (Fig. 6 (c)) is a trade-off between the placement in Fig. 6 (a) and (b) with the impact of synchronization traffic dominating.
Fig. 5: The optimal placement of VMs considering users traffic only.
(a) (b)
[image:7.595.307.540.51.191.2](c)
[image:7.595.100.224.189.356.2]Fig. 6: The optimal placement of VMs considering users traffic and 100 Mbps a) cooperation traffic, b) synchronization traffic, c) total inter-VM traffic.
Fig. 7: Power consumption associated with different VMs placement scenarios considering 100 Mbps inter-VM traffic
In Fig. 7, we study the potential increase in total power consumption resulting from optimizing the placement of VMs considering users download traffic only with scenarios where cooperation and synchronization exist in additional to users download traffic. The results show a limited increase of 1% in total power consumption if the VMs are placed considering users download traffic only (as seen in Fig. 5) in a scenario where users download, and cooperation traffic exist. The full replication of VMs of 25 Mbps (see Fig. 5) has confined the cooperation traffic among them to the intra datacenter network and hence the limited increase in total power consumption. However, not taking synchronization traffic into consideration when optimizing VMs placement has increased the total power consumption by 73%. This increase is mainly caused by the synchronization traffic among the fully distributed replicas of each VM of 25 Mbps download rate creating a full mesh traffic matrix traversing the IP over WDM network.
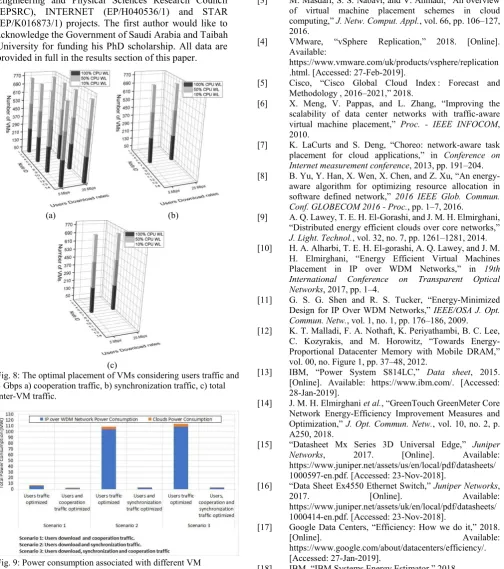
Fig. 8 shows the optimal VMs placement considering high inter-VM traffic. The placement under high cooperation traffic (Fig. 8 (a)) has resulted in four replicas of all VMs. These replicas are collocated so cooperation traffic is kept within the datacenter. Considering VMs synchronization traffic (Fig. 8(b)) has resulted in a single cloud placement as the synchronization traffic power consumption surpass the potential saving obtained by placing VM replicas closer to users premises. The same trend of single cloud placement is observed from considering both inter-VM traffic jointly (Fig. 8(c)). As shown in Fig. 9, placing VMs closer to the users without bearing in mind the existence of high inter-VM traffic (5 Gbps) causes the power consumption to increase by a factor of 39 compared to placing them based on the existence of inter-VM and users download traffic.
IV. CONCLUSION
[image:7.595.46.287.375.732.2]replicating VMs. Neglecting inter-VM traffic when placing VMs can mount up the total power consumption by a factor of 39 for VMs with an inter-VM traffic data rate of 5 Gbps.
ACKNOWLEDGMENTS
The authors would like to acknowledge funding from the Engineering and Physical Sciences Research Council (EPSRC), INTERNET (EP/H040536/1) and STAR (EP/K016873/1) projects. The first author would like to acknowledge the Government of Saudi Arabia and Taibah University for funding his PhD scholarship. All data are provided in full in the results section of this paper.
(a) (b)
[image:8.595.49.554.137.707.2](c)
[image:8.595.51.292.204.515.2]Fig. 8: The optimal placement of VMs considering users traffic and 5 Gbps a) cooperation traffic, b) synchronization traffic, c) total inter-VM traffic.
Fig. 9: Power consumption associated with different VM placement scenarios considering 5 Gbps inter-VM traffic.
REFERENCES
[1] Cisco Systems, “Global 2021 Forecast Highlights,” 2017. [2] Vmware, “Virtualization Essentials,” 2014. [Online].
Available:
http://www.vmware.com/content/dam/digitalmarketing/v mware/en/pdf/ebook/gated-vmw-ebook-virtualization-essentials.pdf. [Accessed: 22-Mar-2019].
[3] M. Masdari, S. S. Nabavi, and V. Ahmadi, “An overview of virtual machine placement schemes in cloud computing,” J. Netw. Comput. Appl., vol. 66, pp. 106–127, 2016.
[4] VMware, “vSphere Replication,” 2018. [Online]. Available:
https://www.vmware.com/uk/products/vsphere/replication .html. [Accessed: 27-Feb-2019].
[5] Cisco, “Cisco Global Cloud Index : Forecast and
Methodology , 2016–2021,” 2018.
[6] X. Meng, V. Pappas, and L. Zhang, “Improving the scalability of data center networks with traffic-aware
virtual machine placement,” Proc. - IEEE INFOCOM, 2010.
[7] K. LaCurts and S. Deng, “Choreo: network-aware task placement for cloud applications,” in Conference on Internet measurement conference, 2013, pp. 191–204. [8] B. Yu, Y. Han, X. Wen, X. Chen, and Z. Xu, “An energy
-aware algorithm for optimizing resource allocation in
software defined network,” 2016 IEEE Glob. Commun. Conf. GLOBECOM 2016 - Proc., pp. 1–7, 2016.
[9] A. Q. Lawey, T. E. H. El-Gorashi, and J. M. H. Elmirghani,
“Distributed energy efficient clouds over core networks,”
J. Light. Technol., vol. 32, no. 7, pp. 1261–1281, 2014.
[10] H. A. Alharbi, T. E. H. El-gorashi, A. Q. Lawey, and J. M.
H. Elmirghani, “Energy Efficient Virtual Machines Placement in IP over WDM Networks,” in 19th International Conference on Transparent Optical Networks, 2017, pp. 1–4.
[11] G. S. G. Shen and R. S. Tucker, “Energy-Minimized
Design for IP Over WDM Networks,” IEEE/OSA J. Opt. Commun. Netw., vol. 1, no. 1, pp. 176–186, 2009.
[12] K. T. Malladi, F. A. Nothaft, K. Periyathambi, B. C. Lee,
C. Kozyrakis, and M. Horowitz, “Towards Energy
-Proportional Datacenter Memory with Mobile DRAM,”
vol. 00, no. Figure 1, pp. 37–48, 2012.
[13] IBM, “Power System S814LC,” Data sheet, 2015.
[Online]. Available: https://www.ibm.com/. [Accessed: 28-Jan-2019].
[14] J. M. H. Elmirghani et al., “GreenTouch GreenMeter Core
Network Energy-Efficiency Improvement Measures and
Optimization,” J. Opt. Commun. Netw., vol. 10, no. 2, p. A250, 2018.
[15] “Datasheet Mx Series 3D Universal Edge,” Juniper
Networks, 2017. [Online]. Available:
https://www.juniper.net/assets/us/en/local/pdf/datasheets/ 1000597-en.pdf. [Accessed: 23-Nov-2018].
[16] “Data Sheet Ex4550 Ethernet Switch,” Juniper Networks,
2017. [Online]. Available:
https://www.juniper.net/assets/uk/en/local/pdf/datasheets/ 1000414-en.pdf. [Accessed: 23-Nov-2018].
[17] Google Data Centers, “Efficiency: How we do it,” 2018.
[Online]. Available:
https://www.google.com/about/datacenters/efficiency/. [Accessed: 27-Jan-2019].
![Fig. 1(b)) [4]. This inter-VM traffic is a major contributor](https://thumb-us.123doks.com/thumbv2/123dok_us/1768479.130654/2.595.310.543.604.703/fig-b-inter-vm-traffic-major-contributor.webp)