This is a repository copy of
Simulation of an augmented reality application for driverless
cars in an edge computing environment
.
White Rose Research Online URL for this paper:
http://eprints.whiterose.ac.uk/143898/
Version: Accepted Version
Proceedings Paper:
Aljulayfi, AF and Djemame, K orcid.org/0000-0001-5811-5263 (2019) Simulation of an
augmented reality application for driverless cars in an edge computing environment. In:
2018 Fifth International Symposium on Innovation in Information and Communication
Technology (ISIICT). The Fifth International Symposium on Innovation in Information and
Communication Technology, ISIICT 2018, 31 Oct - 01 Nov 2018, Amman, Jordan. IEEE .
ISBN 9781538662243
https://doi.org/10.1109/ISIICT.2018.8651268
Copyright © 2018, IEEE. This is an author produced version of a paper published in the
Proceedings of the Fifth International Symposium on Innovation in Information and
Communication Technology (ISIICT). Uploaded in accordance with the publisher's
self-archiving policy.
[email protected] https://eprints.whiterose.ac.uk/
Reuse
Items deposited in White Rose Research Online are protected by copyright, with all rights reserved unless indicated otherwise. They may be downloaded and/or printed for private study, or other acts as permitted by national copyright laws. The publisher or other rights holders may allow further reproduction and re-use of the full text version. This is indicated by the licence information on the White Rose Research Online record for the item.
Takedown
If you consider content in White Rose Research Online to be in breach of UK law, please notify us by
Simulation of an Augmented Reality Application
for Driverless Cars in an Edge Computing
Environment
Abdullah Fawaz Aljulayfi School of Computing, University of Leeds, UK
Prince Sattam Bin Abdulaziz University, KSA [email protected]
Karim Djemame
School of Computing, University of Leeds, UK [email protected]
Abstract— Edge Computing (EC) has been gaining a lot of attention in recent years due to the Internet of Things (IoT) requirements which cannot be addressed by the cloud. It aims to move the computing capabilities and resources closer to the edge of the network to fulfil IoT requirements such as location awareness, and mobility support. Furthermore, EC applications scalability is affected by computational and network system parameters. Investigating the effect of these parameters will help support the design of future applications, especially with the massive growth in the number of IoT devices. This paper aims to simulate an augmented reality application for driverless cars in order to study the effect of computational and network system parameters in an edge environment. An extensive simulation-based investigation is carried out and recommendations are made for edge applications future design.
Keywords—Edge Computing, Augmented Reality, Driverless Cars, EdgeCloudSim.
I. INTRODUCTION
Cloud Computing (CC) is considered as an efficient technology to process data due to its computation power and capabilities [1]. These capabilities are used by applications such as the Internet of Things (IoT) devices. Furthermore, these applications have key requirements in order to perform their functions properly such as low latency, mobility support, location awareness [1]–[4]. However, these requirements cannot be addressed by CC only [1]. Several computing paradigms such as Edge Computing (EC), Fog Computing (FC), Mobile Edge Computing (MEC), and Cloudlet have recently emerged to support CC
in order to address edge applications’ requirements.
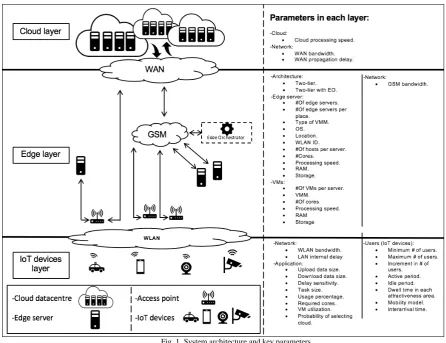
EC is the paradigm which aims to perform computation tasks at the edge of the network on downstream data on behalf of cloud services and upstream data on behalf of IoT services [1]. It refers to any computational and network resources which are located between the data sources and the Cloud Datacentre (DC) [1]–[6]. Furthermore, the edge architecture is composed of three main layers which are IoT devices-, edge-, and cloud-layers as shown in Figure 1.
Yet, EC is still in its infancy and consequently brings a number of research questions, e.g. in relation to applications’ performance. Driverless cars have also brought the attention of researchers due to their reliance on EC. Such safety critical systems are constantly sensing and sending data on weather, road conditions, GPS and surrounding vehicles. EC reduces the strain on the CC as it makes these cars more capable of processing and finding, e.g. patterns in sensors data, which can be up to 1GB per second. Therefore, the primary purpose of this paper is to simulate an augmented reality application for driverless cars in order to study the effect of computational and network parameters on the scalability of two different edge architectures: two-tier and two-two-tier with Edge Orchestrator (EO). The impact of these parameters is significant as it may lead to task failure as well as affect the performance of the application due to e.g. the delay in getting the required services. Therefore, studying this impact is crucial to find possible solutions to help overcome such issues.
The remaining of this paper is organized as follows: section II reviews the most related work on edge computing applications performance. Section III presents the use case requirements including the adopted research methodology, the system architecture, and the scenarios. In section IV, we present the experiments’ design including experiments’ assumptions, design, implementation, and evaluation metrics. Section V presents and discusses the results. Section VI which discusses the
investigation’s main findings and provides some recommendations for edge applications and their future design. Finally, section VII concludes the paper and presents future work.
II. RELATED WORK
Pace et al. [6] investigated the effect of three different deployment which are edge deployment (i.e. Raspberry Pi3 and Zotac NANO PC) and cloud deployment (i.e. Microsoft Azure Cloud) on two different healthcare scenarios. These scenarios are workers in a factory and athletes training in a fitness centre. Their results show that the processing time in every load condition (i.e. active users) for Nano PC and Azure Cloud are shorter than Raspberry Pi3. Additionally, the processing time is affected by the size of generated data. The findings show that the use of edge deployments reduces the Round Trip Time (RTT) to more than half as compared with Azure Cloud. The results of this investigation agree with another study performed by Slabicki and Grochla [7].
Premsankar et al. [8] examined the impact of using cloud resources on the performance of mobile gaming using the GamingAnywhere cloud gaming platform. The results show that the cloud deployment has higher latency than the edge for both access technologies LTE (Long Term Evolution) and Wi-Fi. In the experiment, different cloud deployments are used: a special-purpose cloud and two Amazon EC2 (Elastic Compute Cloud) commercial public cloud DCs, located in Germany and Ireland, respectively. The results show that the special purpose cloud provides lower latency as compared with others. It also shows that EC2 Ireland has the highest network delay in both LTE and Wi-Fi.
Sonmez et al. [5] studied the impact of using edge only on the performance of a face recognition application using the EdgeCloudSim simulator [9]. The findings show that when the number of end devices increases, the Local Area Network (LAN) delay increases due to network congestion. Therefore, the average failed tasks due to device mobility and service time increases too. Additionally, the study examined the effect of task size. The results indicate that if the task size is large, the architecture provides the worst service time due to the limitation of the resources.
Another experiment is executed on the modified CloudSim simulator in order to evaluate the performance of the face recognition application [10]. This evaluation highlights the performance in terms of failed tasks, service time, and Virtual Machines (VM) utilization. The difference here is the use of Cloudlets instead of edge servers. The findings show the increase of the number of devices leads to an increase in both service time and failed tasks. Furthermore, the VM capacity is considered as another reason that cause failed tasks in the event of an increase of the number of end devices. From these studies we can conclude that the number of end devices and the VM capacity have a significant impact on the LAN delay and tasks failures.
[image:3.595.78.525.51.394.2]The two-tier architecture refers to the use of both edge- and cloud-layers. The cloud will be used in case of either an edge node reaching its maximum capacity and not being able to handle incoming tasks, or a probability-based mechanism for selecting the cloud. Furthermore, this architecture provides better performance than single-tier architecture in some scenarios. Sonmez et al. [5] stated that two-tier architecture provides better LAN delay in case of a low number of mobile devices as compared with the single-tier because tasks will be offloaded to the cloud. However, the average failed tasks due to device mobility in both architectures are almost similar. This architecture also faces WAN delay in addition to the LAN delay which may lead to task failure. This research studied the effect of WAN bandwidth on this architecture. The results show that a decrease in WAN
bandwidth leads to an increase of the number of failed tasks. Similarly, this architecture is also affected by task size. For example, in case of small tasks size, the service time is longer than in the single-tier architecture. In case of large tasks size, both architectures exhibit almost the same performance for all load condition (i.e. number of users).
This layer is also studied by Sonmez et al. [10] which agrees with the previous research paper, in terms of service time and number of failed tasks. The authors claim that the two-tier architecture provides slightly better performance as compared with the single-tier. This research considered VM utilization as an extra performance metric. The study concludes that the VM utilization and the number of failed tasks due to VM capacity for both single- and two-tier-architectures are almost similar. Further research has been undertaken by Aazam et al. [11] in order to study the processing delay, processing cost, and processing capability. This research shows that the fog layer reduces the processing delay significantly in case of small tasks size. However, in case of large tasks size, the fog gives higher delay than the cloud because large tasks cannot be handled by fog nodes. Regarding the processing cost which is based on Google Cloud Platform, this research illustrates the trade-off between the processing delay and processing cost. It shows that if the processing power increases, the processing delay decreases. As a result, the cost increases.
Two-tier with EO architecture means that the workload will be distributed to other edge nodes or offloaded to the cloud. This architecture provides better performance than other architectures in terms for example of service time, number of failed tasks, and network delay. According to Sonmez et al. [5] [10], the two-tier with EO has a very low number of failed tasks in every load condition because the workload is distributed to all edge servers. Similarly, in case of large tasks size the service time of this architecture is the lowest. However, if the tasks size is small, the single-tier provides the best service time. Moreover, the LAN delay increases faster than in the other architecture when the load condition increases.
In term of VMs utilization, Sonmez et al. [10] argues that because of the ability to distribute the requests in this architecture, the utilization of VMs running on different edge servers is relatively constant. The authors also state that if the probability to offload tasks to the cloud is high, it will adversely affect the performance of this architecture due to the WAN delay. With regard to the network usage and delay, Gupta et al. [2] show that the network use and delay in case of edge deployment are lower than the cloud because the data is processed closer to the data source.
In this paper, the effect of network system and computational parameters on the scalability of two edge architectures will be investigated by simulating an augmented reality application for driverless cars. To the best of our knowledge, this is the first investigation that focuses primarily on the scalability issue.
III. USE CASE REQUIREMENTS
Before designing the experiments, the methodology that will be adopted to achieve the aim of the investigation and the use case requirements must be specified. In this section the methodology is discussed as well as the use case requirements, system architecture and scenarios.
A. Methodology
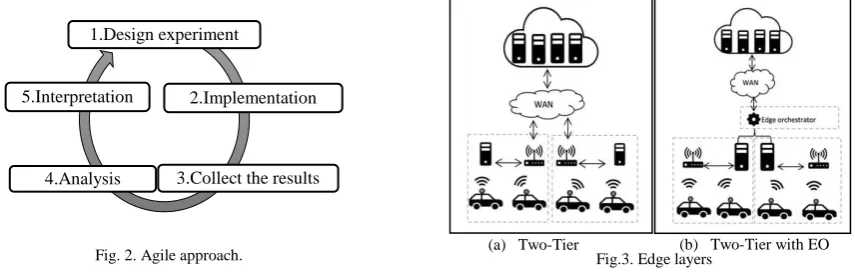
An Agile approach is adopted in order to achieve the aim. This approach allows performing a number of iterations over the experimental process as shown in Figure 2 which supports the design an initial experiment then the analysis and interpretation of the results. We can then design follow-up experiments in order to do further investigation.
B. System Architecture
EC is composed of three different layers: 1) IoT devices layer which includes all IoT devices; 2) Edge layer containing EO and all edge servers which are used to perform the tasks, and 3) Cloud layer, which refers to the cloud DC where the tasks can be offloaded in order to be performed on behalf of the edge servers. Furthermore, each architecture has a large number of parameters that need to be identified according to their importance in order to design the experiments. However, the system architecture is designed as well as the parameters that each layer needs are restricted based on the EdgeCloudSim simulator needs, which will be used to implement the experiments. The system architecture and the key parameters that are needed in each layer are shown in Figure 1.
The edge layer can be supported through three architectures (single-tier, two-tier, and two-tier with EO). The focus in this paper will be on two-tier and two-tier with EO only as shown in Figures 3a and 3b, respectively. The two-tier architecture means that the end devices (i.e. IoT devices or mobile users) either send their processing requests to the edge servers or the tasks will be forwarded to the cloud. The second architecture is two-tier with EO which is characterized by the ability to offload the tasks to other edge servers alongside the ability to offload the tasks to the cloud as well.
C. Scenarios
In our scenario, we assume that driverless cars move on the road and request service from edge servers in the form of analysis of video streaming in order to recognize the objects surrounding them such as people, animals, and trees. This means: 1) in case of a two-tier architecture, the video will be uploaded to either edge server or cloud. In case of two-tier with EO, the video can be offloaded to another edge server thanks to to use of EO alongside the ability of uploading the video to the cloud, 2) the video will be analysed for object recognition and identification, 3) the analysis result will be sent to the driverless car, and 4) the driverless car will take a decision based on the result.
The mobility of driverless cars takes place according to the nomadic mobility model which is by default used in the EdgeCloudSim simulator. This model means that driverless cars will move from one place to another after an amount of time has passed (i.e. this time will be specified later in the next section). Furthermore, in our scenario, there are two different location types which are straight road where the cars are most likely to spend a small amount of time and roundabout where the cars are most likely to spend more time as compared with a straight road. This specification is crucial in real scenarios because the time that cars spend in each location might have an effect on the number of failed tasks or how the task migration mechanism is chosen. It is also important in terms of the edge servers capacity located in each area. For example, in the straight road, the edge must process tasks quickly to avoid task failure because the cars may be moving fast and leave the area before the tasks are completed. So, such area needs edge servers with high processing speed.
IV. EXPERIMENTAL DESIGN
The design of the experiments considers key parameters in relation to scalability. Furthermore, this design will be iterative which means that an initial experiment will be designed, implemented, and then the results will be collected, analysed and interpreted. After that, follow-up experiments will be considered based on the initial experiment results for further investigation.
In the simulation, we will simulate the environment for 60 minutes. This is due to the inefficiency of the hardware environment not being able to load longer durations. However, this is not seen as a major limitation because a 60 minutes simulation duration is deemed long enough as it allows all important events in relation to architectural layers interaction to take place. Each load condition will be controlled by varying the number of driverless cars in the range [25-300] with a 25 increment.
A. Experiments’ Assumptions
In our scenario, we assume that large amount of data will be uploaded because the data in our scenario is video and small amount of data will be downloaded which is the analysis result. Therefore, we set the upload data size to 2000 Kilobytes (KB) and download data size to 30 KB. In addition to this, the object recognition application in driverless cars is time sensitive which requires low latency. So, the sensitivity of the delay will be very high and is specified by 95%. Additionally, we assume that driverless cars will be active for 60 seconds and idle for 1 second which means that sometimes some cars will not send any request to the edge server because it is in idle mode. In term of dwell time for each location type, in location type 1, we assume that, driverless cars are moving fast, so, the dwell time in this location will be 60 seconds. On the other hand, in location type two, the driverless cars are moving slow which means they will spend more time in this area, so, the dwell time will be 120 seconds. These assumptions help to provide more realistic scenarios. In Table I, the key simulation parameters are listed.
B. Experiments Design
1) Initial experiment: is designed as starting point to identify the parameters that need to be investigated. In this experiment, four augmented reality applications are considered in the EdgeCloudSim configuration file to stress the system. This approach also will be used in the following experiments.
2) Effect of edge servers: is designed to investigate the effect of increasing the number of edge servers in each attractiveness area. It also aims to investigate the effect of this increase on the initial experiment bottleneck. The number of edge servers that will be used in location type 1 is 4 and 8 edge servers in location type 2. Hypothesis 1: An edge servers increase reduces the percentage of failed tasks.
3) Effect of WLAN bandwidth: is designed to investigate the effect of increasing WLAN bandwidth on the initial
experiment’s bottleneck. In this experiment, the bandwidth capacity will be increased by 100 Mbps starting from 300 Mbps up to 500 Mbps.
4) Effect of VM processing speed: is designed to investigate the effect of VM processing speed on bottleneck that was recorded in the previous experiment. Three sub-experiments will be performed with different VM processing speed value. This
1.Design experiment
2.Implementation
3.Collect the results 4.Analysis
5.Interpretation
[image:5.595.93.521.249.388.2]value will be increased by 1000 Million Instructions Per Second (MIPS) starting from 1000 MIPS. Hypothesis 2: The increase of VM processing speed reduces the percentage of failed tasks.
5) Effect of WLAN bandwidth and VM processing speed: is designed to investigate the effect of increasing both WLAN bandwidth and VM processing speed on the bottleneck that was noticed in the previous experiments. Furthermore, this experiment is divided into three sub-experiments. In each sub-experiment, we will increase the VMs speed by 1000 MIPS and WLAN bandwidth by 100 Mbps to see their effect on the performance. Hypothesis 3: Increasing both WLAN bandwidth and VM processing speed will have a significant impact on the percentage of failed tasks.
C. Implementation
EdgeCloudSim simulator is adopted in order to implement the designed experiment which was proposed by Sonmez et al. [5]. It is installed on MacBook Pro machine which is running macOS High Sierra OS is 10.13.5 version. This MacBook has an Intel Core i5 processor and 8 Gigabyte memory.
D. Evaluation Metrics
A wide range of performance metrics are considered. These metrics are important to investigate the effect of the network and
computational parameters on the architectures’ scalability and identify the parameters that have significant impact. Furthermore, the use of a wide range of metrics helps to explain some phenomenal behavior in the results, as well as their relationship. These metrics are percentage of failed tasks, average network delay, and average processing time.
V. RESULTS AND DISCUSSION
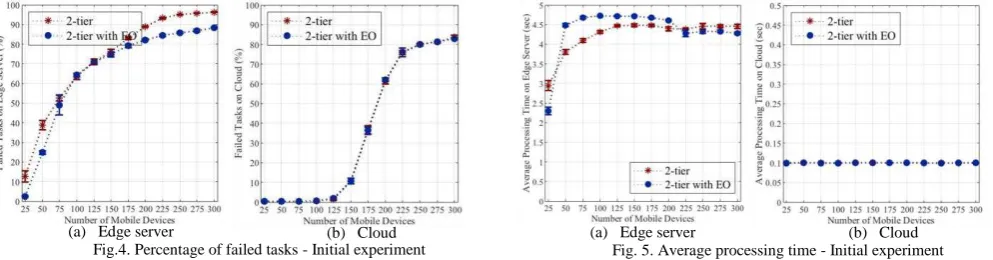
1) Initial experiment: the results show that the percentage of failed tasks on both edge servers and the cloud increase as long as the load condition increase as shown in Figure 4a and 4b, respectively. The growth in the percentage for the edge servers is faster than the cloud due limited resources located in the edge servers. Similarly, the average processing time in the edge server is longer than cloud due to the same reason as shown in Figure 5a and 5b, respectively. Additionally, however, the average network delay for WLAN is smaller than WAN which in relation with the cloud as shown in Figure 6a and 6b, respectively. This is because of the location of the edge servers which are located closer to the edge of the network where the IoT devices are located. In the same figure, the bottleneck can be recognized when the load condition is 200.
2) Effect of edge servers: the results reveal that adding more edge servers has significant impact on the scalability for both architectures. In case of the percentage of failed tasks, it is lower than initial experiment due to use more edge servers which helps to accept more requests and distribute the workload over more edge server as shown in Figure 7a. It also affects the percentage of failed tasks on the cloud because more edge servers reduce the number of tasks that offloaded to the cloud as shown in Figure 7b. Regards to the average network delay, remarkable improvement in the average as compared with initial
[image:6.595.50.547.553.683.2](a) Edge server (b) Cloud Fig. 5. Average processing time - Initial experiment Fig.4. Percentage of failed tasks - Initial experiment
(a) Edge server (b) Cloud TABLE I. KEY SIMUALTION PARAMETERS
Parameter (Unit) Value
Simulation time (minutes) 60
Upload data size (KB) 2000
Download data size (KB) 30
Minimum number of driverless cars 25
Maximum number of driverless cars 300
Interarrival time of task 2
Cloud processing speed (MIPS) 20000
Active period (second) 60
Idle period (second) 1
TABLE II. KEY PARAMETERS –INITIAL EXPERIMENT
Parameter (Unit) Value
Number of edge servers in location type 1 2
Number of edge servers in location type 2 4
Number of VMs per edge server 2
Edge VMs processing speed (MIPS) 1000
WLAN bandwidth (Mbps) 300
experiment as shown in figure 8a. Additionally, we can observe that the bottleneck that recorded that recorded in the initial experiment is not notable in both WLAN and WAN as shown in Figure 8a and 8b.
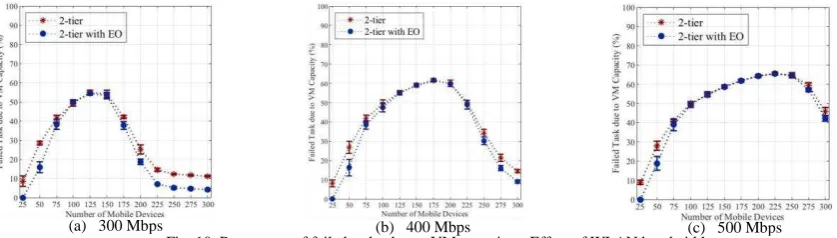
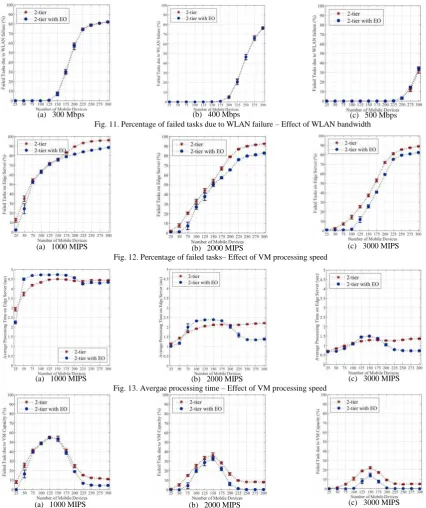
3) Effect of WLAN bandwidth: in this experiment as long as the WLAN bandwidth increases no significant improvement in the percentage of failed tasks is notable as compared with the initial experiment. Regards to the average WLAN delay, it decreases as long as the WLAN bandwidth increases as shown in Figure 9. Additionally, this increase limits and delays the appearance of the bottleneck. However, it is negatively impacting the VM utilization which increase tasks failure due to VM capacity. This explains why the percentage of failed tasks remained constant. Figure 10 and Figure 11 show the percentage of failed tasks due to VM capacity and WLAN failure, respectively.
4) Effect of VM processing speed: the results show that as long as the VM processing speed increases, the percentage of failed tasks slightly deceases in some load conditions. However, after 225 load condition, it seems constant as shown in Figure 12. Additionally, the importance of consuming other edge servers can be recognised in the two-tier with EO architecture which provides smaller percentage. Regards to the average processing time, significant improvement in the average can be noticed as compared with the initial experiment as shown in Figure 13.
(a) WLAN (b) WAN
Fig. 6. Average network delay - Initial experiment
(a) Edge server (b) Cloud Fig. 7. Percentage of failed tasks – Effect of edge server
(a) WLAN (b) WAN
Fig. 8. Average network delay – Effect of edge server
[image:7.595.84.503.641.760.2](a) 300 Mbps (b) 400 Mbps (c) 500 Mbps
Fig. 9. Average network delay – Effect of WLAN bandwidth
(a) 300 Mbps (b) 400 Mbps (c) 500 Mbps
Despite the large improvement in the processing time, there is no significant improvement in the percentage of failed tasks. Therefore, we would like to investigate this by evaluating the percentage of failed tasks due to VM capacity and WLAN failure. We found that the percentage of failed tasks due to the VM capacity decreases as long as the VM processing speed increases as shown in Figure 14 which shows the percentage of failed tasks due to VM when different VM processing speed values are used. In contrast, we found that as long as the VM processing speed increases, the percentage of failed tasks due to WLAN failure does not changed which means that WLAN reach its maximum capacity. We have also to keep in mind other factors may cause tasks failure such as WAN and mobility. Therefore, based on the results of these experiments and previous experiment, the next experiment will investigate the effect of scaling both WLAN bandwidth and VM processing speed.
5) Effect of WLAN bandwidth and VM proeccsing speed: in Figure 15, the percentage of the failed tasks is illustrated for all sub-experiment. 300 Mbps – 1000 MIPS, 400 Mbps – 2000 MIPS, and 500 Mbps – 3000 MIPS values are used in Figure 15a, 15b, and 15c, respectively. From these figures, the effect of both WLAN bandwidth and VM processing speed increase can be seen clearly. In Figure 15a, the percentage of failed tasks increases faster than other sub-experiments. In Figure 15b, the percentage of failed tasks also increases faster than the sub-experiment with 500 Mpbs – 3000 MIPS values. This finding confirms our expectation which was the increase in both WLAN bandwidth and VM processing speed will lead to improvement in the overall performance. If we compare the percentage of failed tasks for effect of WLAN bandwidth experiment, effect of
(b) 2000 MIPS
(a) 300 Mbps (b) 400 Mbps (c) 500 Mbps
Fig. 11. Percentage of failed tasks due to WLAN failure – Effect of WLAN bandwidth
Fig. 13. Avergae processing time – Effect of VM processing speed
[image:8.595.78.505.152.661.2](a) 1000 MIPS (b) 2000 MIPS (c) 3000 MIPS
Fig. 12. Percentage of failed tasks– Effect of VM processing speed
(b) 2000 MIPS (c) 3000 MIPS
(a) 1000 MIPS
Fig. 14. Percentage of failed tasks due to VM capacity– Effect of VM processing speed
VM processing speed experiment, and effect of WLAN and VM processing speed experiment, we can see that the when the increase in either WLAN bandwidth or VM processing speed was simulated, there was no significant impact on the performance. However, in case of both are increased, the performance improves. Another important finding is the improvement in the processing time and WLAN delay because there is no more congestion in the WLAN and no more overload on the VM.
VI. FINDINGS AND RECOMMENDATIONS
In this section the most important findings will be discussed first. Then, some recommendations for EC applications and their future design will be provided.
A. Findings
• Processing speed and network bandwidth relationship: The experiments show that there is a strong relationship between processing speed and network bandwidth. For example, if the VM processing speed is increased, that leads to congestion in the WLAN network, thus, the network delay increases. In contrast, if only the WLAN bandwidth is increased, the VMs cannot handle incoming requests because these requests come at fast rate, there are some tasks that already running on VMs, and the VMs do not have enough resources to handle these requests. Thus, the VMs utilization increases which leads to tasks failure due to VM limited capacity. In both cases, the increase in one of the parameters has a negligible impact on the overall performance. However, the increase in both parameters has a positive impact on the performance.
• Architecture scalability: Generally, we found that two-tier with EO is more scalable than two-tier and provides the lowest percentage of failed tasks and better processing time in case of high load conditions. However, the VMs in this architecture always have high utilization percentage because this architecture has the ability to utilize other edge servers resources thanks to the EO. Despite this feature, the percentage of failed tasks due to the VM capacity is lower that the two-tier architecture.
• Scalability parameters: Several parameters were investigated in order to show the parameters with a higher impact on
the scalability of the architectures, in other words what parameter helps improve the architectures’ scalability. This
ranking is based on the experiments’ results with keeping in mind it might differ when the application and scenario are changed. Furthermore, parameters are ranked starting from the parameter that improves the performance. Based on the overall percentage of failed tasks the parameters ranking will be as follows: 1) Increase both VM processing speed and WLAN bandwidth, 2) number of edge servers, 3) VM processing speed, 4) WLAN bandwidth.
B. Recommendations
• Applications and scenarios specifications: the applications and scenarios to be considered must be specified in detail. This specification helps to know the computational and network requirements such as network bandwidth, number of edge servers, and processing speed. This also includes the number of mobile devices and the type of mobility. For instance, some applications used by driverless cars are delay sensitive which means that any delay might cause an accident. Moreover, the percentage of failed tasks for some applications are critical. In another word, the percentage of failed tasks must be 0% and the delay must be as small as possible, especially with real time applications which require immediate decisions.
• Uploaded and downloaded data: the type of data that will be sent through the network must be specified. This helps to choose the best architecture as well as the bandwidth capacity. For instance, in healthcare applications two-tier with EO may not be the best because some other edge servers may not belong to the same organization. This may cause privacy violation of the patients and their data. In this case, either single- or two-tier -architectures is preferred.
• Provide computational resources based on the IoT devices locations: It is important to know the behaviour of IoT devices in term of mobility concept. This helps to provide enough resources that fulfil the IoT devices based on their location and the time they spend in each location.
• The use of EO: is very important to be used in the EC in order to consume other edge servers which helps to reduce the percentage of tasks sent to the cloud. However, we must consider the data sensitivity because some other edge servers will be belong other organisations.
Fig. 15. Percentage of failed tasks – Effect of WLAN bandwidth and VM processing speed
VII. CONCLUSION AND FUTURE WORK
In conclusion, the aim of this paper was to investigate the effect of some computational and network system parameters on the scalability of two different edge architectures by simulating a driverless cars environment that uses an object recognition application which is part of augmented reality. This investigation is important, especially for driverless cars because this environment is very sensitive and needs a deep investigation in order to provide the best system design. In order to achieve the paper’s aim, several experiments were designed and implemented using EdgeCloudSim simulator. In the design phase, key parameters were selected. Additionally, follow-up experiments were designed to perform further investigation. The experiments’ results that were generated by the simulator were analysed and interpreted. Based on this analysis and interpretation, several findings were discussed.
These findings can be summarised into two main points. The first point is the relationship between processing speed and bandwidth parameters. The increase in one of these parameters has a negatively impact on the other which means that to gain the benefit from scalability we have to increase both of them. The second point is the scalability. The findings show that two-tier with EO architecture is more scalable than two-tier due to that ability to consume other edge serves. In addition to these points, the investigated parameters were ranked starting from the most significant parameter which help to improve the scalability.
Further investigation is suggested because there are many other scalability parameters which are not covered in this paper. Similarly, several concepts need to be investigated such as cost and energy consumption.
REFERENCES
[1] W. Shi and S. Dustdar, “The Promise of Edge Computing,” IEEE Journals Mag., vol. 49, no. 5, pp. 78–81, 2016.
[2] H. Gupta, A. Vahid Dastjerdi, S. K. Ghosh, and R. Buyya, “iFogSim: A toolkit for modeling and simulation of resource management techniques in the Internet of Things, Edge and Fog computing environments,” Softw. - Pract. Exp., vol. 47, no. 9, pp. 1275–1296, 2017.
[3] P. G. Lopez, A. Montresor, D. Epema, A. Iamnitchi, and P. Felber, “Edge-centric Computing : Vision and Challenges,” ACM SIGCOMM Comput. Commun. Rev., vol. 45, no. 5, pp. 37–42, 2015.
[4] F. Bonomi, R. Milito, P. Natarajan, and J. Zhu, “Fog Computing: A Platform for Internet of Things and Analytics,” vol. 546, pp. 169–186, 2014. [5] C. Sonmez, A. Ozgovde, and C. Ersoy, “EdgeCloudSim: An environment for performance evaluation of Edge Computing systems,” 2017 2nd Int. Conf.
Fog Mob. Edge Comput. FMEC 2017, pp. 39–44, 2017.
[6] P. Pace, G. Aloi, R. Gravina, G. Caliciuri, G. Fortino, S. Member, A. Liotta, and S. Member, “An Edge-based Architecture to Support Efficient Applications for Healthcare Industry 4 . 0,” vol. 3203, pp. 1–8, 2018.
[7] M. Slabicki and K. Grochla, “Performance evaluation of CoAP, SNMP and NETCONF protocols in fog computing architecture,” Proc. NOMS 2016 - 2016 IEEE/IFIP Netw. Oper. Manag. Symp., pp. 1315–1319, 2016.
[8] G. Premsankar, M. Di Francesco, and T. Taleb, “Edge computing for the internet of things,” IEEE Netw., vol. 32, no. 1, pp. 6–7, 2018.
[9] C. Sonmez, “EdgeCloudSim,” GitHub.com, 2017. [Online]. Available: https://github.com/CagataySonmez/EdgeCloudSim. [Accessed: 26-Feb-2018]. [10] C. Sonmez, A. Ozgovde, and C. Ersoy, “Performance evaluation of single-tier and two-tier cloudlet assisted applications,” in IEEE International
Conference on Communications Workshops, ICC Workshops 2017, pp. 302–307, 2017,.