EUROPEAN COMMISSION
Brussels, 18.10.2010
SEC(2010) 1202 final
COMMISSION STAFF WORKING DOCUMENT
Accompanying document to the
REPORT FROM THE COMMISSION TO THE EUROPEAN PARLIAMENT, THE
COUNCIL, THE EUROPEAN ECONOMIC AND SOCIAL COMMITTEE AND THE
COMMITTEE OF THE REGIONS
SAPARD ANNUAL REPORT – YEAR 2009
ANNEX A – Financial Execution 2009
Table 1 - Execution of commitment appropriations available in the 2009 budget
by 31.12.2009
(million EUR)
Budget lines
Budget
2009 transfers
total
available executed % comments
1 2 3 4 5 6=5/4 7
05.050101 - - - - -
05.050102 - - - - -
05.010403 0,2 - 0,2 0 0
TOTAL 0,2 0 0,2 0 0
Table 2 - Execution of payment appropriations available in the 2009 budget
by 31.12.2009
(million EUR)
Budget lines
Budget
2009 transfers
total
available executed % comments
1 2 3 4 5 6=5/4 7
05.050101 390,7 - 390,7 254,1 65,0
Additional appropriations of EUR 165,3 million available at 31.12.2008
have been carried over to the 2009 budget.
05.050102 - - - - -
No payments from the Commission (programmes closed, last final
payments made in 2008).
05.010403 0,2 - 0,2 0 0
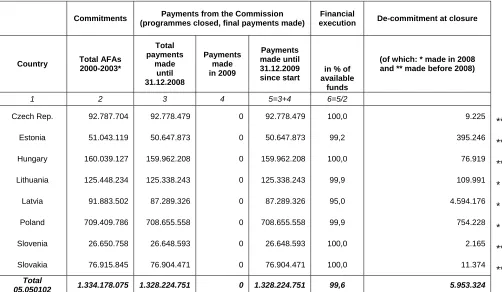
ANNEX A – Financial Execution 2009
Table 3 - Commitments, payments and RAL by 31.12.2009
Commitments Payments from the Commission
(advances and reimbursements)
Financial
execution "Reste à liquider" (RAL)
Country Total AFAs 2000-2006 (including de-commitments for Bulgaria) Total payments made until 31.12.2008 Payments made in 2009 Payments made until 31.12.2009 since start
in % of available
funds
1 2 3 4 5=3+4 6=5/2 7=2-5
Bulgaria 371.409.686 265.183.315 62.430.464 327.613.779 88,2 43.795.907
Romania 1.159.785.692 843.538.370 187.195.446 1.030.733.816 88,9 129.051.876
Croatia 25.000.000 9.483.059 4.477.174 13.960.233 55,8 11.039.767
Total
05.050101 1.556.195.378 1.118.204.744 254.103.084 1.372.307.828 88,2 183.887.550
Commitments Payments from the Commission
(programmes closed, final payments made)
Financial
execution De-commitment at closure
Country Total AFAs
2000-2003* Total payments made until 31.12.2008 Payments made in 2009 Payments made until 31.12.2009 since start
in % of available
funds
(of which: * made in 2008 and ** made before 2008)
1 2 3 4 5=3+4 6=5/2
Czech Rep. 92.787.704 92.778.479 0 92.778.479 100,0 9.225
**
Estonia 51.043.119 50.647.873 0 50.647.873 99,2 395.246
**
Hungary 160.039.127 159.962.208 0 159.962.208 100,0 76.919
**
Lithuania 125.448.234 125.338.243 0 125.338.243 99,9 109.991
*
Latvia 91.883.502 87.289.326 0 87.289.326 95,0 4.594.176
*
Poland 709.409.786 708.655.558 0 708.655.558 99,9 754.228
*
Slovenia 26.650.758 26.648.593 0 26.648.593 100,0 2.165
**
Slovakia 76.915.845 76.904.471 0 76.904.471 100,0 11.374
**
Total
ANNEX B
Table B.1
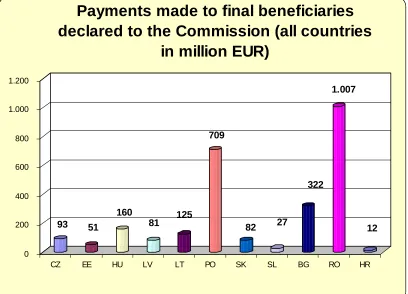
93
51
160
81
125
709
82
27
322
1.007
12
0 200 400 600 800 1.000 1.200
CZ EE HU LV LT PO SK SL BG RO HR
Payments made to final beneficiaries
declared to the Commission (all countries
[image:4.595.95.503.123.417.2]in million EUR)
Table B.2
1.685 1.531
866 1.808
906
562
24.457
2.640 2.615
4.451
37
0
5.000
10.000
15.000
20.000
25.000
CZ
EE
LT
LV
SK
SI
PO HU
BG RO HR
ANNEX B
Table B.3
34% 93% 28% 94% 23% 95 % 8% 87 % 2% 75 % 2% 92 % 0%3% 75%
0% 5% 10% 15% 20% 25% 30% 35%
Rural Inf rast ruct ure Pr ocessing & Mar ket ing
Farm Invest ment s Diversif icat ion Forest ry Renovat ion of Villages
Set t ing up of producer groups
Ot hers
All Countries. Distribution of Sapard Allocations
between Measures and Expenditure per Measure (%)
Allocation per measure as a % of total allocation EU expenditure per measure as a % of measure allocation
Table B.4
32%
10 3%30%
10 1%23%
100%9%
91%
0%
2%
104%0%
4%
77% 0% 5% 10% 15% 20% 25% 30% 35% Rur al Inf r ast r uct ur ePr ocessing & Mar ket ing
Far m Invest ment s
Diver sif icat ion For est r y Renovat ion of Villages
Set t ing up of pr oducer
gr oups
Ot her s
Eight new Member States. Distribution of
Sapard Allocations between Measures and
Expenditure per Measure (%)
ANNEX B
Table B.5
36%
86
%
27%
88%
22%
90%
7%
82%
4%
75%
2%
83%0%
2%
74%0% 5% 10% 15% 20% 25% 30% 35% 40%
Rur al Inf r ast r uct ur e
Pr ocessing & Mar ket ing
Far m Invest ment s Diver sif icat ion For est r y Renovat ion of Villages
Set t ing up of pr oducer gr oups
Ot her s
Bulgaria, Romania and Croatia. Distribution of
Sapard Allocations between Measures and
Expenditure per Measure (%)
ANNEX C.1 – BULGARIA
Table C.1.1
Bulgaria - EU Allocation, Contracted and Paid amount to Final Beneficiaries
since the Start of the Programme in million EUR. Situation up to 31.12.2009
0 50 100 150 200 250 300 350 400 450 500 31/12/ 1999 30/04/ 2000 31/08/ 2000 31/12/ 2000 30/04/ 2001 31/08/ 2001 31/12/ 2001 30/04/ 2002 31/08/ 2002 31/12/ 2002 30/04/ 2003 31/08/ 2003 31/12/ 2003 30/04/ 2004 31/08/ 2004 31/12/ 2004 30/04/ 2005 31/08/ 2005 31/12/ 2005 30/04/ 2006 31/08/ 2006 31/12/ 2006 30/04/ 2007 31/08/ 2007 31/12/ 2007 30/04/ 2008 31/08/ 2008 31/12/ 2008 31/04/ 2009 31/08/ 2009 31/12/ 2009 M illio n s A m o unt o f E U c o nt ri but io n
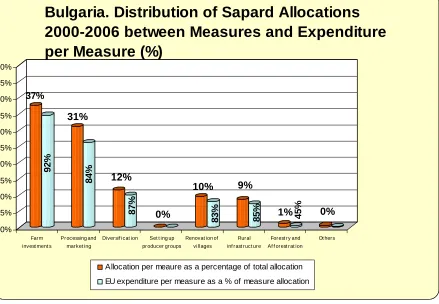
ANNEX C.1 – BULGARIA
Table C.1.2
92%
31%
84%
12%
87%
0%
10%
83%
9%
85%
1%
45%
0%
0% 5% 10% 15% 20% 25% 30% 35% 40% 45% 50%
Far m invest ment s
Pr ocessing and market ing
Diversif icat ion Set t ing up pr oducer gr oups
Renovat ion of villages
Rural inf r ast r uct ure
Forest ry and Af f or est r at ion
Ot hers
Bulgaria. Distribution of Sapard Allocations
2000-2006 between Measures and Expenditure
per Measure (%)
Allocation per meaure as a percentage of total allocation EU expenditure per measure as a % of measure allocation
37%
Table C.1.3
Contracted amount by type of Production
in Bulgaria under the Measure "Farm
Investments" (in % at 31.12.2009)
Others 2%
Wine 13%
Animal Producti on and
Products 39%
Fruit, Vegetables and Berries
17% Arable Crops
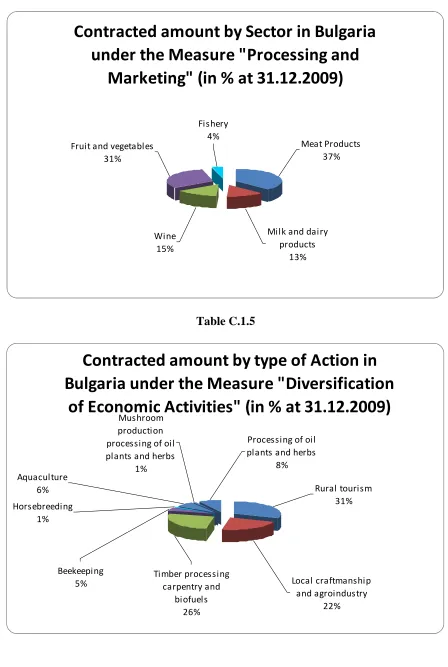
[image:8.595.81.520.133.437.2]ANNEX C.1 – BULGARIA
Table C.1.4
Contracted amount by Sector in Bulgaria
under the Measure "Processing and
Marketing" (in % at 31.12.2009)
Meat Products
37%
Milk and dairy
products
13%
Wine
15%
Fruit and vegetables
31%
Fishery
4%
Table C.1.5
Contracted amount by type of Action in
Bulgaria under the Measure "Diversification
of Economic Activities" (in % at 31.12.2009)
Aquaculture
6%
Processing of oil
plants and herbs
8%
Mushroom
production
processing of oil
plants and herbs
1%
Horsebreeding
1%
Beekeeping
5%
Timber processing
carpentry and
biofuels
26%
Local craftmanship
and agroindustry
22%
Rural tourism
[image:9.595.82.517.133.437.2]ANNEX C.2 – ROMANIA
Table C.2.1
Romania - EU Allocation, Contracted and Paid amount to Final Beneficiaries
since the Start of the Programme in million EUR. Situation up to 31.12.2009
0 100 200 300 400 500 600 700 800 900 1.000 1.100 1.200 31/12/19 99 30/04/20 00 31/08/20 00 31/12/20 00 30/04/20 01 31/08/20 01 31/12/20 01 30/04/20 02 31/08/20 02 31/12/20 02 30/04/20 03 31/08/20 03 31/12/20 03 30/04/20 04 31/08/20 04 31/12/20 04 30/04/20 05 31/08/20 05 31/12/20 05 31/04/20 06 31/08/20 06 31/12/20 06 30/04/20 07 31/08/20 07 31/12/20 07 30/04/20 08 31/08/20 08 31/12/20 08 30/04/20 09 31/08/20 09 31/12/20 09 M ill io n s A m o u n t of E U c o nt ri bu ti o n
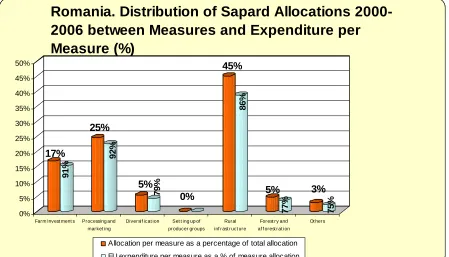
ANNEX C.2 – ROMANIA
Table C.2.2
17%
91%
25%
92%
5%
79
%
0%
45%
86
%
5%
77
%
3%
75
%
0% 5% 10% 15% 20% 25% 30% 35% 40% 45% 50%
Far m Invest ment s Pr ocessing and mar ket ing
Diver sif icat ion Set t ing up of pr oducer gr oups
Rur al inf r ast r uct ur e
For est r y and af f or est r at ion
Ot her s
Romania. Distribution of Sapard Allocations
2000-2006 between Measures and Expenditure per
Measure (%)
Allocation per measure as a percentage of total allocation
[image:11.595.90.509.205.694.2]EU expenditure per measure as a % of measure allocation
Table C.2.3
Contracted amount by type of Production in
Romania under the Measure "Farm
Investments" (in % at 31.12.2009)
Animal
Production and
Products
44%
Fruit and
vegetables and
Berries
6%
Arable crops
47%
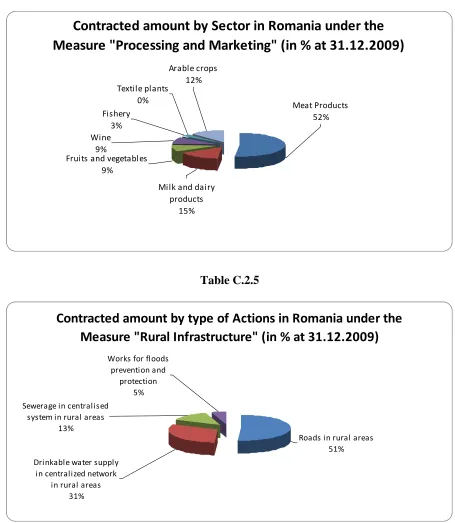
ANNEX C.2 – ROMANIA
Table C.2.4
Contracted amount by Sector in Romania under the
Measure "Processing and Marketing" (in % at 31.12.2009)
Textile plants
0%
Arable crops
12%
Wine
9%
Fruits and vegetables
9%
Milk and dairy
products
15%
Meat Products
52%
Fishery
[image:12.595.77.524.127.362.2]3%
Table C.2.5
Contracted amount by type of Actions in Romania under the
Measure "Rural Infrastructure" (in % at 31.12.2009)
Works for floods prevention and
protection 5% Sewerage in centralised
system in rural areas 13%
Roads in rural areas 51% Drinkable water supply
in centralized network in rural areas
ANNEX C.3 – CROATIA
Table C.3.1
Croatia - EU Allocation, Contracted and Paid amount to Final Beneficiaries
since the Start of the Programme in million EUR. Situation up to 31.12.2009
0 5 10 15 20 25 30 31/12/ 2005 28/02/ 2006 30/04/ 2006 30/06/ 2006 31/08/ 2006 31/10/ 2006 31/12/ 2006 28/02/ 2007 31/04/ 2007 30/06/ 2007 31/08/ 2007 31/10/ 2007 31/12/ 2007 28/02/ 2008 30/04/ 2008 30/06/ 2008 31/08/ 2008 31/10/ 2008 31/12/ 2008 28/02/ 2009 30/04/ 2009 30/06/ 2009 31/08/ 2009 31/10/ 2009 31/12/ 2009 Millio n s A m ount of E U c o nt ri b u ti on
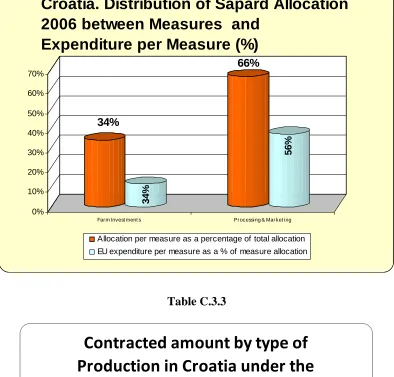
ANNEX C.3 – CROATIA
Table C.3.2
34%
34
%
66%
56
%
0% 10% 20% 30% 40% 50% 60% 70%
Farm Invest ment s Pr ocessing & Mar ket ing
Croatia. Distribution of Sapard Allocation
2006 between Measures and
Expenditure per Measure (%)
[image:14.595.122.476.461.675.2]Allocation per measure as a percentage of total allocation EU expenditure per measure as a % of measure allocation