A FRAMEWORK FOR MODELLING, SIMULATION AND CONTROL OF INTEGRATED URBAN WASTEWATER SYSTEMS
M R Katebi and F P Graells
Industrial Control Centre, Department of Electronic and Electrical Engineering University of Strathclyde, Glasgow, G1 1QE, UK
Email: [email protected]
Abstract: This paper is concerned with the integrated modelling, and control of urban wastewater systems (UWS) comprising the wastewater treatment plants (WTP), receiving waters (river) and the sewer networks. A unified framework is developed and simple models are used and implemented in Matlab/Simulink to produce a toolbox. Novel linear and nonlinear control structures are then proposed to design integrated control systems to improve the river water quality. A case study is simulated and simulation results are presented to demonstrate the possible improvement that can be achieved using a holistic integrated control system approach. Copyright @IFAC2005
Key Word: Integrated Control, Modelling, Wastewater, Nonlinear Control, Environment
1. INTRODUCTION
The water system to be studied is that of an urban area near a river, which has a combined sewer system that transports domestic waste and rainwater. The water from rainfall events runs through the surface until it is gathered by the drainage system in pipes and mixed with the domestic waste. A pipe network transports the flow until it is discharged into the main trunk, which connects to the activated sludge waste water treatment plant (WWTP) to degrade the oxygen demanding matter before it is discharged into the river. The system is comprises the catchment area, sewer system, WWTP and receiving water body (river).
This paper is concerned with the study of an integrated control system for the whole system in order to minimise the effect of pollutants on the receiving body. Pollutants as classified by (Reda, 1996) can arise from different biological, chemical or physical state of the wastewater. These pollutants are
discharged into the receiving water body at different duration and frequencies and can be continuous, intermittent, seasonal or transient events. The pollution control is further complicated by the nature and location of the discharge to the system. The point discharge sources are usually well defined while the diffuse sources are more complicated to control. In addition, the control system should cope with the time-varying nature of the pollutant as disturbances, which can have short transient such as storm events and the long term ones which continuously disturb the system.
potential of using integrated control to improve river water quality (Schütze, et al, 2002).
To exploit the control technology, the systems needs to be equipped with appropriate sensors and actuators. The current urban water system suffers from poor instrumentation and in particular, actuation system is scarce and expensive to build. The idea exploited here is to use the WWTP as an actuator unit to affect the behaviour of the pollutant in the receiving water. Modern WWTPs are nowadays well instrumented and their dynamic behaviour can be reasonably controlled. In particular the control problem studied in this paper is to manipulate the return activated sludge and influent flow in order to maintain a desired DO level in a receiving river. The transient pollution events caused by discharges from CSOs and the WWTP during or after a rain event are modelled to study the DO depletion effect. To achieve this objective a unified modelling framework is defined and novel control methods are proposed and investigated. This model is kept simple since for real time control, a detailed model is computationally expensive and unreliable. The different integrated control strategies are then studied to improve the river water quality.
2. SYSTEM DESCRIPTION
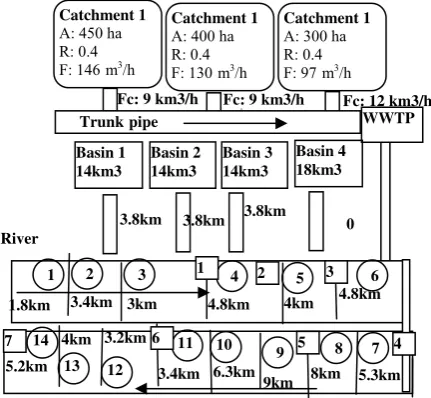
The catchment comprises an urban area of about 1150 hectares and a population of 150,000. It has been split in three sub-catchments, each of which discharges into the main trunk at a different point (Fig.1). The main trunk connects the three sub-catchments with the treatment plant. At each discharge point into the main trunk, there is a basin with an overflow structure. In addition, another basin has been constructed close to the treatment plant in order to provide a suitable inflow to the treatment plant. The main trunk is composed of three stretches. The treatment plant is represented by an activated sludge reactor and a secondary clarifier.
The river is assumed to have similar geometric and hydraulic characteristics to the Bedford-Ouse River (Whitehead et al, 1979). Base flow and fractions at up-stream river are 18000 m3/hr with DO of 9 mg/l. The stretch of the river that is studied is 55 km long. The river is divided into 14 reaches. The geometric and hydraulic characteristics of the river are considered constant within a reach.
3. INTEGRATED MODELS
An integrated model comprises: sewer system, wastewater treatment plant and the receiving water body modules. There are a number of software for simulating each subsystem and some platforms now providing integrated modelling. Most of these packages are however aimed at system design and analysis and may be used off-line as supervisory control tools. There has been effort to integrate these
[image:2.595.306.522.95.294.2]individual software systems by developing appropriate interfaces (Rauch et al, 1998). The models used for each sub-system usually are complex
Fig. 1 An example of urban wastewater system
WWTP
Basin 1 14km3
Trunk pipe
3.8km 3.8km 3.8km
River
Fc: 9 km3/h Fc: 9 km3/h
3 Fc: 12 km3/h
0
1.8km 3.4km 3km 4.8km 4km
5.3km 8km 9km 6.3km 3.4km 3.2km 4km
5.2km 1
10
2 3 4 5 6
7 8 9 11
12 13 14
4.8km
1 2 3
5 6
7
Catchment 1
A:450 ha R: 0.4 F: 146m3/h
Catchment 1
A:400 ha R: 0.4 F: 130m3/h
Catchment 1
A:300 ha R: 0.4 F: 97m3/h
Basin 2 14km3
Basin 3 14km3
Basin 4 18km3
4
and their parameters hardly identifiable for real time control applications.
In this paper, a MATLAB toolbox of simple models is developed which are appropriate for the real time control of urban wastewater system. The criteria for the selection of the mathematical equations to be employed are to choose those that provide a reasonable trade-off between accurate description of the reality and simplicity of the model (James, 1993). The validation and calibration of the model will not be carried out in this work. Each model is now briefly described
River Model: The control objective is to improve the
river water quality. It is necessary, therefore, to define the river processes and variables which model the pollution mechanisms in the river, and later, to construct the models for the up-stream sub-systems that provide the inputs needed by the river module. The pollution effect to be studied is the DO depletion caused by the discharges from the sewer system and the treatment plant during and immediately after storm events. The degradation of the biodegradable organic matter discharged from CSOs during storm events and from the WWTP causes the concentration of DO in the river water to decay. This DO depletion seriously affects the flora and fauna in the river. Since this acute effect depends not only on the total amount of biodegradable organic matter discharged but also on the distribution in time of these discharges, a dynamic analysis of the problem must be done. Hence, the model must consider the dynamic loads from the sewer and the WWTP and must simulate the variation in time of the DO in the river water.
river and the mixing process. The model selected for the river is the CSTR (continuously stirred tank reactor) model. Although there are many other more complicated models, it has been decided to choose this one because its simplicity makes it more suitable for real time control. Moreover, despite its simplicity, the CSTR model reproduces satisfactorily the advection and dispersions characteristics in the river. A detailed description of the CSTR model can be found in Reda (1996). The four state variables defined in each tank are: Q(t): Outflow from the compartment [m3/h], XDO(t): Dissolved oxygen [mg/l], XBODR(t): BODR, rapidly biodegradable BOD (biologically organic degradable matter) [mg/l], XBODS(t): BODS, slowly biodegradable BOD [mg/l].
The approach used here for modelling the hydraulics in the stream flow is a combination of a simple deterministic model, which relates the flow variation in the river to input variations at the system boundary, and a stochastic time series model, used to enhance the model. At the discharge points, it is necessary to model the mixing process between the two or more influents. No dynamic equations have been used to model the mixing process, only algebraic equations. This means that the complete mixture between the influents is achieved immediately after the discharge point.
WWTP: The two main modules that the treatment
plant is composed of are the “Activated Sludge Tank Reactor” and the “Secondary Clarifier”. The model used in based on that from Nejjari et al (1997). In this model, the reactor is aerobic, hence, the reaction that takes place in it is the degradation of the biodegradable organic mater (also called substrate, S), by the micro-organisms (also called biomass, X) with the consumption of oxygen in the process. The secondary clarifier is integrated in the activated sludge system. Here, the biomass settles and separates from the water. The sludge, settled at the bottom. Part of this sludge is recycled to the reactor to keep the appropriate level of micro-organism concentration.
Sewer: The model chosen to simulate it is based on
the linear reservoir cascade concept (Marinaki, 2002). The sewer model comprises: trunk pipe, basin, node, and catchment area. The fractions considered are the same as in the treatment plant. In the basin structures, the volume and the overflow are also considered. The different units comprising the network are then modelled. Detailed description can be found in Marinaki, 2002. The maximum flow capacity of a trunk pipe is determined by the basin structure. No restrictions have been considered with regard to the maximum flow that it can convey.
Catchment module: The catchment area unit provides
the input to the urban wastewater system. This input consists of data series of flow and fraction concentrations from domestic wastes and storm water
Rainfall-runoff: This module models the relationship between the rainfall at the catchment area and the input flow to the main trunk of the sewer. Within the different approaches studied, the unit hydrograph has been selected for the model. This simple but very effective method is widely used in urban hydrology (Sherman in 1932). The rainfall data used are designed storms. Wanielista et al (1997), explains several methods to get synthetic hydrographs.
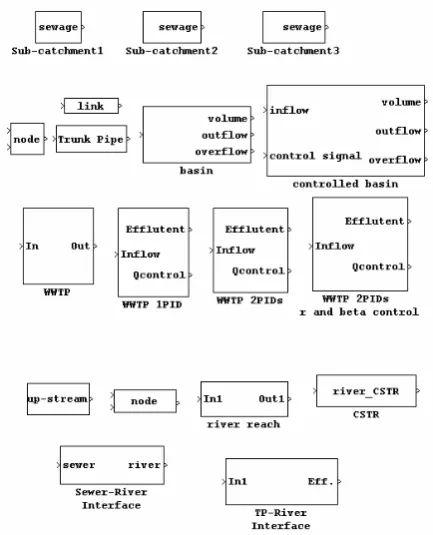
MATLAB Toolbox: Matlab/Simulink was used to
build a flexible and modular model of the system by creating a library of Simulink. These blocks can be combined to create different systems and their parameters can be edited in order to adjust it to the physical system to be studied. The blocks library consist of Catchment Blocks, Sewer Blocks, Treatment Plant Blocks, River Blocks and Interface Blocks as shown in Fig.2 .
The Runoff block is a ‘From Workspace’ block, which takes the runoff input data from the Matlab’s workspace variable. The Sewer Blocks comprises node, trunk pipe, link, basin and controlled basin. The WWTP models the activated sludge process with and without controls. The River Blocks comprises: up-stream, node, river reach and CSTR. The interface blocks are necessary to connect the sub-systems of different state variables. These are Sewer-River Interface and WWTP-River Interface.
4. INTEGARTED CONTROL SYSTEM
To improve the system performance two control loops are designed to control the concentrations of the fractions considered in the effluent of the treatment plant (substrate (S) and dissolved oxygen (DO)). Another problem observed from the simulations of rain events is that the biomass in the activated sludge reactor and the biomass in the recycled stream decay to very low values and they take a long time to recover the original state or, simply, they do not recover, if the rain event lasts very long. Therefore two more control loops are introduced to keep the concentration of biomass and recycled biomass in a reasonable range of values. The micro organisms are very sensitive to the variation of the conditions at the inlet stream: inflow, input substrate concentration and input dissolved oxygen concentration. In order to solve this problem, a control system that acts on the valves that regulate the recycled flow and the waste flow has been implemented. This control system adapts the hydraulics of the wastewater treatment plant to the conditions in the inlet flow. These are the biomass control loop and the recycled biomass control loop.
controller, whose output is the dilution rate of the process. However, some considerations about the control signal, the dilution rate of the process, must be taken into account. The dilution rate depends on the inflow to the treatment plant and the volume of the reactor. Since the volume is considered constant, the only way to control the dilution rate is through the inflow. Nevertheless, the inflow to the treatment plant, although it can be controlled by means of a pump or a gate, depends on the load of the sewer system. Hence, the desired dilution rate for the control action may not be always achievable. Since the dilution rate cannot be controlled directly, only by means of the inflow to the WWTP, it is necessary to implement a more integrated control system, which takes into account the hydraulic load of the sewer system.
Fig. 2 The Matlab/Simulink Toolbox Library
In this approach, the control signal from the PID controller, after being multiplied by a gain representing the volume of the reactor, is sent to the up-stream basin. The controller unit at the basin receives the control signal and checks the actual state of the basin before setting the output flow from the basin (input to the WWTP). Campisano and Modica (2002) explains the application of PID and PLC units to real-time control of sewer systems. The checks that are performed by the controller unit in the basin, for example, a PLC (programmable logic controller), are based on the inflow to the basin (Qin), the level of storage of the basin (Vbasin) and the maximum inlet flow capacity of the WWTP (Qmax).
[image:4.595.72.289.261.529.2]WWTP
Fig. 3 Layout of the integrated control system
The basic operation of the control system in the basin is the following: given the flow demanded by the control signal from the WWTP, provided the physical conditions of the basin allow doing so, the outflow flow from the basin is set equal to the control signal. The word “control” in brackets in the control signal from the PID means that this is what the controller demands, but may not be the final input to the WWTP. The final input to the treatment plant is QTPin. A gain block (1/V) has been introduced because the equations of the model of the biological processes in the WWTP operate with the dilution rate. In the model, the controlled basin is located near from the treatment plant.
A PID (PID2) controller is also used to control the DO concentration in the activated sludge reactor through the air flow rate input to the reactor (Katebi, et al, 1999). In principle, it is assumed that the air flow rate ordered by the PID controller is always achievable and no restriction is considered.
Fig. 4 The proposed Integrated Control System
Recycled biomass control loop: The recycled
biomass concentration (Xr) is governed by:
) ( ) ( ) ( ) ( ) 1 ( ) ( ) (
t X r t D t X r t D dt
t dX
r
r = ⋅ + ⋅ − ⋅ β+ ⋅
Xr depends inversely on . If increases, more sludge is produced and, hence, Xr decreases.
During dry weather, is fixed to 0.2. During a rain event, when Xr starts to decrease, the waste flow should be reduced, which means reducing the value of . Thereby, the value of is a function of Xr. This
function must keep Xr within its working range of
values. The mathematical function that has been PID1
+ -R
Substrate
Dilution Rate QTPin (control)
PLC pump
QTPin V-1
V
[image:4.595.312.524.426.603.2]found to best meet these requirements is the following “arctangent” function:
⎟ ⎟ ⎠ ⎞ ⎜ ⎜ ⎝ ⎛ − ⋅ ⎟⎟ ⎠ ⎞ ⎜⎜ ⎝ ⎛ + = 2 * 1 * arctan β β π β β k X X
k r r
where: * = 0.2:the dry weather value; Xr*: the steady state value of Xr during dry weather; k1:is the
scale factor.; k2:is the slope factor.
Biomass Control: The ratio of the recycled flow to
the inflow is represented in the model by r (r = Qr/Qin). This parameter is set to 0.6 for dry weather.
The activated sludge reactor is modelled by:
) ( ) ( ) 1 )( ( ) ( ) ( t X t D r X r t D X t dt t dX r ⋅ + ⋅ + − =μ
The concentration of biomass in the re-circulation stream is higher than in the reactor. Therefore, an increment of the recycled flow causes a positive increment in the balance of inputs and outputs of biomass in the reactor. Thereby, when the biomass concentration tends to decrease, during a rain event, this control system must act on the valve in order to increase the recycled flow. The controller is found to be:
⎟⎟
⎠
⎞
⎜⎜
⎝
⎛
−
⋅
⎟
⎠
⎞
⎜
⎝
⎛
−
=
2 * 1 *arctan
r rk
X
X
k
r
r
π
where: r*=0.2, the value of r for dry weather; X*: is the steady state value for dry weather; kr1:
is the scale factor; and kr2: is the slope factor.
The control system as implemented in Simulink is represented in Fig.4. The values of the parameters of the controllers have been chosen in order to achieve a good performance of the integrated urban wastewater system for Performance of the river, performance of the WWTP and performance of the sewer system.
5. SIMULATION STUDIES
The proposed ICS is simulated in different scenarios. The assessments are focused in the river water quality, especially with regard to the dissolved oxygen concentration, since it is the main objective of the present work. However, assessments about the performance of the treatment plant and the sewer system are also made and variables from these sub-systems plotted. The urban waste water system was simulated for a number of scenarios but the results given here is only for dry weather and high magnitude rain event cases for both controlled and uncontrolled system.
Dry Weather: During a dry weather period the
wastewater treatment plant achieves the steady state shown in XTable 1X. These values show that ICS
provides superior performance for both the river and WWTP.
Table 1 Steady state in the WWTP InF [m3/h] FBio [mg/l] FRec [mg/l] FSub [mg/l] DO [mg/l] ICS 373 234 468 35 6.6 No ICS 373 214 428 42 4.0
[image:5.595.323.511.107.154.2]No plots of DO in the river from the simulation of the non-controlled system are displayed here because these are very similar.
Table 2: BOD in the river [mg/l] points 1 2 3 4 5 6 7 ICS 0 0 0.5 0.5 0.4 0.3 0.2 No ICS 0 0 0.7 0.6 0.5 0.4 0.3
XTable 2X shows measures of BOD at different points
of the river during the dry weather simulation. From the results of the simulations, it can be seen that the performance of the urban wastewater system, during dry weather is marginally better for the controlled case but this does not justify the investment needed for implementing ICS.
High-magnitude rain event: 32 mm/h, 2 hours: This
rain event causes a high impact in all the components of the system: the sewer, the treatment plant and the river. It has been decided to simulate the system for a high impact rain event in order to show the robustness of the control system. It is possible to see the benefits of the use of an integrated control system in this simulation. However, the improvement in the DO concentration in the river (Fig.5), with regard to the non-controlled system, is not so marked in this rain event as in the medium rain event simulation. This is because, in this case, an important part of the impact in the oxygen depletion in the river is due to combined sewer overflows from basins.
12 18 24 30 36 42 48 54 60 66 72 78 84 90 96 102 108 114 120 126132 5
6 7 8 9
10 Dissolved Oxygen in the river station 6
time [ hours ] [ mg / l ]
[image:5.595.312.522.431.531.2]integrated control system no control system
Fig. 5 DO in the river station 6
[image:5.595.322.531.590.660.2]X
Table 3X shows the time that the DO concentration
remains under a value of 6 mg/l.
Table 3 Time under a DO of 6 mg/l River
station ICS NO ICS
3 0 08.25 h (08 h and 15 min) 4 0 08.85 h (08 h and 50 min) 5 0 11.10 h (11 h and 06 min) 6 0 08.15 h (08 h and 09 min)
There is a reduction in the concentration of BOD in the river in the case of the integrated control system. The improvement of the performance of the variables in the WWTP is much more marked in the case of a high magnitude rain event. XFig. 6X shows the biomass
XFig. 7X shows that the DO concentration rises to a
value of 8.5 mg/l in the simulation without a control system because the concentration of micro-organisms, which degrades the substrate while consuming DO in the normal operation of the treatment plant, is almost zero. Therefore, while there is no consumption of DO in the reactor, the effect of the aeration system causes it to increase.
10 22 34 46 58 70 82 94 106118130 142154166178190202214226 238 250 262 274 0
100 200 300 400 500
time [ hours ] Recycled Biomass in the WWTP
[image:6.595.72.285.151.369.2][ mg / l ] integrated control systemno control system
Fig. 6 Biomass in the WWTP
10 22 34 46 58 70 82 94 106118130 142154166178190202214226 238 250 262 274 2
3 4 5 6 7 8 9
time [ hours ] Dissolved Oxygen in the WWTP
[ mg / l ]
integrated control system no control system
Fig. 7 Dissolved oxygen in the WWTP
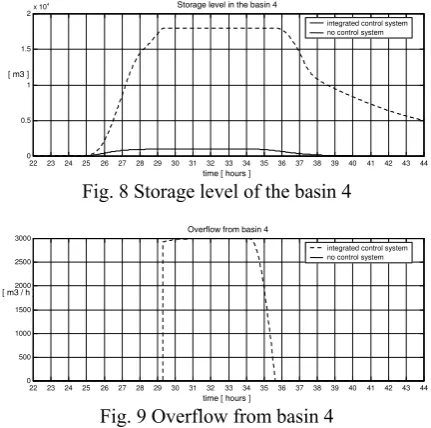
XFig. 8X shows the storage level in the basin 4. XFig. 9X
shows the overflow from basin 4 that takes place. However, it must be remembered that the WWTP remains in bypass during this rain event, which has the same effect as a combined sewer overflow, although this is not displayed. In the case of non-controlled system, the plant remains in bypass even though the storage capacity of the basin 4, which is the maximum volume of water that the basin can store, is not used up.
22 23 24 25 26 27 28 29 30 31 32 33 34 35 36 37 38 39 40 41 42 43 44 0
0.5 1 1.5 2x 10
4 Storage level in the basin 4
time [ hours ] [ m3 ]
[image:6.595.70.286.507.721.2]integrated control system no control system
Fig. 8 Storage level of the basin 4
22 23 24 25 26 27 28 29 30 31 32 33 34 35 36 37 38 39 40 41 42 43 44 0
500 1000 1500 2000 2500 3000
Overflow from basin 4
time [ hours ] [ m3 / h ]
integrated control system no control system
Fig. 9 Overflow from basin 4
6. CONCLUSION
As it has been pointed out, the main objective has been to improve the DO concentration performance
in the river, not by means of the construction of new facilities, but trough the application of control theory to an already existing (although hypothetical) wastewater system. An integrated control system has been developed in order to achieve this objective. Simulations of the integrated control system have been carried out in order to compare the performance of the urban wastewater system with and without control.
The main conclusion of this work is that important improvements have been achieved, with the application of an ICS. These improvements affect the performance of the DO concentration of the river, the performance of treatment plant and make a better use of the storage capacity of the sewer system.
ACKOWLEDGEMENT: The authors are grateful to the support by the European Community’s Human Potential Programme under contract HPRN-CT-2001-00200.
REFERENCES
Balmér, P., Malmqvist, P., Sjöberg, A. (1984c). Planning and Control of Urban Storm Drainage.
3rd International Conference on Urban Storm Drainage, Göteborg, Sweden, Jun 4-8
Campisano, A., Modica, C. (2002). PID and PLC units for the real-time control of sewer systems.
Water Science & Technology, vol. 45, no. 7, 95-104
Katebi, R., Michael A.J. and Wilkie, J. (1999). Control and Instrumentation for Wastewater Treatment Plants. Springer
Marinaki, M. (2002). Optiml Real-Time Control of Sewer Networks. Thesis submitted in partial fulfilment of the requirements for the degree of Doctor of Philosophy
Nejjari, F.; Benhammou, A.; Dahhou, B. and Roux, G. (1997). Nonlinear multivariable control of a biological wastewater treatment process.
Rauch, W., Aalderink, H., Drebs, P., Shcilling, W. and Vanrolleghem, P.A. (1998). Requirements for integrated wastewater models – Driven by receiving water objectives. 19th IAWQ Biennial
Conference, Vancouver, Canada, 21-26 June
Reda, Andre Luiz de Lima (1996). Simulation and control of Storm water impacts on river water quality. PhD thesis, Dept. of Civil Engineering Imperial College of London
Schütze, M., Butler, D. and Beck, M.B. (2002). Modelling, Simulation and Control of Urban Wastewater Systems. Springer
Wanielista, M.; Dersten, R. and Eaglin, R. (1997). Hydrology: water quantity and quality control.
John Wiley & Sons, Inc.
![Table 2: BOD in the river [mg/l]](https://thumb-us.123doks.com/thumbv2/123dok_us/1722645.125669/5.595.323.511.107.154/table-bod-in-the-river-mg-l.webp)