Rochester Institute of Technology
RIT Scholar Works
Theses
Thesis/Dissertation Collections
6-1-1995
A Computational analysis of observer metamerism
in cross-media color matching
Richard Alfvin
Follow this and additional works at:
http://scholarworks.rit.edu/theses
This Thesis is brought to you for free and open access by the Thesis/Dissertation Collections at RIT Scholar Works. It has been accepted for inclusion
in Theses by an authorized administrator of RIT Scholar Works. For more information, please contact
Recommended Citation
A COMPUTATIONAL ANALYSIS OF OBSERVER
METAMERISM IN CROSS-MEDIA COLOR MATCHING
by
Richard L. Alfvin
B.F.A. Rochester Institute of Technology
(1993)
A thesis submitted in partial fulfillment of the
requirements for the degree of
Master of Science in Color Science
in the Center of Imaging Science
Rochester Institute of Technology
June 1995
Signature of the Author
Roy
Berns
Accepted by
CENTER FOR IMAGING SCIENCE
ROCHESTER INSTITUTE OF TECHNOLOGY
ROCHESTER, NEW YORK
CERTIFICATE OF APPROVAL
M.S. DEGREE THESIS
The M.S. Degree Thesis of Richard
L.
Alfvin
has been examined and approved
by two members of the color science faculty
as satisfactory for the thesis requirement for the
Master of Science degree.
Dr. Mark D. Fairchild, Thesis Advisor
Dr. Roy S. Berns
THESIS RELEASE PERMISSION FORM
Rochester Institute Of Technology
Center For Imaging Science
Title of Thesis
A Computational Analysis Of Observer Metamerism In
Cross-Media Color Matching
I, Richard L. Alfvin, hereby grant permission to the Wallace Memorial Library of
R.1.
T.
to reproduce my thesis in whole or part. Any reproduction will not be for
commercial use or profit.
Signature of Author
{;,-£
-9S
A
COMPUTATIONAL
ANALYSIS
OF OBSERVER
METAMERISM
IN
CROSS-MEDIA
COLOR
MATCHING
Richard L. Alfvin
Submitted for
partialfulfillment
of
the
requirementsfor the
degree
ofMaster
ofScience
in
Color Science
in
the
Center
for
Imaging
Science
in
the
College
ofImaging
Arts
andScience
at
the
Rochester
Institute
ofTechnology
ABSTRACT
Standard color-matching
functions
aredesigned to
representthe
meancolor-matching
response ofthe
population ofhuman
observers with normal color vision.When using
these
functions,
two
questions arise.Are
they
an accuraterepresentation of
the
population?And
whatis the
uncertainty in
color-matchpredictions?
To
addressthese
questionsin
the
dual
context ofhuman
visualperformance and cross-media
reproduction,
acolor-matching
experiment was undertakenin
whichtwenty
observers made matchesbetween
sevendifferent
colors presented
in
reflective andtransmissive
color reproduction media and aCRT
display
viewedthrough
an optical apparatusthat
produced a simple splitfield
stimulus.In addition,
a single observer repeatedthe
experiment20
times
to
quantify intra-observer
variability.The
results are usedto
evaluatethe
accuracy
ofthree
sets ofcolor-matching
functions,
to
quantify
the
magnitude of observervariability,
andto
compare intra- andinter-observer
variability in
color matching.These
results are compared with currentCIE
recommendations on observermetamerism.
The
magnitude of observervariability
in this
experiment alsoACKNOWLEDGMENTS
This
research was supportedby
the
NSF-NYS/IUCRC
andNYSSTF-CAT
Center
for
Electronic
Imaging
Systems,
andthe
Munsell
Color
Science
Laboratory.
I
wouldlike
to
thank:
All
the
observers whograciously
volunteeredtheir time.
Jason
Gibson
for his
tireless
effortsin
collecting
the
experimentaldata
and
participating
as an observerfor
twenty
trials.
Lisa
Reniff
for sharing her
expertise,
experience,
and eversmiling
support.
Dr.
Roy
Berns
for his
wit, wisdom,
and opendoor.
Dr. Mark
Fairchild
for
the
wealth ofknowledge
he
has
shared withme,
his
guidance,
and mostimportantly
his
confidencein
my ability
to
succeed.
My
friends
andfamily
for
their
loving
support.My
wifeLaura,
who withher
encouragement,faith,
andlove,
openedthe
door
to
my future
and mademy dreams
a reality.TABLE OF CONTENTS
INTRODUCTION
1
Standard Observers
2
Sources
ofObserver Variability
3
Inert Pigments
4
Cone Photo-Pigment Spectra
5
Cone Weightings
6
Related
Studies
7
D&H
Color Rule
7
Pobboravsky.
8
North
andFairchild
9
Current
Research
9
EXPERIMENT
12
Design
12
Observers
15
Instructions
17
Procedure
19
RESULTS AND DISCUSSION
21
Precision
andAccuracy
21
Color Matching Functions
25
Tristimulus
Value Calculations
26
CIELAB Coordinates
29
Observer Variability
30
Confidence Regions.
32
Bishop's Test:
Homogeneity
of Variance
42
Hotelling's
T2Testfor
Means
44
Predicted Observer Variability
51
CIE
Standard Deviate Observer
53
Variability
Of
Spectral
Tristimulus
Values
62
Scaling Covariance Matrices
68
CONCLUSIONS
70
APPENDIX
A
77
Intra- andInter-Observer
Experimental Color
Matches
77
APPENDTX
B
119
Experimental
&
Predicted Ranges
ofColor
Mismatch
119
APPENDTX C
161
Experimental Cross-Media Metamers: Spectral
Plots
161
APPENDTX D
175
Experimental
Cross-Media
Metamers: SpectralData
175
APPENDKE
189
Experimental Uncertainties:
Intra-ObserverData
189
APPENDKF
190
Experimental Uncertainties: Inter-Observer Data
190
APPENDTX
G
191
Experimental Data
191
APPENDTX H
196
Mathematica
Script:
Plotting
Confidence Ellipses
196
APPENDTX 1
208
LIST OF FIGURES
FIG. 1. CIE
X,Y CHROMATICITY DIAGRAM
SHOWING THE COORDINATES OF THEFOURTEEN HARD-COPY STIMULI
WITH RESPECT TO THE CHROMATICITY GAMUT OFTHE
CRT
DISPLAY
13
FIG. 2. Schematic
overhead
view ofexperimental
set-up used for colorMATCHING
14
FIG. 3. The
spectral power
distributions of a gray transparency and aCRT
DISPLAY
METAMERICMATCH
20
FIG.
4.
Color-matching
functions:Stiles-Burch
2mean
observer, CIE
2Standard Colorimetric
Observer,
andCIE
10Supplemental Standard
Colorimetric Observer
25
FIG. 5. Cyan-transparency
color
matches: Aa*-Ab*plane29
FIG. 6. Twenty
inter-observer cyan-transparency color matches bound bya
95%
Aa*-Ab*confidence ellipse ofthe
sampledistribution34
FIG.
7. Twenty
inter-observer cyan-transparency color matches bound bya
95%
Afl*-Ab*confidence ellipse of the sample mean35
FIG. 8. Twenty
inter-observer cyan-transparency colormatches bound by
95%
Aa*-Ab*confidence ellipses of the sample distribution andmean
36
FIG.
9. Twenty
inter-observer cyan-transparencycolor matches
bound by95%
Afl*-AL*confidence ellipses of the sample distribution and mean....37
FIG.
10.
Twenty
inter-observer cyan-transparencycolor matches
bound by95%
Ab*-AL*confidence ellipses ofthe
sampledistribution and mean
....38
FIG. 11. Twenty
intra-observer cyan-transparency color matchesbound
by95%
Aa*-Ab*confidence ellipsesof
the sample distribution and mean39
FIG.
12. Twenty
intra-observercyan-transparencycolormatches
bound BY95%
Afl*-AL*confidence ellipses of the sampledistribution
FIG. 13.
Twenty
intra-observer
cyan-transparency color matches boundby
95%
Ab*-AL*confidence
ellipses ofthe
sample distribution and mean.41FIG. 14. The
first deviation
functions of theCIE
Standard Deviate
Observer
39
FIG. 15. CIE
standard
deviate observer,and1931 CIE
Standard
Colorimetric Observer
color-matching functions40
FIG. 16. Age
effect
on color mismatches57
FIG. 17. Measured
and predicted ranges of color mismatch for the cyantransparency
in theCIE
Aa*-Ab*plane;
inter-observerdata;
intra-OBSERVER
DATA;
ANDCIE
STANDARD
DEVIATE OBSERVER61
FIG. 18. Fundamental
spectral tristimulus variances derived byNimeroff,
Rosenblatt,
andDannemiller
62
FIG. 19. Measured
and predicted ranges of color mismatch for the cyantransparency in the
CIE
Aa*-Ab*plane
65
FIG.
20.
Measured
and predicted ranges of colormismatch
for the cyanTRANSPARENCY
in theCIE
Aa*-AL*plane
66
FIG. 21. Measured
andpredicted ranges
of colormismatch
for the cyanLIST OF TABLES
TABLE I. INTER-OBSERVER
DEMOGRAPHICS16
TABLE II.
Instrumental
wavelength accuracy23
TABLE
III. Instrumental
precision24
TABLE IV. Lagrange
interpolation and weighting coefficients27
TABLE V. CIELAB
color match unit deviations30
TABLE VI. Mean
color differences from the mean(MCDM)
31
TABLE
VII.
HOTELLING'S
T2test for means
46
TABLE VIII. HOTELLING'S
T2TEST FOR MEANS47
TABLE IX. HOTELLING'S
T2TESTFOR MEANS
49
TABLE X. HOTELLING'S
T2TEST FOR MEANS50
INTRODUCTION
The primary
objectivein
virtually
all colorimaging
systemsis
to
achievefaithful
color
reproduction,
i.e.
colormatching.In
colorimetricterms,
color matches aredefined
by
multiple stimuli withidentical
tristimulus
values.Since
tristimulus
values are a
function
ofthe interaction
between
a physical stimulus and thehuman
visualsystem,
it is
necessary
to
considertwo
distinctly
different
types
ofcolor-matches,
spectral and metameric.Spectral
colormatches,
identified
by
physical stimuli with
identical
spectral radiant powerdistributions,
areperceived as color matches
by
all observers.Spectral
color matchesin
colorreproduction are
only
possible whenidentical
media andillumination
are usedfor both
the
originalandthe
reproduction.Metameric
color matches correspondto
physicalstimuli withdifferent
spectral radiantpowerdistributions,
which areperceived as color matches
for
a givenobserver.1Due
to
differences
in
the spectral characteristics ofthe
primary
colorantsused
in
cross-media colorreproduction,
all cross-media color matches aremetameric.
Since
metameric matches aredependent
uponthe
characteristicspectral responsivities of
the
human
visualsystem,
variationsin
color-matching
match perceived
by
one observermay
appearto
be
a significant mismatchto
another observer.
This
phenomenonis
known
as observermetamerism.Standard Observers
Since
varianceis
the
variation about a meanvalue,
it is
necessary
to
define
amean observer when observer variation
is
being
assessed.A
greatdeal
oftime
and effort
has
goneinto
defining
mean or standard observers.The CIE has
established
two
sets of standard colormatching
functions
designed
to
characterize
the
visualresponse ofthe
average color normal observerdefined for
a set of
fixed viewing
conditions andparameters;
the
1931 CIE
2Standard
Colorimetric
Observer,
andthe
1964
CIE
10Standard
Supplemental
Colorimetric
Observer.2The CIE Standard
Observers
areofficially
recognized asinternational
standardsdefining
the
mean observer.Although
the
CIE Standard Observers may accurately
representthe
meanresponses of
the
population of color normalobservers,
any
single observermay
not
be
representative ofthe
mean.The
significance of colormatchesdefined
by
a standard observer
for any
color normalindividual is
dependent
uponthe
magnitude of
the
deviation from
the
standard observer ofthe
individuals
colorpredictions made with a standard
observer,
it
is
necessary
to
assessthe
magnitude of
the
uncertaintiesassociated withthe
standardobserver.Sources
of
Observer
Variability
To better
understandthe
effects and magnitude of observer metamerism,it
is
useful
to
considerthe
sources of variance responsiblefor
differences in the
perception of color.
Variation
in
the physiological,
and psychological componentscomprising
the
human
visual system are responsiblefor differences
or variationin
colorperception
among
color normalindividuals.
Identifying
andquantifying
the
individual
components of variance associated withthe
relatively
intangible
psychological aspects of color perception or
matching
is
anintrinsically
complextask that
has
not yetbeen successfully
undertaken.A
multitude of psychologicalfactors
notexclusively
including
mood,
alertness,
interest,
motivation,
andattention are
potentially
capable ofimpacting
the
perception of color orcolor-matching
criteria.Therefore,
it is important
to
understandthat
adegree
ofuncertainty
of unknown magnitudeis
inherently
confoundedin
the
uncertainties
identified
in this
andany
other practicalstudy designed
to
Sources
of physiological variationimportant
in
color visioninclude
variation
in inert
pigments,
variationin the
cone-photopigment spectra, andvariation
in
the
middle-wavelength-sensitive(MWS)
andlong-wavelength-sensitive
(LWS)
coneweighting.3Inert
Pigments
The
inert
pigmentscontributing
to
fundamental
variationin the
human
visualsystem are
the
lens
and macular pigments.The
opticaldensity
ofthe
human
lens
variessignificantly between
individuals.
Among
youngerindividuals
the
variation
in
lens
density
is
typically
a multiple ofthe
overalllens
spectral-density
function.
Van
Norren4calculated
the
variationin
the
young lens using
the
scotopicvisibility
spectrumestablishedby
Crawford.5He
found
that
95%
ofthe
variationin
lens
opticaldensity
is
representedby
25%
ofthe
meanspectraldensity
for
individuals
between 20
and30
years of age.In
addition,
the
opticaldensity
ofthe
lens
increases
with age.The
variationin
lens
absorptioncharacteristics caused
by
aging does
not appearto
be
a multiple ofthe
overallspectral
density
ofthe
younger eye.Pokorny
et al.6have
proposed a spectral
density
function
ofthe
eyeshowing relatively
mild age related changesin
Variation
in
the
opticaldensity
ofthe
macular pigmentamong
colornormalobservers
is
also consideredto
be
significant.7'8The
range of variationin
the
peakdensity
ofthe
maculahas been
estimatedto
be
between
eightfold andtenfold.7-8
Cone Photo-Pigment
Spectra
Two
primary
sources of variation are presentin
cone photo-pigment spectra.The first
sourceis
peak wavelength variation causedby
polymorphismin
the
amino acid sequences of
the
middle-wavelength-sensitive andlong-wavelength-sensitive cone photo-pigment opsins.
Eight
polymorphismsfor
the
long-wavelength-sensitive and
five
for
the
middle-wavelength-sensitivephoto-pigments
have been
identified,
resulting
in
the
possibility
of seventeendifferent
long-wavelength-sensitive
opsins and elevendifferent
middle-wavelength-sensitive opsins.9
The
most common
polymorphism,
the
long-wavelength-sensitive photopigment
60%
serine/40% alanine180
polymorphism,
is
believed
to
cause a4nm
shifttowards
shorter wavelengthsin
the
peak wavelength oflong-wavelength-sensitive
cones.10' n> nThe
range of photopigment variationconsistent with color
matching has been
estimatedby
Smith, Pokorny,
andThe
secondform
of variationpresentin the
conephoto-pigmentspectra ofcolor normal observers
is
variationin
effective opticaldensity.
Variation
occursdue
to
the
individual
differences
in
the
opticaldensity
ofthe
middle-wavelength-sensitive and
long-wavelength-sensitive
photo-pigments.The
greatest variation
in
opticaldensity
of photo-pigment spectrais
found
in the
foveal
regioncontaining
the
highest
effectiveoptical density.14Cone
Weightings
Spectral
luminosity
functions
canbe
synthesizedfrom
a sum oflong-wavelength-sensitive and middle-wavelength-sensitive-cone photopigments.
A
variety
ofpsychophysical methods can alsobe
usedto
derive
spectralluminosity
functions.
Heterochromatic
flicker photometry matching
wasthe
primary
method used
by
the
CIE
to
derive
the
spectralluminous-efficiency
function
V(k)
from
the
average ofmany
observers.Variation
in individual
spectralluminosity
functions do
notaffectchromaticity
coordinates,
but do
impact
the
magnitude ofY.
According
to
Smith
andPokorny3,
"In
a monitor systemin
whichthe
primaries are
broadband,
the
effectofthis
variation onY may
cause rotation ofchromaticities relative
to
thenominalcardinalaxes."
The
major source ofvariationin
spectralluminosity
functions
determined
constitute
the
function.15The
variation
in heterochromatic
flicker
photometry
can
be
modeledby
varying
the
proportions ofthe
fundamentals
requiredto
fit
the
measuredfunction.16'
17The
range oflong-wavelength-sensitive/middle-wavelength-sensitive cone
weighting
ratioshas been
estimatedto
be between
1/2
and 9/1.16- 18-19These findings
indicate the
potentialfor
significant variationin individual
spectralluminosity
functions
and shiftsin
chromaticity
whenviewing
stimuli composedofbroadband
primaries.Related Studies
Analytical
studiesbased
onStiles
observershave been
performedto
estimatethe
effects of observer metamerism.
However,
relatively little
experimentalresearchhas
been
performedto
quantitatively
assessthe
magnitude of observervariability.
D&H Color Rule
The
D&H
Color
Rule20,
designed
to test
the
effects of changesin illuminants
and/
or observersfor
metameric pairshas
been
usedto
estimatethe
relativeeffectsofobserver
and/
orilluminant
metamerism.Billmeyer
and Saltzman21tested
seventy-two observersless
than
sixty
incandescent
light
From
their
resultsthey
concludedthat the
variability in
matches
among
observerswas ofthe
samemagnitude asthe
difference
in
matchpoints
for any
singleobserver,
between
the two illuminants.
Nardi
usedthe
D&H Color Rule
asdescribed
by
Billmeyer
andSaltzman
to test
agroup
of90
maleandfemale
college students with normal color visionbetween
the
ages of seventeen andtwenty-nine.22Compared
withBillmeyer
andSaltzman's
findings,
Nardi's
results showedapproximately
onefourth
ofthe
variation
among
eachofthe two
illuminant
groups of color matches.Pobboravsky
Pobboravsky23 studied
the
effect of observer metamerism on color matchesbetween CRT
displays
and printed matter.He
performed a set oftheoretical
calculations
based
onthe
colormatching data
usedin
the
CLE
recommendedtechnique
for assessing
observer metamerism.24His
conclusion was that
observer metamerism was not a significant problem
in these types
of matches.He
verifiedthis
conclusion with qualitative visualjudgments
of acceptability.These
data,
whileuseful,
mightwellunderestimatethe
importance
of observermetamerism and
they
lack
the
quantitative nature requiredfor
applicationto
North
andFairchild
A
visualcolorimeterdesigned
by
North
andFairchild
was usedto
measurethe
color-matching
functions
ofagroup
of color normal observers.25Color
matching
functions
weredetermined
by
making
a series of color matchesto
simulateddaylight
in
a 2bipartite
field.
In
orderto
examine inter- andintra-observer
variations,
eighteen observers performedthe
experiment onetime,
and oneobserver performed
the
experimenttwenty
times.
The
average colormatching functions
ofthe
eighteen observers werefound
to
be very
similarto
both
the
Stiles
2 mean observer andthe
CIE
2 meanobserver.
The
inter-observer
variability
wasfound
to
be significantly larger
than
the intra-observer
variability.The variability
ofthe
twenty
Stiles
colormatching
functions
usedto
derive
the
CIE Standard
Deviate
Observer
was comparableto
the
variability
ofthe
single observer.These
results arein
general agreementwith current research.
Current
Research
The
following
sectiondescribes
an experimentdesigned
to
explore observermetamerism
by
quantifying
the
precision andaccuracy
ofthree
sets ofcolor-matching
functions,
andthe
magnitude of observervariability
found
in
intra-and
inter-observer
color matches arequantified and compared.In
addition, the
results of
this
researcharecompared withthe
CIE
recommendations on observermetamerism.
Uncertainties derived
by
Nimeroff,
Rosenblatt,
and Dannemiller26for
Hie 1964 CIE
10Supplemental
Standard
Colorimetric
Observer
color-matching
data
are alsocompared withthe
experimentaldata.
Although
the
effects of observer metamerism are presentin
any
colorreproduction
system,
color prints andtransparencies
were selected ,for
usein
this research,
astypical
mediacommonly
usedin
CRT
to
hard copy
imaging
systems.
Observer variability
in
cross-media colormatching
is
composed ofmultiple variance components related
to
spectraldifferences,
image
characteristics,
andviewing
conditions.In
orderto
better
assess observermetamerism related
to
spectraldifferences
in
cross-media,
the
experimentalcross-media stimuli were
designed
to
minimizenon-spectral related componentsof observer
variability
associatedwiththe task
ofcross-media color matching.The
hard-copy
stimuli wereilluminated
by
aGTI
Soft View
D50
fluorescent
simulatorlightbooth
designed
for viewing both
reflective andtransmissive
materials.The
intensity
ofthe
lightbooth
sources were adjustedto
yield equal
luminance
from
the
reflective andtransmissive
gray
hard-copy
stimuli.
The
color appearance ofthe
soft-copy
image
produced withthe
CRT
hard-copy
stimulus.With
the
use ofa computermouse,
the
observer was ableto
independently
adjustthe
color appearance attributes ofthe
soft-copy
image
along
aCIE
L*vector,
and an a*-b*plane.
Proprietary
software was createdto
convert
the
CIELAB
values,
calculatedfor
aD50
whitepoint,
to
RGB
digital
counts.
The
CRT
display
wascontrolled with aPixar II
image
computer with10-bits
perRGB
color channelresolution(i.e. 1024 levels
ofR, G,
andB
luminance).
Thus,
the
color resolution ofthe
display
system exceededhuman
visual colordiscrimination
capabilities.In
additionto
evaluating
the
accuracy
of colormatching
functions,
andquantifying
observervariability,
the
magnitude of observervariability
determined
in this
experiment will provide a quantitative and practical estimateEXPERIMENT
Design
A
visual experiment wasdesigned
to
permit observersto
make critical colormatches
between
colorprints ortransparencies
and aCRT
display.
Seven
colorprints and seven color
transparencies
were prepared asfixed matching
stimuli.The
sevencolorsincluded
red, green,
blue,
gray, cyan, magenta,
and yellow.The
color print samples were
designed
withAdobe
Photoshop
version2.5
andimaged
with aFujix
Pictrography
3000
color printer.The
Fujix
printeris
ahybrid photographic/
thermal-transfer
continuous-tonedigital
printer.The
colortransparencies
wereimaged
with anMGI Solitaire
8xp
film
recorderusing 4x5
Ektachrome 100 Plus Professional film.
The
chromaticities ofthe
fixed
hard-copy
samplesilluminated
with afluorescent D50
simulator weredesigned
to
effectively
samplethe
color gamut ofthe
Sony
Trinitron CRT
display
modelPVM-1942Q
usedto
generatethe
soft-copy
color matches.The CIE
x,
y
chromaticity
coordinates ofthe
hard-copy
stimuli andthe
chromaticity
gamut ofl 1 1 1 r
0.4
0.6
FIG.
1.
CIE
x,y
chromaticity
diagram (1931
CIE
2Standard Colorimetric
Observer,
D50 fluorescent daylight
simulator) showing
the
coordinates
ofthe
fourteen
hard-copy
stimuli with respectto the
chromaticity
gamut ofthe
CRT
display.
Color
prints(open
circles);
colortransparencies
(solid
triangles);
andWith
the
use of a simple opticalapparatus,
consisting
of an equilateralglass prism mounted on an optical
bench,
the
observers were ableto
FIG.
2.
matching
Schematic
overhead view of experimentalset-up
usedfor
colorsimultaneously
viewboth
the
softandhard-copy
matching
stimuli.As
shownin
Fig.
2,
aCRT
display
and a combinationlightbooth/
light box
were aligned withthe
opticalprism and shieldedfrom
the
observer.The
fixed
hard-copy
stimulusbipartite
field.
The
color-matching
stimuli were presented as solid colorsappearing
self-luminousin
adarkened
room.A
neutraltranslucent
diffusion
material placed
in
front
ofthe
CRT
display
eliminatedthe
appearance ofany
visual
texture
in
the
soft-copy
stimulus,
rendering
the
soft-copy
stimulusObservers
Twelve
male and eightfemale
observersbetween
the
ages oftwenty-one
andfifty-six
participatedin the
color-matching
experimentto
assessinter-observer
variability.
The
ages ofthe
observers wereuniformly
distributed;
there
werefive
observersin
each offour
groups,
20-29, 30-39,
40-49,
and50-59
years of ageas shown
in
Table I.
Each
ofthe
twenty
observerssuccessfully
passed ascreening for
congenital color visiondeficiencies
whentested
with a set ofIshihara Pseudoisochromatic
Plates.27The
Farnsworth-Munsell
100-Hue
Test28was administered
to
each ofthe
observersto
assesstheir
colordiscrimination
abilities.
Seventy-five
percent ofthe
twenty
observers were rated ashaving
"superior"
color
discrimination,
whilethe
remaining
twenty-five
percentachieved an"average" color
discrimination
rating.A 22
year old male observer performedthe
experimenttwenty
times to
assess
intra-observer
variability.The
single observertested
color normal withthe
set ofIshihara Pseudoisochromatic
Plates,
and received a "superior" colordiscrimination rating
withthe
Farnsworth-Munsell 100-Hue Test
TABLE
1.
Inter-observer demographics.
Observer
Sex
Age
Observer
Sex
Age
Observer
Sex
Age
Observer
Sex
Age
JXC
M
21
MDF
M
30
RSB
M
40
BXC
F
50
NMM
M
24
AXS
F
31
PDB
M
42
GCM
M
53
KMB
F
25
HKS
M
31
SJC
F
44
ACB
M
54
EAP
F
26
HKC
M
32
BAS
M
45
AMB
F
55
Instructions
The
observers were seated at adistance
ofapproximately
1
meterfrom
the
matching
stimuli.The 5
cm x5
cmmatching field
subtended a visual angle of2.9.
The
observers were askedto
adjustthe
color appearance ofthe soft-copy
stimulus
to
create an exact color matchfor
each ofthe
fourteen different
Color
Matching
Experiment
You
willbe
shownaseriesof colors presentedin
a splitfield.
Using
themousein
the mannerdescribed
below,
carefully
adjustthebrightness
andcoloroftheright sideofthefield
tomatchtheleft. The
twosidesofthefield
shouldbe indistinguishable.
Whenyouhave successfully
matchedthe twofields,
clickand releasetherightbutton
tofreeze
thecolor, then
inform
me.Your
match willbe
recorded and the next sample willbe
presented.Mouse
Controls:
The
mouse controlhas
three modes,Brightness
adjustment,Color
adjustment, andFreeze.
1.
Clicking
theleft button
willallow adjustmentofthefield brightness.
Moving
up
willmakethefield
appearbrighter
andmoving downwillmakethe
field
appeardarker.
2.
Clicking
themiddlebutton
willallow adjustmentofthefield
color.Moving
themouseleft
andright
will controltheamountofred and green.Moving
themouseupanddownwillcontroltheamount of yellowandblue.
3.
Clicking
andreleasingtheright
buttonwillfreeze
thematchformeasurement.
Clicking
anyotherbuttonwillallowfurther
adjustment.Yellow
Green
Red
Blue
Note:
-
Move
themouseslowly
andsmoothly.-Notify
meif
youfeel themouseis
notrespondingproperly. -Take
yourtimeandmake an exact match.- Whenyou
have
madeamatch remove yourhand from
themouse.If
youhave any
questionsregardingthematchingprocedure,ortheexperiment, pleasefeel
free
toaskthematany
time.Procedure
In
orderto
minimizeany
potential effects associated with observerfatigue
resulting
from
extendedduration
ofthe
experimentaltasks,
the
experiment wasdivided
into two
separate sessions.Each
sessionlasted approximately
45-60
minutes.
A
color match was achieved whenthe two
matching
stimuli appearedto
the
observeras a singlehomogeneous
stimulus.After
a match wasattained,
aPhoto Research PR-650
telespectroradiometer
was usedto
measurethe
spectralradiance
(W/sr*m2)
ofboth the
hard- andsoft-copy
stimulifrom
the
observers'point of view.
The Photo Research
650
telespectroradiometer
incorporating
ahalf-height
triangular
bandpass
of4nm,
recordedthe
spectral radiance at4nm
wavelength
intervals
acrossthe
visible spectrumbetween 380nm
and780nm.
The
order of color matches was randomizedfor
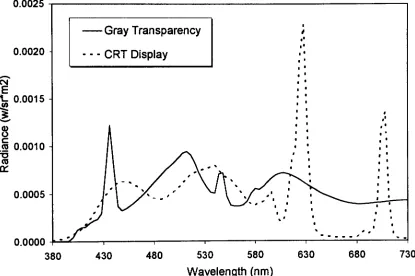
each observer.Figure 3
showsan example of
the typical
disparate
spectral powerdistributions
requiredto
produce ametameric match
between
the
gray
transparency
sampleandthe
CRT
display,
calculatedfor
the
1931 CIE
2\J.\J\J.3
-#
Gray Transparency
0.0020
- --CRT
Display
c7
E
1- 0.0015
-(05,
8
w
0.0010
TJ(0
IT 1 ^^ \* #
1 1 '
\
1 Yx f . ^^^ .
0.0005
J\'\"%Y
1 /*\
-*
*J
\ /*
, -. >
* \
0.0000
' *1 1
r-1 1 1 =
380
430
480
530
580
Wavelength
(nm)
[image:31.563.75.490.210.486.2]630
680
730
FIG. 3.
The
spectral powerdistributions
of agray
transparency
and aCRT
display
adjustedto
yield a metameric matchfor
the
1931
CIE
2Standard
RESULTS
AND DISCUSSION
Precision
andAccuracy
The
precision andaccuracy
ofthe
Photo Research PR-650
telespectroradiometer
used
to
record experimentaldata
for
this
research were examined andfound
to
be
within acceptablelimits
asdefined
by
the
manufacturer.The
following
is
alist
of manufacturer's specificationsfor
the
PR-650.
Calibration
is
traceable to
NBT
standards.Spectral
Range:
380-780
nmSpectral Bandwidth:
8
nm(fwhm)
Wavelength
Resolution:
less
than
3.5
nm/pixelLuminance Accuracy:
4%
of calculatedluminance
at2856K
@
23C,
1 digit (resolution 0.01 units)
Sensitivity
Range:
<
1.0
fL(3.4
cdm'2)
to
>1,000,000
fL (3,400,000
cdm'2)
for
2856K
source@
23C
Color
Accuracy:
.0015x
Spectral Accuracy:
2nm
Digital Resolution:
14bitA/D
(1
partin
16,000)
AutoSync Range:
40-250 Hz.
Measuring
andViewing
Field:
1
(measuring)
and7(viewing)
withstandard
MS-75mm lens
atinfinity
Minimum Spot Size:
0.2"
(5mm)
at 14"(36
cm)
with standardMS-75mm
lens
Diode
Array:
128-element,
50:1
aspect ratio(self-scanned)
The
photometricaccuracy
ofthe
telespectroradiometer
wastested
with astandardized
tungsten
source.The
expectedluminance
ofthe
standardizedsource
is
50.4
fL. The
measuredluminance
ofthe
reference source was51.7 fL.
The
spectral wavelengthaccuracy
ofthe
instrument
wastested
withthe
use ofa mercury-cadmium source.
The
expected spectrallines
ofthe
mercury-cadmium source were compared with
the
measured spectral radiancedata from
the
source.Seven primary mercury
spectrallines,
andfour primary
cadmiumspectral
lines located
between 380nm
and780nm
were allaccurately
representedTABLE
II.
Instrumental
wavelengthaccuracy
.Mercury
Spectral Lines
Cadmium Spectral
Lines
Expected
(nm)
Measured
(nm)
Expected
(nm)
Measured
(nm)
404.657
404
467.816
468
407.784
408
479.992
480
435.834
436
508.582
508
491.604
492
643.847
644
546.075
548
576.960
576
579.066
580
The
precision ofthe
Photo Research PR-650
telespectroradiometer
wasexamined
by
making
twenty
repeated spectral radiance measurements withoutreplacementof
the
gray
print andgray
transparency
hard copy
samples.One
measurement was made
every ninety
secondsfor
a period of onehour.
Tristimulus
values were calculatedfor
eachofthe measurements,
using
the 1931
CIE Standard Colorimetric
Observer.
In
additionto tristimulus
values,
CIE
chromaticities,
CIELAB
coordinates,
andthe
mean colordifference
(AE*,*)
from
the
mean29(MCDM)were
calculated as shownin
Table IH
The
mean colordifference from
the
mean wasapproximately 0.07
AE*i
for both
the
gray hard
copy
printandtransparency
samples.The
standarddeviation
wasless
than
0.10
TABLE
III.
Instrumental
precision.Gray Transparency
Gray
CIE
2Min
Max
Mean
StdDev
Min
Max
Mean
StdDev
X
45.09
45.62
45.43
0.138
44.72
45.15
44.94
0.110
Y
47.83
48.36
48.19
0.144
48.86
49.33
49.11
0.120
Z
40.50
40.99
40.79
0.122
54.86
55.38
55.15
0.132
X
0.34
0.34
0.34
0.000
0.30
0.30
0.30
0.000
y
0.36
0.36
0.36
0.000
0.33
0.33
0.33
0.000
L*
56.00
56.27
56.18
0.072
56.52
56.75
56.64
0.059
a*
-2.37 -2.26 -2.32
0.031
-5.45 -5.37 -5.410.029
b*-1.13 -1.00 -1.08
0.029
-13.64 -13.49 -13.560.044
MCDM
0.07
0.07
The
results ofthe
precision andaccuracy
tests
indicate
that
the
systematicand random error associated with
the
instrument
areminimal and acceptablefor
Color
Matching
Functions
Three different
sets ofcolor-matching functions
were usedin
conjunction withthe
spectral radiant powerdistributions,
recordedfrom both
the
hard- andsoft-copy
experimentalstimuli,
to
calculatetristimulus
valuesfor
each ofthe
observer color matches.
Figure 4
showsthree
sets ofcolor-matching functions:
the
1931 CIE
2Standard Colorimetric
Observer2,
the
1964 CIE
10Supplemental
Standard Colorimetric
Observer2,
andthe
1955 Stiles-Burch
2pilot
group
mean2.50
2.00
CO CD"I 1.50
>
CO J1.00
CO cH-0.50
0.00
Oo o o O * X v 1 x\7 x \ al *
V
/
*\/
x( oo O uXXfio a0ftxxsiXx9so >"Jr o
JWo
X
81 ol
r o Jt
^j
y
T OJ* ^_
^
8/
X
/
0B$t2pn$
owOx/
"J fiJV
o
A
^%
\o/ ^o JC
2r
^_
"k.380
430
480
530
580
Wavelength
(nm)
630
680
730
FIG.
4.
Color-matching
functions
for Stiles-Burch
2 mean observer(x)
transformed to
approximatethe
CIE
2Standard
Colorimetric Observer
(),
andCIE
10observer30,
which were usedfor
tristimulus
calculations.The 1955
Stiles-Burch
2
*<*>'
8sb'
md^sb
color-matching functions
weretransformed to
CIE 2-based
Xsb'Vsb'
andz^ color-matching functions
by
alinear
combination ofthe
1955
Stiles-Burch
2r^, gA,
andb^
color-matching
functions30.
Xsb(X)
ySb(X)
Zsb(X)
0.35811
0.14600
0.13993
0.82873
0.01423
0
0.06250
1.87194
rsb(X)
g,b(X)
bsb(X)
(1)
The
transformation
matrix wasdetermined from
abest fit
to
the
1931 CIE
2Standard Colorimetric Observer functions
by
least
squares multiplelinear
regression.
This
transformation
was performed suchthat the
data
analysescould
be
completedin
the
familiar
andapproximately
visually
uniformCIELAB
color space.
Tristimulus
Value
Calculations
Tristimulus
summation was used as an alternative methodto
tristimulus
integration
to
calculatetristimulus
valuesfor
each ofthe
cross-media colorgenerate
4nm
weight setsfor
each ofthe three
different
sets of colormatching
functions.
Four
nanometer weight sets were chosento
correspond withthe
4nm
spectral radiance
data
collected withthe
Photo
Research
PR-650
telespectroradiometer. Three
point quadraticinterpolation
wasusedto
calculatethe
first
andlast
interval
coefficients,
whilefour
point cubicinterpolation
wasused
to
calculatethe
middleinterval
coefficients.The Lagrange
interpolating
coefficients were calculated
from;
Lj(r)
=flf-\forJ
=0>1
n
(2)
'-o(ry-ry)
Where L
is the
Lagrange
interpolation
coefficient,
n representsthe
degree
ofthe
coefficients
being
calculated,
and r correspondsto
the interval indice.
The
Lagrange
interpolation
coefficients are summedto
produceweighting
coefficients
for
the
first,
middle andlast
weighting
intervals
with respectto
TABLE IV.
Lagrange
interpolation
andweighting
coefficients usedto
calculate4nm
weight setsfrom
1nm interval data.
Range
First
ntervalr
L0
M
L1
L2
0.25
0.6563
-0.4375
-0.0938
0.50
0.3750
-0.7500
-0.12500.75
0.1563
-0.9375
-0.0938
Weighted
coefficients
1.188
1.000
2.125
-0.313Range
Intermediate
intervals
r
L0
L1
M
L2
L3
1.25
-0.05470.8203
-0.2734
-0.03911.50
-0.06250.5625
-0.5625
-0.0625
1.75
-0.03910.2734
-0.8203
-0.0547
Weighted
coefficients
-0.156
1.656
1.000
1.656
0.156Range
Last interval
r
L0
L1
M
L2
1.25
-0.09380.9375
-0.1563
1.50
-0.12500.7500
-0.3750
1.75
-0.09380.4375
-0.6563
Weighted
coefficients
CIELAB
Coordinates
Reference-white
tristimulus
valuesfor both
hard- andsoft-copy
stimuli werecalculated
for
the D50
fluorescent
simulatorusing
each ofthe
three
sets ofcolor-matching functions.
CIELAB
coordinates were calculatedaccording
to
CIE
methods,2
using
each ofthe three
sets ofcolor-matching
functions,
for both
hard-and
soft-copy
stimuliconstituting
observer-determined metameric pairs.CIE
AL*, Aa*,
and Ab*valueswerecalculatedfor
all metameric pairs.Figure 5
shows10.0
A
b*oo
10.0
10.0
-i 1 1 r~
o
o
o
x
' I I L_
0.0
A
a*10.0
FIG.
5.
Intra-observer
(X),
andinter-observer
(0),
cyan-transparency
color matches relativeto
the
1931 CIE
2
Standard
Colorimetric
Observer
matchpoint
located
atthe
origin of aCIE
Aa*-Ab*
Aa*-Ab*
plotof
the
intra- andinter-observer soft-copy
color matchesfor
the
hard-copy
cyan-transparency,
with respectto the
1931
CIE
2Standard
Colorimetric
Observer
matchpointlocated
atthe
origin.Observer
Variability
For
all samplecolors,
the
maximumCIELAB
unitdifferences
were aslarge
as19.69
unitsfor
inter-observer
matches,
and11.36
unitsfor
intra-observer
matches,
indicating
arelatively large
spread of color matches.As
shownin
Table
V,
the
meanCIELAB
deviations
rangedfrom
-0.81to
0.67
unitsfor
inter-observer
matches,
andbetween
-1.63and0.78
unitsfor
intra-observer
matches.The
relatively
small meanCIELAB
deviations
for
the
inter-observer data
TABLE V.
Minimum,
maximum and meanCIELAB
unitdeviations
of colormatches
tabulated
by
observer,
andcolor-matching function.
Intra-observer
Inter-observers
CIE
2CIE
10Stiles-Burch
2CIE
2CIE
10Stiles-Burch
2A
L* minimum -4.14 -3.99 -4.12 -14.08 -14.62 -14.25A
L*maximum4.41
4.73
4.53
13.70
13.91
13.75
A
L*
mean
0.18
0.17
0.13
0.11
0.07
0.06
A
a*minimum -6.98 -8.76 -7.15 -15.71 -9.94 -14.35
A
a*
maximum
6.97
8.70
7.61
9.76
10.75
10.32
A
a*mean
0.36
0.78
0.60
0.15
0.67
0.37
A
b*
minimum -11.23 -11.36 -10.96 -19.69 -19.50 -18.89
A
b*
maximum
8.29
9.12
8.19
18.51
16.49
18.00
indicate
that the
average of all experimental color matches correlates well withthe
theoretical
color matches ofthe
standard observers.As
a measure of intra- andinter-observer
variability,
the
mean colordifference from
themean color match was calculatedusing
each ofthe three
setsof
color-matching functions.
The CIE
AE*ab
colordifference
equationwas used
to
compute color
differences between matching
stimuli.Table VI
showsthe
MCDM29 statistics
tabulated
according
to observers, media,
andcolor-matching
functions.
The
mean colordifference from
the
meanfor
inter-observer
matcheswas
approximately
twice
aslarge
asthe
meancolordifference
from
the
meanfor
intra-observer
matches.The
three
sets ofcolor-matching functions
usedto
calculate
MCDM
values yielded similarresults,
indicating
alack
ofdependence
TABLE VI.
Mean
colordifferences from
the
mean(MCDM)
for
all color matchestabulated
by
media,
color-matching
functions,
andobservers.
Prints
Inter-observers
Intra-observer Ratio
CIE
23.03
1.15
2.64
CIE
102.79
1.10
2.54
Stiles-Burch
22.98
1.11
2.69
Transparencies
CIE
22.31
1.56
1.49
CIE
102.45
1.53
1.60
Stiles-Burch
2"2.45
1.59
1.54
Prints & Transparencies
CIE
22.40
1.13
2.13
CIE
102.33
1.10
2.11
Stiles-Burch
2on
color-matching function.
Confidence
Regions
The
sample covariancematrix,
Slo,,
defined
by
the
sample covariances andvariances of
AL*, Aa*,
and Ab*values,
as shownin
Eq.
2,
was calculatedfor
eachcombination of
observer,
color-matching
functions,
color,
andmedium,
color-matching
data.
'Lab
S2L- SLJa. SLJb.
^a^L' $ a' ??*
(2)
Assuming
a multivariate normaldistribution,
the
inverse
ofthe
samplecovariance matrix
Sua,
canbe
usedto
construct a95%
confidence regionfor
the
sample distribution32 of
the
CIE
AL*Aa*,
and Ab* multivariatedata
setThe
p-dimensional
confidence regionfor
a sampledistribution
withprobability
(1-ct)
is
represented
by
the
quadraticdistance function
shownin
matrixform
in
Eqs. 3-5.
DS
!D'=Q
T)Lab
=[(AL
*)
(Aa
*)
(Ab
*)]
(4)
=
Pin-J)
(n-p)
Qsample
Distribution =-^
^- F,
x(5)
where
p
is the
number ofvariables,
nis
the
number ofobservations,
ais
the
Type I
alpharisk
associated witha100(l-a)%
confidenceregion,
F
is the
value ofthe
F distribution
for
p,
andn-p degrees
offreedom
with an alpha risk ofa.An
example of a Aa*-Ab*
bivariate
ellipsebound
by
the
95%
confidence regionfor
the
sampledistribution defined
by
Equation 3
is
shownin
Fig.
6,
for
the
inter-observer color matches of
the
cyantransparency
relativeto
the
1931
CIE
2
Standard Colorimetric
Observer. This
ellipsecanbe
thought
of asenclosing
95%
of
the
observer responsesfor
this
stimulus.A
^-dimensional confidence regionfor
the
mean of a sampledistribution
with
probability
(1-a)
can alsobe described
withEq.
3,
by
modifying
the
Q
term:
QSample
Mean =As
shownin Equation
6,
the
Q
term
for
the
sample meanis
afunction
ofthe
reciprocal of
the
samplesize;
as nincreases,
the
magnitude ofthe
Q
term
decreases.
Thus,
the
uncertainty
withwhichthe
meanis
known
decreases
withincreasing
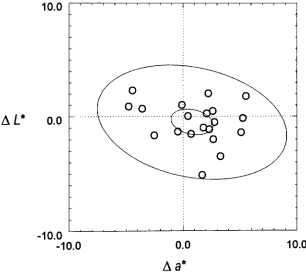
numbers of observers.An
example of a Aa*-Ab*bivariate
ellipsecontaining
the
95%
confidence regionfor
the
sample meandefined
by
Eq.
6 is
shown
in
Fig.
7,
for
the inter-observer
color matches ofthe
cyantransparency
relative
to the
1931
CIE
2Standard Colorimetric
Observer.
10.0
AD*
--10.0
-10.0
0.0
A
a*10.0
FIG.
6.
Twenty
inter-observer
(0)
cyan-transparency
color matchesbound
by
a95%
Aa*-Ab*bivariate
confidence ellipse ofthe
sampledistribution.
The
1931
CIE
210.0
Ab*
o.o
-10.0
-10.0
o.o
A
a*10.0
FIG. 7.
Twenty
inter-observer
(O)
cyan-transparency
color matchesbound
by
a95%
bivariate
Aa*-Ab*confidence ellipse ofthe
sample mean.The
1931 CIE
2
The
95%
confidence regionsfor
the
sampledistribution
andsample meanof
the inter-observer
cyan-transparency
color matches calculated withthe 1931
CIE
2Standard Colorimetric Observer
shownin
Figs. 6
and7
are plottedtogether
in
Fig.
8.
The larger
ofthe two
ellipses encompassesthe
distribution
ofthe
sample population of colormatches,
whilethe
smaller ellipsedescribes
the
uncertainty
ofthe
mean color match ofthe
sample population.10.0
A
b*o.o
-10.0
-10.0
0.0
A
a*10.0
FIG. 8.
Twenty
inter-observer
(0)
cyan-transparency
color matchesbound
by
95%
Aa*-Ab*bivariate
confidence ellipses ofthe
sampledistribution,
andthe
sample mean.
The 1931
CIE
2
Standard Colorimetric
Observer
matchpointis
In
additionto
the
Aa*-Ab*relationship
examinedin
Figs.
6-8,
it is
important to
considerthe
Afl*-AL*,
and Ab*-AL* planesbecause
the
experimentalcolor matches
involved
adjustmentsto
each ofthe three independent
variablesdefining
the CIELAB
color space.Figures
9
and10
showthe
95%
confidenceregions
for
the
sampledistribution
and sample means ofinter-observer
cyan-transparency
color matches calculated withthe
1931
CIE
2Standard
Colorimetric Observer
for
the
Aa*-AL*,
andAb*-AL*planes,
respectively.10.0
AL*
0.0
-10.0
-10.0
0.0
A
a* [image:48.563.99.405.309.587.2]10.0
FIG. 9.
Twenty
inter-observer
(0)
cyan-transparency
color matchesbound
by
Aa*-AL*95%
bivariate
confidence ellipses ofthe
sampledistribution,
andthe
sample mean.The 1931
CIE
2
10.0
AL*
o.o
-10.0
-10.0
0.0
Ab*
10.0
FIG.
10.
Twenty
inter-observer
(0)
cyan-transparency
color matchesbound
It
is
apparentfrom
Figs.
8, 9,
and10,
that at a95%
confidencelevel
the
mean color match of
the
twenty
observersfor
the
cyantransparency
is
notsignificantly different
than the
predicted color matchfor
the
1931
CIE
2Standard
Colorimetric Observer.
If any
one ofthe three
confidence regionsdefining
the
sample means ofthe
Aa*-Ab*, Aa*-AL*,
or Ab*-AL* planesdo
notcontain
the theoretical
meanmatchfor
a given standardobserver,
the
mean colormatches are considered
to
be statistically significantly different As
shownin
10
Ab*
o
-10
1 I 1 1 1 1 1 1 1
1 1 1 1 1 1 1 1
V
VL).\
\ * 1
-10
0
A
a*10
FIG.
1
1
.Twenty
intra-observer cyan-transparency
color matches
bound
by
both 95%
bivariate
confidence ellipses ofthe
sampledistribution,
andthe
sample mean
in
the
CIELAB
Aa*-Ab*
plane.
The
1931
CIE
2Standard
Colorimetric Observer
matchpointlocated
atthe
originis significantly different
atthe
a=.05
level
than the
mean color matches ofthe
Figs.
11-13,
the intra-observer
meancolor matchesfor
the
cyantransparency
aresignificantly different
than the
predicted color matchfor
the
1931
CIE
2Standard
Colorimetric
Observer
for
allthree
CIELAB
planes.It
canbe
concluded
that the
1931 CIE
2Standard Colorimetric
Observer
matchpointfor
the
cyantransparency
is
notincluded
or representedin
the
population ofcolor-matches made
by
the
single observer.AL*
o
-FIG.
12.
Twenty
intra-observer cyan-transparency
color matchesbound
by
both 95%
bivariate
confidence ellipses ofthe
sampledistribution,
andthe
sample meanin the CIELAB
Da*-DL
plane.The
1931
CIE
2
Standard
Colorimetric Observer
matchpointlocated
atthe
originis significantly
different
atthe
a=.05
level
than the
mean color matchesofthe
10
AL*
o
10
~r 1 1 1
r-~i 1 1 1 1
r-10
0
Ab*
10
FIG.
13.
Twenty
intra-observer cyan-transparency
color matchesbound
by
both 95%
bivariate
confidence ellipses ofthe
sampledistribution,
andthe
sample mean
in
the
CIELAB
Ab*-AL*
plane.
The
1931
CIE
2Standard
Colorimetric
Observer
matchpointlocated
atthe
originis
significantly
different
atthe
a=Bishop's
Test
Homogeneity
ofVariance
The
variability
ofdifferent
multidimensional populations canbe
compared witha multivariate
analog
to
Bartletfs
test
for
homogeneity
of variancein
aunivariate
population,
calledBishop's
test33Bishop's
test,
designed
to
comparethe
covariancematricesfor
k
populations,
is
presentedin
terms
ofthe
following
null and alternative
hypotheses:
Ho:
Zi=E2= =*=
(7)
Hi:
Ei
*for
atleast
onei.
(8)
Let
S,
be
the
sample estimate ofSi,
andlet
S*be
the
average ofthese
k
matricesweighted
by
degrees
offreedom.
Given
m =
(11,-1),
and 1=1(9)
(k-l)(p)(p
+l)
J
~2
(10)
the
test
statisticis
h
=ns
/m
i=l
If
-2mlogeh
>^.a),
rejectHo',
otherwisefail
to
rejectHo.
Bishop's
test
wasusedto
comparethe
sample covariances ofthe three
setsof
color-matching
functions
for
color matches madeby
both
intra- andinter-observers given
the
following
hypothesis:
Ho!
SciE2=SaElO" =Sstiles-Burch
2=S
(12)
Hi
:S,
*S
for
atleast
onei.
(13)
There
was no significa