Rochester Institute of Technology
RIT Scholar Works
Theses Thesis/Dissertation Collections
9-1-1996
Performance differences between White, Black and
Hispanic students
Jessica Gebhardt
Follow this and additional works at:http://scholarworks.rit.edu/theses
This Thesis is brought to you for free and open access by the Thesis/Dissertation Collections at RIT Scholar Works. It has been accepted for inclusion in Theses by an authorized administrator of RIT Scholar Works. For more information, please [email protected].
Recommended Citation
Performance Differences
Performance Differences Between
White, Black and Hispanic Students
on the Timed Subtests of the WISC-HI
Jessica L. Gebhardt
Rochester Institute of Technology
Rochester Institute of TechnoloJrr
Wallace Library Post Office Box 9887
Rochester, New York 14623-0887 716-475·2562 Fax 716-475-6490
SAMPLE stat~1mentsto reproduce
an
RIT thesis:t'cftMISSION GRANTED
Title of thesis _
I c - ' - . _ .. .' ._. __. '" ... _ ..' _ _ hereby~rant permission to the Wallace Memorial Library of the Rochester Institute of Technology to reproduce my. thesis in whole or in part. Any reproduction will not be for commercial use or profit.
Date: Signature of Author:
PERMISSION FROM AUTHOR REQUIRED
Title of thesis
p.pr-fr1r/,~.~-A-
nu
jJ
!'ffp-f'i
n~.s
I3...erWl Li"-, h)ky;k)I.S
I
~Lk.a n
tiL
I-h
t-rpa.
n
I 'C \ ft-1AoLR.!vS
D!1..
7hA
I t
f1...L<2-d
~rl
Ab+e
r
+- \'
of
'71-,.JL
U
)I(Ft -
II (
I Jessica L.Gebhardt prefer to be contacted each time a request for reproduction is made. I can be reached at the following address:
PHONE: (7//.c.)r.ol.o~--O~Lj
0
")"" ....? .
qlr2.Jf
/(;6
':.,...
~~:
..-." ,. .' '- ....
~I . - • •
---~--- ---'.---PERMISSION DEt\IED
Trtle of thesis _
i
hereby deny permission to the WallaceMemorial Library of the Rochester Institute of Technology to reproduce my thesis in whole or in part.
Performance Differences 1
Abstract
A major criticism ofintelligence tests is that they are biased against ethnic
minority groups. The purpose of this study was to examine whether
culturally different values affect the performance of ethnic minority students
onthese standardizedtests. The records of21 White, 34 Black and 18 Hispanic
students who had beengiven the WISC-HI were selected and scores on the
timed subtests were compared. No significant differences were found
between the White, Black and Hispanic groups on the basis of the overall
Performance Scale IQ scores. However, the White
students' scores on the
Verbal Scalewere significantly higher than those ofthe Black and Hispanic
students. Individual analysis of each timed subtest revealed three subtests
(Picture Arrangement, Block Design, and Arithmetic) on which White
students obtained significantly higher scores than did Black/Hispanic
students. The findings were inconclusive and tended to support previous
Performance Differences
2
Ethnic differences in measured cognitive abilities have been found
since intelligence tests were invented. The debate over the meaning of these
differences is
largely
responsible for the controversy over intelligence testingitself (Herrnstein & Murray, 1994, p.270). The
finding
that Black students tend to score on average 15-18 points below White students is notin question.What is contested is the reason for this discrepancy. Why does the average
Blackstudent obtain a mean IQ score of85, the average Hispanicstudent
90-95, and the average White student 100 (Lynn, 1992)?
There are two major perspectives on this question. Genetic theorists
focus on the high
heritability
ofintelligence (Jensen & Reynolds, 1982; Lynn,1991, 1992; Naglieri &Jensen, 1987; Reynolds & Kaiser, 1990); thatis, the
amount ofIQ variance due to genetic endowment. Itis impossible to deny
the existence of a genetic componentin intelligence. The controversy
surrounds the question of the extentto which genetic factors contribute to
intelligence. Environmentalists, on the other hand, focus on non-genetic
factors, such as bias within the testitself, bias within the testing situation,
environmental and economic disadvantage of many Black and Hispanic
families, and the experience ofbeing a minority (Bernal, 1990; Brody, 1987;
Mercer, 1988; Scarr & Weinberg, 1976; Schiele, 1991; Seligman, 1992).
Typically, most researchers agree thatboth genetics and environment
contribute to intellectual ability to some degree. The debate continues on
how much each factor contributes.
Performance Differences
3
intelligence tests may be biased inseveral ways. Constructbias exists
whenever a test purporting to measure a single construct in fact, measures
different constructs for different groups or when it measures the same
constructbutwith
differing
degrees of accuracy. An example ofthis type ofbias, provided
by
Bond (1981), exists whena test that purports to measureintelligence contains words to which some group has been exposed more
than others. A second form of internal testbias discussed in the literature is
when an item on a test is more difficult for members of one group than
another, otherwise known as content bias. According to Reynolds and Kaiser
(1990), this type ofbias exists whenthe wording ofa test questionis
unfamiliar to minority children so that although they may know the correct
answerthey are unable to respond because they did not understand the
question. A third type ofinternal biasis related to predictive or
criterion-related validity. The important questionhere is: Do the tests predict
performance equally well for whites andblacks? As explained by Neisser et
al. (1996), bias exists when Black performance on a variable, such as school
achievement and college GPA, is systematically higher than the same
subjects'
test scores predicted. It is generally thought that this is the most
important area of consideration. Research has not supported the existence of
bias in any ofthese three areas (Bernal, 1990; Bond, 1981; Cole, 1981;
Herrnstein & Murray, 1994; Reynolds & Kaiser, 1990; Sattler, 1992; Seligman,
1992).
Second, there is mixed evidence with regard to biases external to the
Performance Differences
4
examiner effects, and deficiencies intest-taking skills. Research on coaching
effects, specifically the effectiveness of commercial coaching schools to
increase students'
performance on standardized tests, such as the SAT, has revealed inconsistent results (Bond, 1981). Race of examiners has not been
found to affect Black children's performance (Herrnstein & Murray, 1994;
Sattler, 1992) or Hispanic children's performance (Sattler, 1992). Test
"language"
has been criticized as biased in favor of majority cultures.
Cultural bias was found to be a problem inIQ testing with non-English
speaking or English as a second language testees (Bernal, 1990; Herrnstein &
Murray, 1994; Seligman, 1992). Finally, deficiencies in test-taking skills have
been suggestedtobe another area of external testbias. According to Sattler
(1992), ethnic minorities may be deficientin the ability to employ test-taking
skills such as problem-solving strategies or balancing speedwith accuracy.
Specifically, some minorities may not view the testing experience as a time to
achieve.
Minority cultural values, social customs, perceptions, behavioral roles, social interactions and language usage are often different than those ofthe
majority culture. Assimilation into the majority culture may be difficult for
these reasons. Perhaps some of these differences also underlie the cultural
differences in intelligence test scores (Bernal, 1990; Boykin, 1983;
Diaz-Guerrero, 1987; Irvine, 1986; Neisseret al., 1996).
Manyresearchers propose that knowledge of cultural differences will
aid professionals in assessing the performance of students from different
cultural backgrounds (Boykin, 1983; Nuttall, Leon & Valle, 1990; Rotheram &
Performance Differences
5
values and practices of White American, Black American, and Hispanic
American students. In mainstream U.S., children are socialized to be
independent and competitive. Competition and time are valued; events are
tightly scheduled. In contrast, Hispanic and Mexican-American children are
taught to be obedient, cooperative, and dependent (Diaz-Guerrero, 1987;
Knight & Kagan, 1982; Nuttall et al., 1990; Rotheram & Phinney, 1987; Wenar,
1994). Cooperationis valued and time is flexible. Hispanics follow
polychrome time where many activities happen at once and stress is placed
upon completion of activities rather than adherence to preset schedules
(Nuttal et al., 1990). For example in schools, parents are often late for
appointments and have
difficulty
understanding that meetings with teachersoccur on a tightschedule. Diaz-Guerrero (1987) reported that the activity
level is lower and time seems to pass more slowly for the Mexican than the
Anglo-American child and thus, Mexican children see less movement and
have longer reaction times in test situations. Rotheram and Phinney (1987)
also report that time is slower and more present-oriented for Mexican
Americans than Anglo Americans. Bernal (1990) found that minority
children who were
highly
anxious about being tested performed well on math problems when they were allowed to pace themselves without timepressure.
Black children are taught dependence on
family
and community and adeep sense offamily kinship (Boykin, 1983; Nuttal et al., 1990).
Conformity
and interpersonal relationships in school are top priorities. Like Hispanics,Black children tend to have flexible and approximate concepts of time and
Performance Differences
6
time are governed
by
a subjective rather than objective reality. Time does notmove unidirectionally from the past to the future; it is elastic (Boykin, 1983).
For example, the length of a given month can vary as a function of the
relevant activities contained within it. Time is socially oriented and not
rigidly bound byclocks and calendars.
Irvine (1986) suggested that rates of performance on intellectual
measures among Blacks are depressed due to a propensity to avoid
intellectual competition. He suggests a self-fulfilling prophecy: a group
stereotype that Blacks perform poorly on intellectual tasks inhibits further
effective performance (Irvine, 1986). Blacks compete vigorously only in areas
where they have a modicum of success such as sports and entertainment.
Smither and Houston (1992) suggest that the interpersonal nature of
competitiveness implies that it is tied to an individual's actual or perceived
social environment. In environments where they feel successful, Blacks
compete; if theyperceive failure, they do not compete.
Vernon (1983) proposed that individual differences in intelligence
may, to some extent, be the result ofdifferences in the efficiency or speed with
which individuals can perform the basic components of
information-processing (encoding, short-term memory processing, and long-term memory
retrieval). These components, specifically speed of short-term memory
scanning and speed of retrieval of information from long-term memory, are
measured by timed tasks on the WISCTII. Lynn & Holmshaw (1990)
concluded in their study that about one-third of the White advantage on
Performance Differences
7
implies that White children may have an advantage on subtests which
require fast informationprocessing, such as is the case on timed subtests.
According to researchers, children acquire ethnic behavior patterns as
part oftheir ethnic identity (Boykin, 1983; Neisseret al., 1996; Nuttal et al.,
1990; Rotheram & Phinney, 1987; Wenar, 1994). Hispanic and Black children
tend to be more cooperative and have a less flexible concept of time than
White children who are more competitive and adhere to rigid time
schedules. Based on these identified differences among White, Black, and
Hispanic cultures, the differences in performance among these three groups
on the timed subtests ofthe WISC-III were investigated.
Method
Subjects
All students included in this study were enrolled in an inner city
elementary school consisting of kindergarten through sixth grade located in a
city ofapproximately 230,356 (World Almanac, 1990 Census) in Upstate New
York. In the year inwhich the studywas conducted, district records indicated
that approximately 72.5 percent ofthe student population was Black, 14.4
percentwas White, and 13 percent was Hispanic. The records of 21 White, 34
Black, and 18 Hispanicstudents were included. All students selected were
classified as disabled according to Part 200 Regulations of the Commissioner
of Education in New York State. Fifty-eight ofthe students were enrolled in
full-time special education placements, and fifteen were mainstreamed in
regular education. Records of all students enrolled at that time in special
Performance Differences
8
Educable
Mentally
Retarded (EMR) were excluded in an attemptto control forfactors other than culture (suchas low cognitive ability) that may influence
Performance Scale scores. However, records were included of children
classified as EMR if they were enrolled in non-EMR (mainstreamed into
regular education classrooms or included in special education classrooms
designated as LearningDisabled,
Emotionally
Disturbed orSpeech Impaired)classrooms. Scores ontimed subtests and the race of each student were
recorded.
Measures
Wechsler Intelligence Scale for Children
-III (Wechsler, 1991) The
Wechsler Intelligence Scale for Children III (WISC-III) is a widely used
measure of general cognitive ability forchildren aged 6 to 17. The test is
divided into two scales. The Verbal Scale measures skill levels in language
related intellectual functioning. The Performance Scale is a measure of non
verbal intellectual functioning. The WISCTII is well-standardized with
excellent reliability. The three scales have internal consistency reliability
coefficients of .96 for the Full Scale IQ, .95 for the Verbal Scale IQ, and .91 for
the Performance Scale IQ (Sattler, 1992). The WISC-III has adequate
concurrent, construct, and predictive validity. Concurrent validity study
results are as follows: 1) concurrent validity correlations between the
WISC-III and the WISC-R were .90 for theVerbal Scale, .81 for thePerformance
Scale, and .89 for the Full Scale; 2) concurrentvalidity correlations between
the WISC-III and the WAIS-R were .90 for the Verbal Scale, .80 for the
Performance Differences 9
correlations between the WISC-III and the WPPSI-R were .85 for the Verbal
Scale, .73 for the Performance Scale, and
.85 forthe Full Scale (Sattler, 1992).
Procedure
Testprotocols for each student selected for this study were reviewed
from the student's school records. The Full Scale IQ score, Verbal Scale IQ
score, Performance ScaleIQ score, scores on all timed subtests (Picture
Arrangement, Object Assembly, Block Design, Arithmetic, Symbol Search,
Coding, andMazes) and the race of the student were recorded. The Verbal
Scale IQ score was prorated after removing the Arithmetic subtest score as it is
the only timed subtestincluded on the Verbal Scale. All scores obtained by
Black and Hispanic students were compared to those of the White students
(however, Black and Hispanic scores were not compared with each other
because the study is investigatingwhether White students score higher than
Black and Hispanic students; the relationship between Black and Hispanic
students'
scores was not the focus of the study). No identifying information
was gathered.
Results
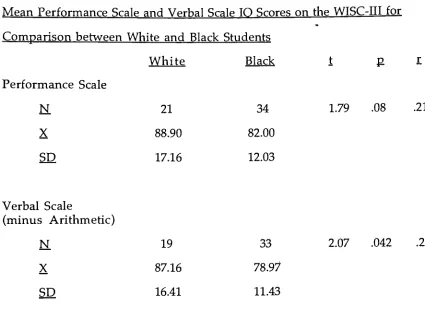
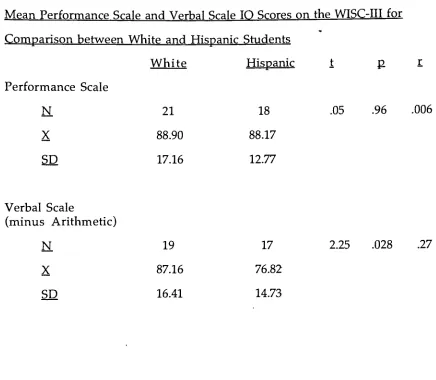
Although the meanPerformance IQ score ofWhite students (x =
88.90) was higherthan that ofBlack (5c = 82.00) and Hispanicstudents (x =
88.17), the differences were not significant(White/Black t (70) =
1.79,p_=.08, r =
.21; White/Hispanic t(70) =
.05,p_=.96, r=.006). However, White students had
significantly higher scores on the Verbal Scale than Blackstudents, t (66) =
2.07, p_=.042, r=.25; and Hispanicstudents, t (66)=
2.25, p_=.028, r=
.27. The
Performance Differences
10
and 76.82 forHispanic students. Table 1 shows comparisons between White
and Black students and Table 2 shows comparisons between White and
Hispanic students.
Insert Tables 1 and 2abouthere
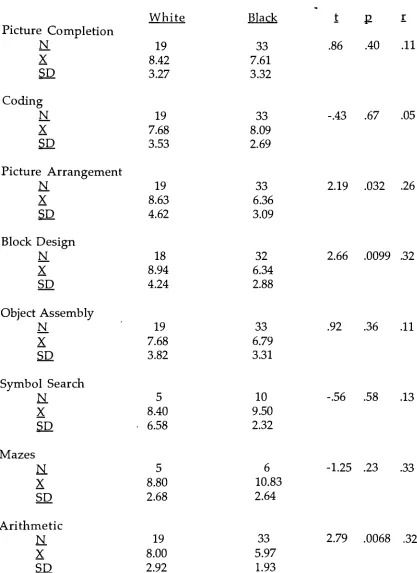
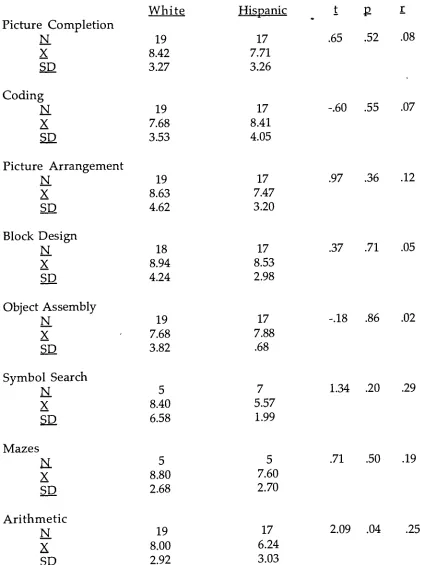
Scores ofWhite students were compared with those of Black and
Hispanic students on each ofthe individual timed subtests (Picture
Completion, Coding, Picture Arrangement, Block Design, Object Assembly,
Symbol Search, Mazes, and Arithmetic). The performance of White students
was significantly better on one of the eight timed subtests, Arithmetic, than
that ofthe Black, t (66)=2.79,
p_=.0068, r
-.32 or oftheHispanicstudents, t(66)
=2.09,
=.04, r=.25. The performance ofWhite students was
significantly
better than thatofthe Black students ontwo additional subtests
-Picture
Arrangement, t(66) =
2.19,=.032, r=.26 andBlock Design, t(64)=2.66,
p_=.0099, r=.32. Itshould be notedthatbecause ofmissing data instudent
records, the total number of subjects is not equal on each of the individual
timed subtests. The two subtests administered to the fewestsubjects were
Symbol Search and Mazes, subtests that are not required for the computation
ofthe Performance Scale. IQ score. The complete results for comparisons
between White and Black students on each subtest are displayed in Table 3
and between White and Hispanic students are in Table 4.
Performance Differences
11
Discussion
The current study compared the WISC-III Performance IQ scores, the
timed portion of the measure, of three culturally different groups of students,
White, Black and Hispanic, to determine whether time limits on
standardized tests affect minority children whose cultures do not emphasize
awareness of time constraints in the way that the majority culture does. This
study found no significant differences on the WISC-III Performance Scale
scores betweenWhite, Black and Hispanic students. Rather, on average
White students had significantly higher Verbal Scale scores than both Black
and Hispanic students.
Analysis oftimed subtest scores between the three groups yielded
inconsistent results. One subtest, Arithmetic (A), was significantly higher for
White than for Black and Hispanic children and two subtests, Picture
Arrangement (PA) and Block Design (BD) were significantly higher for White
than for Black children. Certain subtests on the Performance Scale, such as
Coding and Symbol Search, are closely tied to the child's ability towork
quickly (Sattler, 1992). Ifminority children were penalized by time limits,
their scores would be expected tobe significantly lower on these subtests than
on other subtests on the Performance Scale. This was not the case, however.
Although there were time bonuses for rapid, correct completion of test items
given on the three timed subtests on which white students scored
significantly higher (A, PA, and BD), the scores achieved on these
subtests were more dependent upon the measured abilities of the tasks than
the ability to work quickly. For example, ifa child had
difficulty
withmathematics but tended to solve problems quickly, the ability to work
Performance Differences
12
would not enable the child to achieve a high score on this subtest. It would be
theknowledge of mathematics concepts that was being assessed.
In addition, the difference in abilities as compared to White students
between Blackand Hispanic students was unexpected. In minority cultures,
such as Black and Hispanic, which do not emphasize competition and
working quickly, one would expect similar performance between the groups
on timed tasks. This was notthe case, however. Hispanic students'
scores
only differed significantly from whites on one subtest, whereas black
students'
scores differed significantly on three subtests. Time constraints may
have played a part in this significant difference, but it is likely that another
factor or factors was affectingblack students lowerperformance on the
Performance Scale subtests.
The results of the present study were in agreement with previous
findings that have failed to find intelligence tests biased against minority
children (Bernal, 1990; Bond, 1981; Cole, 1981; Herrnstein & Murray, 1994;
Reynolds & Kaiser; Sattler, 1992; Seligman, 1992). It is possible that a
significant difference between Performance scores was not found because
other factors (i.e. socioeconomic status) that have been known to influence
intelligence test scores were controlled. It is generally reported that the higher
a person's SES, the higher the intelligence score (Jensen & Reynolds, 1982;
Lynn, 1992; Mercer, 1988; Scarr & Weinberg, 1976; Seligman, 1992). Vincent
(1991) reported thatIQ differences between Blackand White children are
declining. IQ differences are not significant when SES is controlled (Vincent,
1991). In the year in which the study was conducted, the Home School
Performance Differences 13
districtin which the studywas conducted indicated thatout of the 991
students enrolled at the elementary school, 768 were home school students
and 223 of them attended from other areas in the city. No students attended
from urban or suburbanschool districts outside of the city. Ofthe 223
students who came from other schools in the city, 139 of them were classified
with a
handicapping
condition. Ofthe 768 home school students who attendthe home school, only 46 were classified with a
handicapping
condition.Therefore, itwas not possible to conclude that the 73 subjects included in this
study were from the same homogenous area of the city. However, all 73
subjects were from districts within the city and it was likely that the
homogeneity
ofSES ofthe city school districts was more similar than ifanumber of subjects were from school districts outside ofthe city. Further
investigation into the location and SES of the home school districts of each
subject would be necessary to conclude thatSES was a controlled variable in
this study.
A second explanation for the lack of a significantdifference between
Performance scores may be that researchhas consistently found that students
disadvantagedbythe language oftesting(standard English) typically score
higher on the performance than on the verbal subtests of the WISC-III
(Neisser, 1996). Sattler (1992) described the differences between Black English
and standard English. Although Black English shares many of the language
features with standard English, it has a numberof distinct features that
qualify it as a fully formed linguistic system with its ownrules, grammar, and
Performance Differences
14
communication between the examiner and Hispanic-American children who
often speak Spanish. Also, Hispanic children who are bilingual often speak a
complex mixture of both English and Spanish and never become proficient in
eitherlanguage.
The generalizibility ofthe current study's findings was limited by a
number offactors. All participants were selected from a single urban,
elementary school setting. Future research may expand selection to include a
variety of geographic regions and age levels. Students involved in this study
were all classified as disabled accordingto Part 200 of the Regulations of the
Commissioner ofEducation of New York State and most received their
educationin special education placements. The fact that a portion of the
students selected were mainstreamed into regular, education may have been a
confounding variable. The number of students within the classroom,
amount of individual teacher instruction and attention received by the
student and amount of social interaction with non-handicapped peers differ
between special and regular education classrooms. Any of these variables
may have had an effect on a student's performance on standardized tests.
Future studies involving regular education (non-classified) and
gifted/talented students may then serve as a comparison. The sample size of
this study was relatively small, limiting the generalizibility of results. In
addition, further research that seeks to identify patterns of performance on
Performance Differences
15
REFERENCES
Bernal, E.M. (1990).
Increasing
the interpretative validity and diagnosticutility ofhispanic children's scores on tests of achievement and
intelligence. In F.C. Serafica, A.I. Schwebel, R.K. Russell, P.D. Isaac, &
L.B. Myers (eds.), Mental health of ethnic minorities (pp.108-138).
New York: Praeger.
Bond, L. (1981). Bias in mental tests. In B.F. Green (ed.), Issues in testing:
Coaching, disclosure, and ethnicbias (pp.55-75). San Francisco:
Jossey-Bass Inc.
Boykin, A.W. (1983). The academic performance of afro-american children.
In J.T. Spence (ed.), Achievement and achievement motives:
Psychological and sociological approaches (pp. 338-347). SanFrancisco:
W.H. Freeman & Co.
Brody, N. (1987). Jensen, Gottfredson, and the black-white difference in
intelligence test scores. Behavioral and Brain Sciences, 10, 507-508.
Cole, N.S. (1981). Bias intesting. American Psychologist. 36. 1067-1077.
Diaz-Guerrero, R. (1987). Historical sociocultural premises and ethnic
socialization. In J.S. Phinney & M.J. Rotheram (eds.), Children's ethnic
socialization: Pluralism and development (pp. 242-249). Newbury Park,
CA: Sage Publications.
Herrnstein, R.J. & Murray, CM. (1994). The bell curve: Intelligence and class
structure in american life. New York: The Free Press.
Irvine, R.W. (1986). Education in the post-integration era. Journal of Negro
Performance Differences
16
Jensen, A.R. &Reynolds, C.R. (1982). Race, social class and ability patterns on
theWISC-R. Personality and Individual Differences, 3, 423-438.
Knight, G.P. &Kagan, S. (1982). Siblings, birth order, and
cooperative-competitive social behavior. Journal of Cross-Cultural Psychology, 13,
239-249.
Lynn, R. (1991). Race differences in intelligence: Aglobal perspective. The
Mankind Quarterly. 31. 255-296.
Lynn, R. (1992). Intelligence: Ethnicity and culture. In J. Lynch, C. Modgil, &
S. Modgil (eds.), Cultural diversity and the schools (pp. 361-375).
London: The Falmer Press.
Lynn, R. & Holmshaw, M. (1990). Black-white differences in reaction times
and intelligence. Social Behavior and Personality, 18, 299-308.
Mercer, J.R. (1988). Ethnic differences in IQ scores: Whatdo they mean? (A
response to Lloyd Dunn). Hispanic Tournal of Behavioral Sciences. 10,
199-218.
Naglieri, J.A. &Jensen, A.R. (1987). Comparison ofblack-white differences
on the WISC-R and the K-ABC: Spearman's hypothesis. Intelligence.
1121-43.
Neisser, U.; Boodoo, G.; Bouchard, T.J.; Boykin, A.W.; Brody, N.; Ceci, S.J.;
Halpern, D.F.; Loehlin, J.C.; Perloff, R.; Sternberg, R.J. & Urbina, S.
(1996). Intelligence: Knowns and unknowns. American Psychologist.
Performance Differences 17
Nuttall, E.V., De Leon, B., &Valle, M. (1990). Bestpractices inconsidering
cultural factors. InA. Thomas & J. Grimes (eds.), Bestpractices in
school psychology -IT (pp. 219-233). Washington, DC: National
Association of School Psychologists.
Reynolds, C.R. & Kaiser, S.M. (1990). Test bias in psychological assessment.
In T.B. Gutkin & C.R. Reynolds (eds.), Handbook of School Psychology
(pp. 487-525). NewYork: Wiley.
Rotheram, M.J. & Phinney, J.S. (1987). Ethnic behavior patterns as an aspect
of identity. In J.S. Phinney & M.J. Rotheram (eds.), Children's ethnic
socialization: Pluralism and development (pp. 201-207). Newbury Park,
CA: Sage Publications.
Sattler, J.M. (1992). Assessment of children (3rd ed.). San Diego: Author.
Scarr, S. & Weinberg, R.A. (1976). IQ testperformance of black children
adopted bywhite families. In J.V. McConnell & D.W. Gorenflo (eds.),
Classic Readings in Psychology (pp. 184-198). Chicago: Holt, Rinehart,
& Winston, Inc.
Schiele, J.H. (1991). An epistemological perspective on intelligence
assessment among African american children. The Tournal of Black
Psychology, 17,23-36.
Seligman, D. (1992). A question of intelligence: The IO debate in america.
NewYork: Birch Lane Press.
Smither, R.D. & Houston, J.M. (1992). The nature of competitiveness: The
development and validation of the competitiveness index.
Performance Differences
18
Vernon, P.A. (1983). Speed of information processing and general
intelligence. Intelligence. _ 53-70.
Vincent, K.R. (1991). Black/white IQ differences: Does age make the
difference? Tournal of Clinical Psychology, 47, 266-270.
Wenar, C. (1994). Developmental psychopathology: From infancy through
Performance Differences
19
Table 1
Mean Performance Scale and Verbal Scale IO Scores on the WISC-III for
Comparison between White and Black Students
White Black t p_ I
Performance Scale
N 21 34 1.79 .08 .21
X 88.90 82.00
SD 17.16 12.03
Verbal Scale
(minus Arithmetic)
N 19 33
X 87.16 78.97
SD 16.41 11.43
[image:22.577.70.495.119.439.2]Performance Differences 20
Table 2
Mean Performance Scale and Verbal Scale IO Scores on the WISC-III for
Comparison between White and Hispanic Students
White Hispanic t g
Performance Scale
N 21 18 .05 .96
X 88.90 88.17
S_D 17.16 12.77
.006
Verbal Scale
(minus Arithmetic)
N 19 17
X 87.16 76.82
SD 16.41 14.73
[image:23.577.67.503.102.482.2]Performance Differences 21
Table 3
Mean Timed Subtest Scores on the WISC-III for White and Black Students
White Picture Completion N 19 X 8.42 3.27
Coding
N 19 X 7.68 SD 3.53 Picture Arrangement N 19 X 8.63 SD 4.62 Block Design N 18 X 8.94 SD 4.24 Object Assembly N 19 X 7.68 SD 3.82 Symbol Search N_ 5 X 8.40SD - 6.58
Mazes N_ 5 X 8.80 SD 2.68 Arithmetic N 19 X 8.00 SD 2.92
Black t -P- r
33 .86 .40 .11
7.61
3.32
33 -.43 .67 .05
8.09
2.69
33 2.19 .032 .26
6.36
3.09
32 2.66 .0099 .32
6.34
2.88
33 .92 .36 .11
6.79
3.31
10 -.56 .58 .13
9.50
2.32
6 -1.25 .23 .33
10.83
2.64
33 2.79 .0068 .32
5.97
[image:24.577.70.487.131.704.2]Performance Differences 22
Table 4
Mean Timed Subtest Scores on the WISC-III for White and Hispanir Students
White Picture Completion N 19 X 8.42 SS 3.27 Coding N 19 X 7.68 SD 3.53 Picture Arrangement N 19 X 8.63 SD 4.62 Block Design N 18 X 8.94 SD 4.24 Object Assembly N 19 X 7.68 SD 3.82 Symbol Search N 5 X 8.40 SD 6.58 Mazes N_ 5 X 8.80 SJ2 2.68 Arithmetic N 19 X 8.00 SD 2.92 Hispanic 17 7.71 3.26 17 8.41 4.05 17 7.47 3.20 17 8.53 2.98 17 7.88 .68 7 5.57 1.99 5 7.60 2.70 17 6.24 3.03 t .65 .52 -.60 .55 .97 .36 .08 .07 .12
.37 .71 .05
-.18 .86 .02
1.34 .20 .29
.71 .50 .19
o cn CD o (0 cd o o CO CO o CO 15 ja L. CD > T3 C CO CD o c CO E o a. c CO CD 0 CJ W 75 fi CD > o 'c ca Q. GO 0) CO o CO o CO 2 IE J.. CD o CO CD o c CD E _. o t cu CL
o CO CO <t CJ o 00 CD "3"
C\J o
a> 00 CO 00 00 00 r-~ 1^- r- h- (^
I o en CD O CO *-CO CD +> n 3 cn a CD E P CD C o CO CD i_ o o cn CO CD H c CO CD c g. 'co CD Q JsC O O m c CD E CD c CD CD d. C O O c o HI Q. E o O cd i O CL o "c CD D. C0 CO CO 4-* H 3 CO o CD E _ _ CD
O) 00 co in -^ co cvj
I o cn CD o CO +-CO CD ** n cn T3 CD E \-CD C o CO CD k. o o cn ** CO CD H c CO CD o 0 E o CO c 0
frl CD
O-2 w 0 uQ X 3 _ CO o CO o CD 0 E H JZ o CD 0 0 CO JO o .J-J F M >, CO -Q E 0 co CO < o 0 -7 O
CJ 00 CO -t
ajoos peieos