Int. J. Electrochem. Sci., 12 (2017) 4811 – 4827, doi: 10.20964/2017.06.36
International Journal of
ELECTROCHEMICAL
SCIENCE
www.electrochemsci.org
Square Wave Anodic Stripping Voltammetry for Simultaneous
Determination of Trace Hg (II) and Tl(I) in Surface Water
Samples Using SnO
2@MWCNTs Modified Glassy Carbon
Electrode
Siyamthanda H. Mnyipika, Philiswa N. Nomngongo*
Department of Applied Chemistry, University of Johannesburg, P.O. Box 17011, Doornfontein, 2028, South Africa
*
E-mail: [email protected]; [email protected]
Received: 7 November 2016 / Accepted: 14 April 2017 / Published: 12 May 2017
A rapid, simple and sensitive electrochemical sensor based on glassy carbon electrode modified with tin oxide nanoparticles @ multiwalled carbon nanotubes have been used for determination of trace Hg(II) and Tl(I) using the square wave anodic stripping voltammetric (SWASV) technique. Under optimized condition, the limit of detection and quantification ranged from 0.9−1.2 ng L−1 and 3.3-4.0 ng L−1, respectively. The inter-day (n=10) and intra-day (n=7) precisions expressed in relative standard deviations at 50 μg L−1 of Hg(II) and Tl(I) ranged from 2.1-3.5 and 3.0-4.3%, respectively. The GCE/SnO2@MWCNTs was applied for the determination of the target trace elements in thirteen surface water samples. The accuracy of analytical results obtained using the developed electrochemical sensor was comparable to those obtained by the ICP-MS.
Keywords: Tin dioxide@multiwall carbon nanotubes; thallium (I); mercury (II), square wave anodic stripping voltammetry, surface water
1. INTRODUCTION
environmental samples [3]. However, natural processes, processing of ores and industrial applications can introduce thallium into the environment, thus elevating it background concentration [4]. Similar to Tl, mercury (Hg) is a highly toxic to human health, and it occurs naturally in the earth's crust. It is released into the environment as a result of human activity and natural processes [5]. Elemental and methyl Hg are toxic to the central and peripheral nervous systems. The inhalation of Hg vapour can produce harmful effects on the nervous, digestive and immune systems, lungs and kidneys, and may be fatal [6].
Monitoring and measuring Hg and Tl in the environment is therefore of great importance. Consequently, there is still an increasing need for sensitive, reliable and robust analytical techniques to measure trace levels of these elements. Traditionally, Hg and Tl quantification is carried out using relatively sensitive techniques. These include cold vapor atomic absorption spectrometry [7], inductively coupled plasma optical emission spectrometry (ICP-OES) [8], inductively coupled plasma-mass spectrometry (ICP-MS) [9], X-ray fluorescence spectrometry (XRF) [10] and graphite furnace atomic absorption spectrometry (GFAAS) [11]. Although these analytical techniques are the certified methods for trace metal determination and have high accuracy and the lowest detection limits, they are sophisticated and require highly skilled personnel [12]. They also require sample preparation before analysis, which is time-consuming and tiresome [13]. In addition, spectrometric techniques are not suitable for speciation (only suitable for total metal determination) and in-situ analysis of metals [14]. Therefore, the aforementioned challenges justify the search for rapid, simple and highly sensitive alternative analytical methods such as stripping based electrochemical techniques with improved limits of detections [15].
Electroanalytical techniques as alternative of spectrometric methods have been accepted as one of the most efficient tools for accurate quantification of trace metal ions such Tl and Hg in different sample matrices [16]. This is because electroanalytical methods are simple to operate, sensitive, rapid and uses low cost portable and easy to maintain instrumentation [15]. Among all electroanalytical methods, the stripping voltammetry provides a powerful tool for the determination of metal concentrations in environmental matrices. Stripping voltammetry (either cathodic or anodic) possess high-sensitivity and can simultaneously analyze several trace metal ions [17]. However, when dealing with difficult matrices, leakage in selectivity of a stripping voltammetric procedure becomes a serious challenge [15]. The leakage in sensitivity often occurs when different species in the sample undergo redox reactions at potential values that are very close to each other [15-16]. To overcome this challenge, the use common experimental handlings such chemical modified electrodes are recommended. In addition, modified electrodes significantly improve the accumulation efficiency of target analytes [14]. The nanostructured materials are extremely attractive to modify electrodes for electrochemical detection of trace metal ions. This is due to their unique electronic, chemical, thermal, and mechanical properties in comparison with conventional materials [14, 18]. Several researchers have reported the use of different chemical modifiers such as carbon nanotubes [19-23], graphene oxide [24-26], and nanometer sized metal oxides [27-28], nanocomposite of carbon based material mixed with nanometer sized metal oxides [29-31], among others.
sensing devices. The aim of this work was synthesise tin oxide nanoparticles @ multiwalled carbon nanotubes (SnO2@MWCNTs) nanocomposite and apply it to fabricate a electrochemical sensor for the simultaneous determination of Tl (I) and Hg (II) in environmental samples. Square wave anodic stripping voltammetry (SWASV) was used as the electroanalytical detection technique. In this study, SnO2 nanoparticles (NPs) were selected due its distinctive properties such as high electrical conductivity and chemical sensitivity [14]. Since SnO2 NPs agglomerates easily (thus affecting their electrochemical performance), MWCNTs was used as a support. MWCNTs were chosen because of their unique properties which include high surface area, chemical stability and high electrical conductivity, among others [32]. To the best of our knowledge it is the first time SnO2@MWCNTs nanocomposite is reported for simultaneous determination and Tl (I) and Hg (II) the combination of the two nanomaterials led to a highly sensitive electrochemical sensor. The optimization of factors affecting the electrochemical detection of Tl (I) and Hg (II) was achieved by full factorial design.
2. EXPERIMENTAL
2.1 Reagents and Materials
All other reagents and chemicals were of analytical reagent grade and doubly distilled water was used in experiments. high purity multiwall carbon nanotubes (MWCNTs, >95% purity), ethanol, sulphuric acid, sodium acetate, glacial acetic acid, hexacyanoferrate, cetyltrimethylammonium bromide (CTAB), sodium hydroxide N,N-dimethylformamide (DMF) were obtained from Sigma-Aldrich (Bellefonte, PA, USA). Standard stock solutions of Tl and Hg (1000 mg L−1, atomic absorption standard solutions) were obtained from Sigma-Aldrich. Acetate buffer (1.0 mol L-1) was used as a supporting electrolyte.
2.2 Instrumentation
Electrochemical measurement, cyclic voltammetry (CV), were performed using a μ-Autolab TYPE III and driven by the NOVA software (Version 1.8) in conjunction with a conventional three-electrode system and a personal computer for data storage and processing. A modified glassy carbon electrode employed as the working electrode and a platinum wire as the counter electrode. All potentials were referred to an Ag/AgCl/KCl (3 mol L-1) electrode. Electrochemical measurements were performed at room temperature.
2.3 Preparation of SnO2@ multiwalled carbon nanotubes nanocomposite
composites were prepared by a hydrothermal process; 15 mL ethyl alcohol, 15 mL distilled water, 20 mg purified MWCNTs, and 0.55 g cetyltrimethylammonium bromide (CTAB) were added to a 100 mL flask and the mixtures were sonicated using Branson 5800 ultrasonic system (UK) for 1 hour to disperse the MWCNTs uniformly. To the mixture, 0.08 g SnCl4·5H2O was added and treated with mechanical agitation at 60 rpm for 45 min, then 4 mol L-1 sodium hydroxide (NaOH) solution was dropped to increase the pH to 12. Afterward, the mixed solution was transferred into an oven and ept at 100 C for 10h. Finally, the solid phase was filtered and washed with deionized water and ethanol respectively for several times, and dried in an over at 70 °C.
2.4 Sample collection and preparation
Surface water samples were from the East Rand region (Johannesburg South Africa) and were kept in 1000 mL polypropylene bottles. All water samples were acidified with nitric acid and stored in the fridge at 4 C until analysis. he elemental analysis was performed using the optimum conditions. Before analysis the samples were filtered through 0.2 µm PVDF acrodisc syringe filter. The standard addition and calibration curve methods were used to determine the concentration of the target analytes in the samples.
2.5 Modification of glassy carbon electrode
The modification of glass carbon electrode (GCE) was achieved using a simple casting method. Prior to modification, the GCE was polished with 1.0, 0.3 and 0.05 μm alumina powder, respectively, and rinsed with doubly distilled water, followed by sonication in ethanol and doubly distilled water for 5 min, respectively, the GCE was allowed to dry. About 5 mg of SnO2@MWCNTs was dispersed in 15 mL of DMF in a glass bottle for 30 minutes using ultrasonic homogenizer to obtain a homogeneous suspension. SnO2@MWCN electrode was prepared by casting 5 μL MWCN suspensions on the GCE surface using a micropipette. In order to allow evaporation of the solvent, the modified GCE was left to dry in a laminar flow at room temperature for about 24 h. Modified GCE was characterized by cyclic voltammetry and electrochemical impedance spectroscopy in a solution of 0.01 mol L-1 K3Fe (CN)6.
2.6 Analytical procedure
deposits on the surface of the modified electrode. The peak currents at potentials about -0.76 and 0.18 V for Tl+ and Hg2+ were measured.
2.7 Optimization strategy of square wave anodic stripping voltammetric analysis
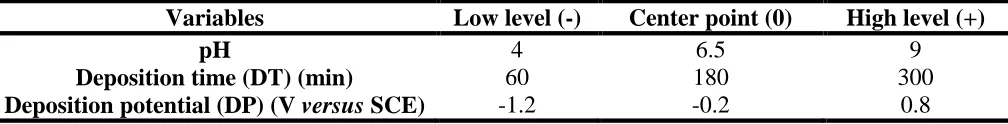
[image:5.596.48.552.324.386.2]The effect of the most influential experimental parameters for the determination of trace elements using SWASV was investigated using experimental designs. In the first step which involves screening step, a two-level full factorial design was used. In the latter, three variables, that is, deposition time (DT), deposition potential (DP) and sample pH, were investigated (Table 1). Secondly, the central composite design was used to obtain the optimum conditions of the most influential factors such as deposition time (DT), deposition potential (DP) and sample pH. STATISTICA version 13 (Statsoft) software was used for processing experimental data.
Table 1. Levels of variables investigated for the optimization of SWASV conditions
Variables Low level (-) Center point (0) High level (+)
pH 4 6.5 9
Deposition time (DT) (min) 60 180 300
Deposition potential (DP) (V versus SCE) -1.2 -0.2 0.8
2.8 Comparative method
An inductively coupled plasma mass spectrometry (ICP-MS) was used as the reference method. ICP-MS experiments were performed on an Agilent 7900 (Agilent Technologies Inc., Tokyo, Japan) equipped with Ultra High Matrix Introduction (UHMI) option, octopole reaction system and an ASX-520 autosampler. Argon was used as plasma, make up and carrier gas while helium was used as collision gas in the octopole reaction system. Before all analyses, the ICP-MS was tuned using a 1.0 mg L-1 solution of lithium (7Li), yttrium (89Y), thallium (205Tl) and cerium (140Ce). The ICP-MS drift was corrected by using bismuth as internal standard at a concentration of 1.0 mg L-1. Quality assurance and quality control (QC) of analysis included the analysis of blanks and quality control standard. In addition, after every 10 samples, QC standard and blanks were analysed.
3. RESULTS AND DISCUSSION
3.1. Characterization of SnO2@MWCNTs nanocomposites
SnO2 was homogeneously dispersed on the surface of MWCNTs (Fig. 1g-h). This suggests that the MWCNTs could be served as template for SnO2 growth.
500 nm
200 nm 20 nm
[image:6.596.85.505.217.691.2]
3.3 Electrochemical characterization
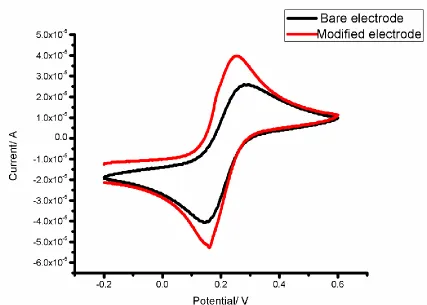
Cyclic voltammetry is known to provide interface information of the electrode surface in dependence of the modification process. Therefore, to characterize the conductivity of modified and unmodified GCE, the cyclic voltammetric behaviour were carried using Fe3(CN)6 in 0.1 M KCl at potential scan rate of 100 mV s-1 (Fig. 2). It can be seen from this that a well defined CV redox process from [Fe(CN)6]3-/4- was observed at the bare GCE (Fig. 2a).In addition, it was observed that after the GCE was modified with SnO2@MWCNTs, the redox couple peak currents increased. These results suggest that the introduction of SnO2@MWCNTs can improve the electroactivity of the GCE electrode. These results further confirmed that the immobilization of SnO2@MWCNTs onto GCE significantly enhanced the electrodes electroactivity, thus providing a suitable platform for detection of trace Hg and Tl. The significant increase of the estimated electroactive surface area was attributed to the combined unique properties of such as electrical conductivity and chemical sensitivity high surface area, chemical stability and high electrical conductivity [34].
Figure 2. Cyclic voltammograms measured with bare and SnO2@MWCNTs nanocomposite modified GCE in the solution of 5 mM Fe3(CN)6containing 0.1 mol L-1 KCl.
3.4 Electrochemical impedance characterization of the GCE/SnO2@MWCNTs
[image:7.596.86.513.323.628.2][image:8.596.92.510.243.553.2]
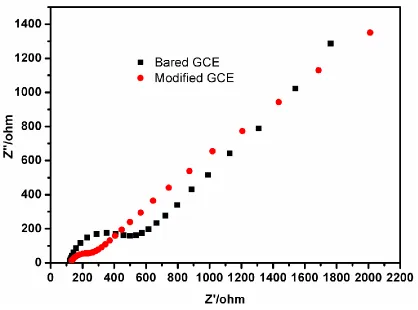
the electrode [34] Therefore, in this study, EIS was used characterize interface properties of the GCE/SnO2@MWCNTs. Fig. 3 presents Nyquist plot of electrochemical impedance spectra for bare and SnO2/MWCNTs nanocomposite modified GCE. Typically, the Nyquist plot has semicircle portion that correspond to the electron-transfer resistance (Ret) at higher frequency range and a linear part at lower frequency range that represents the diffusion limited process [14]. It can be seen that compared to the base electrode, the modified GCE resulted to decreased Ret value and it displayed an almost straight line. This observation was attributed to the promotion of electron transfer process at the modified GCE surface [14]. These results were in agreement the finding obtained from the cyclic voltammogram.
Figure 3. Nyquist diagram of electrochemical impedance spectra for bare GCE, SnO2, MWCNTs and modified GCE/SnO2@MWCNTs in the solution of 5 mM Fe3(CN)6 containing 0.1 mol L-1 KCl.
achieve the accurate simultaneous determination Tl+ and Hg2+ in mixture samples in comparison with other studies [36]. On the other hand, the electrode response can be optimized for enhancing sensitivity, through surface modification[36].
Figure 4. Simultaneous detection of GCE, GCE/MWCNTs and GCE/SnO2@MWCNTs
3.6 Optimization of experimental SWASV parameters
[image:9.596.78.520.149.485.2]
importance of factors pH, DP, and DT for Tl, response surface methodology based on central composite design (CCD) was used for further optimization.
Tl Hg
Figure 5. Pareto chart of standardized effects for variables in the determination of Tl and Hg
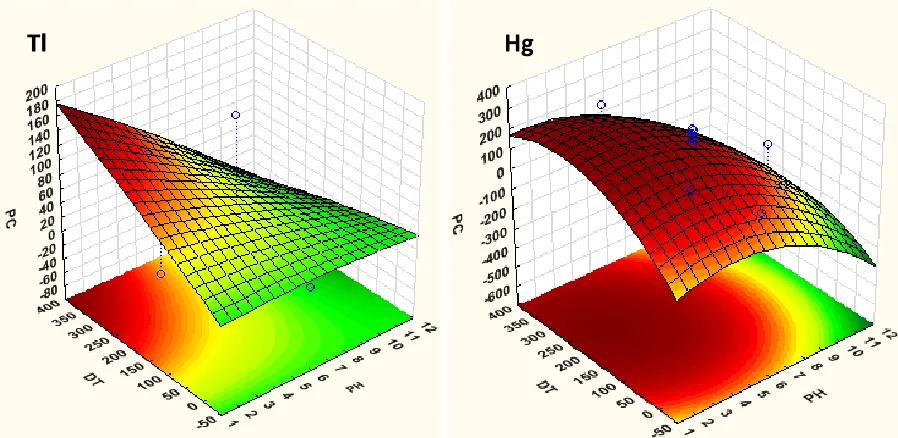
Central composite design was used to evaluate and optimize main, interaction and quadratic effects of the most influential factors (pH, DP, and DT). The design matrix together with respective analytical responses for twenty experiments is presented in Table S2.
[image:10.596.70.522.133.327.2]Tl
Hg
Figure 6. Response surface plots obtained for Tl and Hg after electrochemical determination
[image:10.596.73.522.441.660.2]
(for simplicity, equations are not included). According to the response surfaces and the quadratic, the overall optimum conditions that led to relatively high analytical responses for both analytes were found to be 4.5, -1.2 V and 180 min, for sample pH, deposition potential, and time, respectively.
3.6 Analytical performances
Under optimum conditions, the calibration curves were constructed using ten successive standard solutions at a concentration ranged from 0-500 µg L−1. Each calibration point was measure use six times using the same modified electrode. The useful linear dynamic ranges, correlation coefficients and calibration linear equations are shown in Table 2. The repeatability of the peak current expressed in terms of relative standard deviation (%RSD) at each calibration point ranged from 1.6-4.5%. The limit of detection (LOD) and quantification (LOQ) defined as
m S LOD 3 b
and
m S
[image:11.596.46.560.585.742.2]LOD10 b , where, Sb and m are the standard deviation of the blank (n=15) and the slope (n = 6) of the calibration graph, respectively, are summarized in Table 2. The inter-day (repeatability) precision of the SnO2@MWCNTs–GCE in the determination of Hg+ and Hg2+ was evaluated by performing ten determinations of the same standard solution containing 50 µg L−1 of the target analytes. In addition, the intra-day (reproducibility) precision of the response was studied using seven electrodes prepared from the same batch in different days. The performance of these modified electrodes was evaluated by conducting the determination of 50 µg L−1 of the target analyte model sample solution. The repeatability and reproducibility results (in terms of %RSD) of the SnO2@MWCNTs–GCE ranged from 2.1-3.5 and 3.0-4.3%, respectively. These results revealed the suitability of simultaneous determination of Tl+ and Hg2+. Under optimized conditions, the stability of modified electrode was investigated a period of three weeks by successive SWASV detection of mercury (II) and thallium (I). After two weeks and three day, the average %RSD for the peak current signal was 3.1 % and the peak potentials remain unchanged.
Table 2. Analytical figures of merit
Analytical parameters Hg2+ Tl+
Dynamic linear range (µg L-1)
0.004-400 0.003-450
Calibration linear
equations (µA) 0.0981 (µgL ) 2.158
-1
C
Ipa (µA) 0.0889 (µgL-1)3.158
C Ipa
Correlation coefficients (r2)
0.9987 0.9991
LOD (ng L-1) 1.2 0.9
LOQ (ng L-1) 4.0 3.0
Repeatability (%RSD) 3.5 2.1
Reproducibility (%RSD)
3.0 4.3
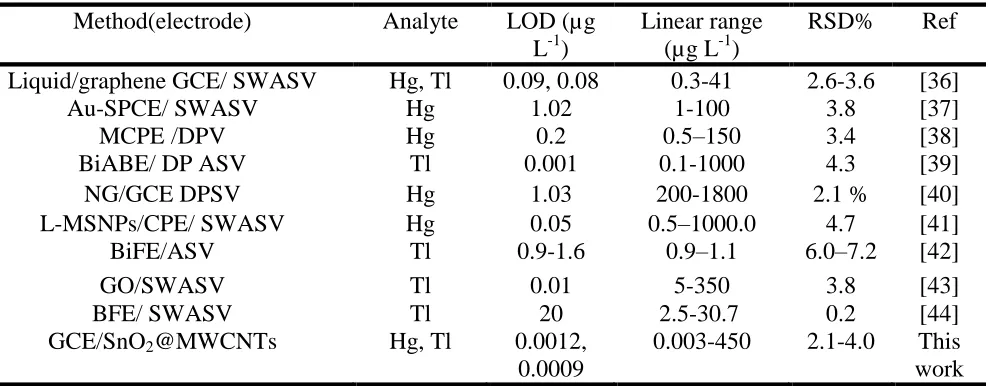
3.8 Comparison of the performance of GCE/SnO2@MWCNTs with other reported modified electrodes
[image:12.596.59.553.268.461.2]A comparison of the developed GCE/SnO2@MWCNTs with other modified electrodes reported by other researchers for determination of Tl and Hg in environmental samples is summarized in Table 3. The LOD and LOQ obtained in this study were lower or similar to those reported by other authors in the literature. In addition, analytical performances of the current method revealed that the proposed SnO2@MWCNTs–GCE method has relatively high RSDs compared to in the literature listed in Table 3.
Table 3. Comparison of analytical performances of different modified electrodes for the determination of Tl+ and Hg2+ environmental samples
Method(electrode) Analyte LOD (µg L-1)
Linear range (µg L-1)
RSD% Ref Liquid/graphene GCE/ SWASV Hg, Tl 0.09, 0.08 0.3-41 2.6-3.6 [36]
Au-SPCE/ SWASV Hg 1.02 1-100 3.8 [37]
MCPE /DPV Hg 0.2 0.5–150 3.4 [38]
BiABE/ DP ASV Tl 0.001 0.1-1000 4.3 [39]
NG/GCE DPSV Hg 1.03 200-1800 2.1 % [40]
L-MSNPs/CPE/ SWASV Hg 0.05 0.5–1000.0 4.7 [41]
BiFE/ASV Tl 0.9-1.6 0.9–1.1 6.0–7.2 [42]
GO/SWASV Tl 0.01 5-350 3.8 [43]
BFE/ SWASV Tl 20 2.5-30.7 0.2 [44]
GCE/SnO2@MWCNTs Hg, Tl 0.0012,
0.0009
0.003-450 2.1-4.0 This work SWAV= square wave anodic striping voltammetry/ GCE = glassy carbon electrode; Au-SPCE = gold screen printed carbon electrode; MCPE = magnetic carbon paste electrode, DPV = differential pulse voltammetry; DPSV = differential pulse striping voltammetry; NG = N-doped graphene; ASV = anodic striping voltammetry; L-MSNPs = silica nanoparticles, modified by a newly synthesized Schiff base ligand; CPE = carbon paste electrode; BiFe or BFE = bismuth film electrode
3.9 Interference study for Hg (II) and Tl (I) determination
Figure 7. Interferences studies
In view of the above discussion, Cd is not only element that exists in environmental matrices. Therefore, the effect of multielement for the determination of Hg2+ and Tl+ was investigated. The analytical performance of SnO2/MWCNTs in the presence of 200 µg L−1 multielement solution mimicking the real water matrix revealed that Tl+ and Hg2+can be accurately quantified.
3.10 Sample analysis
[image:13.596.94.504.77.381.2]
Table 4. Validation of the developed electrochemical sensor
Samples Tl(I) Hg(II)
Added (µg L-1) Found(µg L-1) Recovery (%) Found (µg L-1) Recovery
SW1 0.00 0.831±0.001 - 2.64±0.02 -
2.00 2.75±0.05 96.0 4.63±0.11 99.1
5.00 5.80±0.04 99.4 7.59±0.02 99.0
10.0 10.8±0.07 99.6 12.6±0.05 99.3
SW2 0.00 <LOD - 2.29±0.04 -
2.00 1.96±0.05 98.0 4.24±0.05 97.5
5.00 4.98±0.03 99.6 7.25±0.06 99.2
10.0 9.97±0.08 99.7 12.2±0.09 99.5
In view of the above discussion, the developed method was further used for determination of the target analysis in the remaining ten surface water samples (Table 5). In addition, in order to investigate accuracy of the developed electrochemical sensor, we compared the results obtained by the proposed method against reference method (ICP-MS). At 95% confidence level, the results obtained by SnO2@MWCNTs–GCE sensor showed a good agreement with those obtained by ICP-MS (Table 5). This findings confirmed applicability and validity of the SnO2@MWCNTs–GCE sensor for precise and accurate determination of the mercury and thallium ions in environmental samples.
Table 5. Analysis of Tl(I) and Hg(II) in real water samples
Samples Tl(I) Hg(II)
SnO2@MWCNTs–GCE ICP-MS SnO2@MWCNTs–GCE ICP-MS
SW 3 0.581±0.02 0.592±0.07 1.91±0.10 1.92±0.03
SW 4 0.224±0.04 0.231±0.06 2.14±0.05 2.28±0.06
SW 6 0.375±0.03 0.381±0.05 2.26±0.03 2.35±0.12
SW 7 <LOD <LOD 1.71±0.01 1.80±0.04
SW 8 0.512±0.01 0.515±0.03 1.65±0.11 1.75±0.12
SW 9 0.437±0.01 0.441±0.01 1.99±0.05 2.05±0.08
SW 10 1.08±0.05 1.11±0.07 1.39±0.09 1.45±0.05
SW 11 <LOD <LOD 1.38±0.07 1.41±0.02
<LOD = below limits of detection
4. CONCLUSION
[image:14.596.41.563.445.589.2]
dynamic range, a relatively low detection limit, high precision and accuracy. In addition, the electrochemical characterization and analytical results revealed that the modified glassy carbon electrode had good electrochemical activity and high sensitivity for the determination of the target elements. The developed electroanalytical procedure was found to be suitable for the determination of ultra-trace levels of Hg(II) and Tl(I) in surface water samples and the results were not significantly different from those obtained by reference method.
ACKNOWLEDGEMENT
The authors wish to thank University of Johannesburg (Applied Chemistry, Centre for Nanomaterial Science Research Centre) and National Research Foundation (NRF, South Africa, grant no. 98745 & 99270 ) for financial assistance.
References
1. A. Afkhami, R. Moosavi, T. Madrakian, H. Keypour, A. Ramezani‐Aktij, M. Mirzaei‐Monsef, Electroanal., 26 (2014) 786.
2. K. Duarte, C.I. Justino, A.C. Freitas, A.M. Gomes, A.C. Duarte, T.A. Rocha-Santos, TrAC Trend. Anal. Chem., 64 (2015) 183.
3. A. M. Nowicka, M. Mackiewicz, E. Matysiak, B. Krasnodebska-Ostrega, Z. Stojek, Talanta, 106 (2013) 85.
4. B. Karbowska, W. Zembrzuski, M. Jakubowska, T. Wojtkowiak, A. Pasieczna, Z. Lukaszewski, J. Geochem Explor., 143 (2014) 127.
5. J. Xu, A.G. Bravo, A. Lagerkvist, S. Bertilsson, R. Sjöblom, J. Kumpiene, Environ. Int. 74 (2015) 42.
6. WHO, (World Health Organization). 2007. Exposure to Mercury: A Major Public Health Concern. Geneva:WHO Available: http://www.who.int/ipcs/features/mercury.pdf accessed 15 May 2015. 7. I. L. Almeida, M. D. Oliveira, J. B. Silva, N. M. Coelho, Microchem. J., 124 (2016) 326
8. G. Luis, C. Rubio, C. Revert, A. Espinosa, D. González-Weller, A. Gutiérrez, A. Hardisson, J. Food Comp. Anal., 39 (2015) 48.
9. R. Clough, H. Sela, A. Milne, M.C. Lohan, S. Tokalioglu, P.J. Worsfold, Talanta 133 (2015) 162. 10.K. Kocot, R. Leardi, B. Walczak, R. Sitko, Talanta ,134 (2015) 360.
11.I. Akinyele, O. Shokunbi, Food Chem., 173 (2015) 682.
12.F. Arduini, J. Q. Calvo, G. Palleschi, D. Moscone, A. Amine, TrAC Trend. Anal. Chem., 29(11) (2010) 1295.
13.P. N. Nomngongo, J. C. Ngila, V. O. Nyamori, E. A. Songa, E. I. Iwuoha, Anal. Lett., 44(11) (2011) 2031.
14.Y. Wei, C. Gao, F.-L. Meng, H.-H. Li, L. Wang, J.-H. Liu, X.-J. Huang, J. Phys. Chem., 116(1) (2011) 1034.
15.P. N. Nomngongo, J.C. Ngila, J. Iran. Chem. Soc., 12 (2015) 2141.
16.A. A. Ensafi, A.R. Allafchian, M. Saraji, B. Farajmand, Talanta, 99 (2012) 335.
17.Y. Guo, N. Huang, B. Yang, C. Wang, H. Zhuang, Q. Tian, Z. Zhai, L. Liu, X. Jiang, Sens. Actuators B Chem., 231 (2016) 194.
18.V. Georgakilas, J.N. Tiwari, K.C. Kemp, J.A. Perman, A.B. Bourlinos, K.S. Kim, R. Zboril, Chem. Rev., 116(9) (2016) 5464.
20.M. I. Saidin, I. M. Isa, M. Ahmad, N. Hashim, A. Kamari, S. Ab Ghani, S.M. Si, Microchim. Acta, (2016) 1-8.
21.X. Li, Y. Liu, L. Zheng, M. Dong, Z. Xue, X. Lu, X. Liu,, Anal. Chim Acta, 113 (2013) 170. 22.H. Khani, M. K. Rofouei, P. Arab, V. K. Gupta, Z. Vafaei, J. Hazard. Mater., 183(1) (2010) 402. 23.V. K. Gupta, A. K. Jain, S. K. Shoora, Anal. Chim. Acta, 93 (2013) 248.
24.F. Gao, X. Cai, X. Wang, C. Gao, S. Liu, F. Gao, Q. Wang, Sens. Actuators B Chem., 186 (2013) 380.
25.S. Kumar, G. Bhanjana, N. Dilbaghi, R. Kumar, Sens. Actuators B Chem., 227 (2016) 29. 26.C. Wu, D. Sun, Q. Li, K. Wu, Sens. Actuators B Chem., 168 (2012) 178.
27.A. F. Shojaei, K. Tabatabaeian, S. Shakeri, F. Karimi, Sens. Actuators B Chem., 230 (2016) 607. 28.T. Madrakian, S. Maleki, M. Heidari, A. Afkhami, Mater Sci. Eng., 63 (2016) 637.
29.D. Yang, L. Wang, Z. Chen, M. Megharaj, R. Naidu, Electrochim. Acta 132 (2014) 223. 30.Q. Wu, Q. Sheng, J. Zheng, Microchim. Acta, (2016) 1-9.
31.T. Peik-See, A. Pandikumar, H. Nay-Ming, L. Hong-Ngee, Y. Sulaiman, Sens. Actuators B Chem., 14(8) (2014) 15227.
32.C. Gao, Z. Guo, J. H. Liu, X. J. Huang, Nanoscale 4 (2012) 1948.
33.V. M. Aroutiounian, V. M. Arakelyan, G. E. Shahnazaryan, M. S. Aleksanyan, K. Hernadi, Z. Nemeth, L. Forro, Adv. Nano Res. 3 (2015) 1-11.
34.A. Muhammad, N. A. Yusof, R. Hajian, J. Abdullah, Sensors, 16(1) (2016) 56.
35.H. Bagheri, A. Afkhami, H. Khoshsafar, M. Rezaei, A. Shirzadmehr, Sens. Actuators B Chem., 186 (2013) 451-460.
36.H. Bagheri, A. Afkhami, H. Khoshsafar, M. Rezaei, S. J. Sabounchei, M. Sarlakifar, Anal. Chim. Acta, 870 (2015) 56-66.
37.I. T. Somé, A. K. Sakira, D. Mertens, S. N. Ronkart, J. M. Kauffmann, Talanta, 152 (2016) 335-340.
38.M. Fayazi, M. A. Taher, D. Afzali, A. Mostafavi, Sens. Actuators B Chem., 228 (2016) 1-9. 39.K. Węgiel, K. Jedlińs a, B. Baś, J. Hazard. Mater. 310 (2016) 199.
40.H. Xing, J. Xu, X. Zhu, X. Duan, L. Lu, W. Wang, Y. Zhang, T. Yang, J. Electroanal. Chem., 760 (2016) 52.
41.A. Afkhami, F. Soltani-Felehgari, T. Madrakian, H. Ghaedi, M. Rezaeivala, Anal. Chim. Acta, 771 (2013) 21.
42.N. Lezi, C. Kokkinos, A. Economou, M. I. Prodromidis, Sens. Actuators B Chem., 182 (2013) 718. 43.N. Spano, A. Panzanelli, P. C. Piu, M. I. Pilo, G. Sanna, R. Seeber, A. Tapparo, Anal. Chim. Acta,
553 (2005) 201.
[image:16.596.46.554.636.763.2]44.E. Jorge, M. Neto, M. Rocha, Talanta, 72(4) (2007) 1392. SUPPLEMENTARY DATA:
Table S1. Matrix of 23 full factorial designs (actual values) for the optimization of experimental parameters and the response values
EXPT pH DT DP PC (µA)
Tl Hg
1 4 60 -1.2 34 81.1
2 9 60 -1.2 58 122
3 4 300 -1.2 95 169
4 9 300 -1.2 122 133
5 4 60 0.8 -12.5 -11.5
7 4 300 0.8 -14.1 -11.4
8 9 300 0.8 -14 0
9 6.5 180 -0.2 0 68.9
10 6.5 180 -0.2 0 31.7
[image:17.596.44.551.217.555.2]11 6.5 180 -0.2 0 33.3
Table S2. List of experiments in the Box-Behnken (actual values) for further optimization of SQWAV and the response values
EXPT pH DT (min) DP (V) PC (µA)
Tl Hg
1 4 60 -1.2 35.3 76.1
2 9 60 -1.2 10.4 6.34
3 4 300 -1.2 107 110
4 9 300 -1.2 43.2 10.2
5 4 60 0.8 -1.83 -216
6 9 60 0.8 -2.52 -1.07
7 4 300 0.8 -2.39 -0.277
8 9 300 0.8 -1.33 0
9 2.3 180 -0.2 0 15.1
10 10.7 180 -0.2 0 0
11 6.5 0 -0.2 0 33.7
12 6.5 382 -0.2 0 0
13 6.5 180 -1.9 171 26.9
14 6.5 180 1.5 -3.82 0
15 6.5 180 -0.2 0 233
16 6.5 180 -0.2 0 208
17 6.5 180 -0.2 0 184
18 6.5 180 -0.2 0 162
19 6.5 180 -0.2 0 144
20 6.5 180 -0.2 0 126