Wildlife Trade 2008
An analysis of the European Union and candidate countries’
annual reports to CITES
Prepared by
UNEP World Conservation Monitoring Centre
219 Huntingdon Road Cambridge
CB3 0DL United Kingdom Tel: +44 (0) 1223 277314 Fax: +44 (0) 1223 277136 Email: species@unep-wcmc.org Website: www.unep-wcmc.org
ABOUT UNEP-WORLD CONSERVATION MONITORING CENTRE
The UNEP World Conservation Monitoring Centre (UNEP-WCMC), based in Cambridge, UK, is the specialist biodiversity information and assessment centre of the United Nations Environment Programme (UNEP), run cooperatively with WCMC, a UK charity. The Centre's mission is to evaluate and highlight the many values of biodiversity and put authoritative biodiversity knowledge at the centre of decision-making. Through the analysis and synthesis of global biodiversity knowledge the Centre provides authoritative, strategic and timely information for conventions, organisations and countries to use in the development and implementation of their policies and decisions.
The UNEP-WCMC provides objective and scientifically rigorous procedures and services. These include ecosystem assessments, support for the implementation of environmental agreements, global and regional biodiversity information, research on threats and impacts, and the development of future scenarios.
PREPARED FOR
The European Commission, Brussels, Belgium Directorate General Environment
ENV E.2 – Environmental Agreements & Trade Under contract number:
070307/2008/497817/SER/E2
CITATION
UNEP-WCMC (2011). Wildlife Trade 2008: An analysis of the European Union and candidate countries’ annual reports to CITES. UNEP-WCMC, Cambridge.
DISCLAIMER
The contents of this report do not necessarily reflect the views or policies of UNEP or contributory organisations. The designations employed and the presentations do not imply the expressions of any opinion whatsoever on the part of UNEP, the European Commission or contributory organisations concerning the legal status of any country, territory, city or area or its authority, or concerning the delimitation of its frontiers or boundaries.
FRONT COVER PHOTOGRAPHS
Marmoset Callithrix jacchus © Manfred Werner
Ariocarpus fissuratus © Michael Wolf
Apollo Parnassius apollo © Robert Kindermann Afghan Tortoise Testudo horsfieldii © Norbert Kaiser
Table of Contents
Executive Summary ...iii
1. Introduction ... 1
2. Data included ... 1
3. Species showing noteworthy patterns of trade ... 3
3.1 Criteria used to select species ... 3
3.2 Species accounts ... 5
3.2.1. Mammals ... 5
3.2.2 Birds ... 14
3.2.3 Reptiles ... 15
3.2.4 Amphibians ... 24
3.2.5 Fish ... 25
3.2.6 Invertebrates (excluding corals) ... 28
3.2.7 Corals ... 30
3.2.8 Plants (excluding trees) ... 36
3.2.9 Trees ... 39
3.3 Candidate countries ... 42
4. Analysis of imports in selected groups ... 46
4.1 Mammals - Hunting trophies ... 46
4.2 Corals ... 50
4.3 Cacti ... 53
4.4 Orchids ... 54
4.5 Trees ... 56
5. Changing patterns in trade ... 59
5.1. Invertebrate taxa (excluding corals) in trade... 59
5.2. Trade patterns in non-coral invertebrates ... 62
5.2.1 Arthropods ... 62
5.2.2. Annelids ... 65
5.2.3. Molluscs ... 66
6. Exports and re-exports ... 72
6.1 Export of wild-collected species... 72
6.2 High volume exports and re-exports ... 75
7. Trade in non-CITES species ... 84
7.1 Annex A species ... 84
7.2 Annex B species ... 84
7.3 Annex D species ... 85
Annex – Purpose and source codes ... 91
Glossary ... ii
Glossary
Annex A/B/C/D species Species listed in the Annexes to the EU Wildlife Trade Regulations
Appendix-I/II/III species Species listed in Appendix I/II/III to CITES Article Refers to article in the CITES Convention text
CITES Convention on International Trade in Endangered Species of Wild Fauna and Flora
CITES-listed Species listed in one of the Appendices to CITES
EU European Union
Member States The 27 countries that were Member States of the European Union in 2008.
Source The source of the species in trade, whether it be from the wild, captive-bred, or Pre-Convention specimens, etc. A full list of sources is provided in Annex 1.
Species For simplicity, the term ―species‖ may be used to refer to a list of species and sub-species
Taxonomy Taxonomy is the practice and science of classification. Species are classified according to formal taxonomic ranks: Kingdom, Phylum, Class, Order, Family, Genus, and Species. The taxonomy accepted by CITES is
followed in this report, see
www.cites.org/eng/res/all/12/E12-11R15.pdf. Wildlife Trade Regulations European Commission Regulation No. 338/97 and
subsequent updates
Conversion factors
Trade is reported using a variety of terms and units. In some instances these terms or units were converted to facilitate analysis. The relevant terms and units are listed below.
General
Converted from: Converted to:
Grams; milligrams Kilograms (kg) or Tonnes [1 tonne = 1,000kg]
Millilitres Litres (l)
Items Whole values
Pairs Whole values [1 pair = 2 items]
Sides Whole skins [2 sides = 1 skin]
Elephant tusks Whole values (1.88 tusks = one elephant) Coral
Mean mass of pieces of coral were calculated following Green and Shirley (1999)1:
Live coral 206.1 13.1 g Raw coral 580 121 g Timber
Comparable terms (e.g., logs, sawn wood and timber) were combined.
Trade reported in kilograms was converted to m3 using the mid-point of the range of specific weights
provided in the CITES Identification Manual (Vales et al., 1999)2.
1 E. Green and F. Shirley, 1999. The Global trade in Coral. WCMC Biodiversity Series no. 9
2 Vales, M. A., Clemente, M. & García Esteban, L. (1999) Timber identification. In CITES Identification Manual: Flora. CITES
Executive Summary
This report provides a detailed analysis of the information submitted by the 27 Member States of the European Union3 (‗EU‘) and three candidatecountries in their 2008 Annual Reports to the Convention on International Trade in Endangered Species of Wild Fauna and Flora (―CITES‖), describing their trade in species listed in the Appendices to CITES and the Annexes4 to the EU
Wildlife Trade Regulations.
The three candidate countries were Croatia, the Former Yugoslav Republic of Macedonia and Turkey.
Import and export data from CITES Parties outside the European Union were also included in the analysis when trade was with EU Member States or candidate countries.
Historic CITES trade data for the preceding five or, in some cases, ten years were also analysed to provide a context for 2008 trade figures.
Trade Analyses
i. Noteworthy patterns of trade
EU imports of wild and ranched animals and plants in 2008 were analysed to identify species with noteworthy patterns of trade (Chapter 3) according to five criteria:
High volume of imports in 2008;
High volume of imports for globally threatened species in 2008;
Sharp increase in imports in 2008;
Longer-term increases or decreases in imports; Longer-term variability in imports
In total, nine Annex A, eighty Annex B and one Annex C taxa were selected on the basis of high volume of trade, sharp increase and/or changing trends in trade. These taxa are presented as follows -- mammals, birds, reptiles, amphibians, fish, invertebrates, and plants.
3 Hereafter referred to as the ‗EU‘ or ‗EU Member States‘. 4 Throughout this report ―Annex‖ refers to the Annexes of the EU Wildlife Trade Regulations. Species listed in Annex A, B, and C are roughly equivalent to those listed in CITES Appendix I, II, and III, respectively although there are some differences. The EU Regulations include a fourth list, Annex D, for which there is no CITES equivalent. Species are listed in Annex D if they are imported to the EU in such numbers as to warrant monitoring.
ii. Trade in particular groups
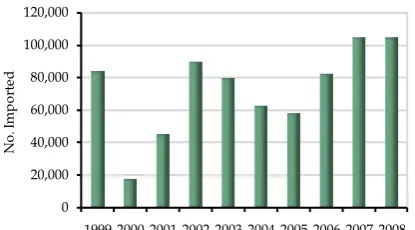
In-depth analyses are provided for groups of particular interest: mammal hunting trophies, corals, cacti, orchids, and trees (Chapter 4). The overall quantity of coral imported by the EU, which had been steadily increasing since 1999, appears to have decreased slightly in 2008, primarily due to a decrease in the import of live corals. Imports of wild-sourced timber, cacti and hunting trophies also showed a decrease compared with 2007 levels, whereas trade in wild-collected orchids increased in 2008.
iii. Changing patterns in trade
Chapter 5 explores the changing source for the trade in invertebrates (other than coral) over the ten-year period 1999-2008. A change in the source of specimens imported was detected for some invertebrates that were subject to EU trade restrictions. This was particularly the case for Giant Clams (family Tridacnidae), for example, which saw a shift in imports from wild-sourced individuals to captive-born or bred, shifts in the species imported to the EU, and apparent changes in the countries of export.
iv. Exports
High volume (re-)exports and exports of wild-collected species native to the EU and candidate countries are discussed in Chapter 6. EU exports and re-exports of 14 mammal, 13 bird, 21 reptile, six fish, five invertebrate and 19 plant taxa exceeded 1,000 units in 2008. Exports of wild-collected species originating in the EU (i.e. native species) were reported for seven Annex A mammals, five Annex A birds, three Annex A reptiles, two Annex B fish, and three Annex B plant species.
v. Trade in non-CITES species
vi. Candidate countries
Candidate countries were not major importers of CITES-listed species in 2008. Eleven species imported by candidate countries met the criteria for high volume of trade or sharp increase in trade in 2008: African Elephant, South American Grey Fox,
1. Introduction
This analysis provides a detailed discussion of the information submitted by the 27 Member States of the European Union (EU) and three candidate countries in their 2008 annual reports to the Convention on International Trade in Endangered Species of Wild Fauna and Flora (―CITES‖). The report describes their trade in species listed in the Appendices to CITES and the Annexes of the Wildlife Trade Regulations, which enforce CITES in the EU.
During 2008, the relevant Wildlife Trade Regulations were Council Regulation (EU) No. 338/1997, Annexes Regulations 1332/2005 and 318/2008, and Implementing Regulation 865/2006 amended by Regulation 100/2008. The three candidate countries included in this analysis were Croatia, the Former Yugoslav Republic of Macedonia, and Turkey.
EU Member States and candidate countries © European Commission
2. Data included
2.1 Data included
The 2008 data used for the analysis were taken from the CITES Trade Database at the end of February 2010, following the submission of CITES annual reports by Member States and their key trading partners.
For trade reported using terms or units that did not equate directly to numbers of individuals (e.g. tusks, plates or sides of skins), an estimate was made of the individuals involved, using where possible, appropriate conversion factors (see page ii).
For timber species, transactions reported in kilograms were converted to cubic meters (m3)
using the mid-point of the range of specific weights provided in the CITES Identification Manual.
Scientific specimens, which often refer to blood, hair, tissue, feathers, etc., and other terms that could not easily be related to numbers of individuals, were not used to identify highly traded species, but some discussion of the volume of scientific specimens imported is included if a species was selected for further review based on other terms imported.
Trade data excluded from the analysis were: Artificially propagated Appendix-II species Re-exports of manufactured articles
2.2 Annual Reports
The Wildlife Trade Regulations state that Member States should compile their annual reports to CITES ‘in accordance with the guidelines for the preparation and submission of CITES annual reports issued by the Secretariat of the Convention‘. All Member States followed these guidelines, with the occasional exception of the use of accepted taxon names and recommended term and unit combinations.
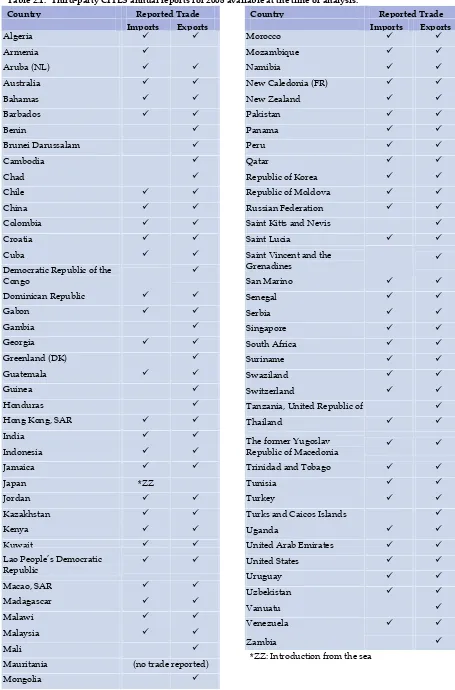
2.3 Third-party data included in
the analysis
Table 2.1. Third-party CITES annual reports for 2008 available at the time of analysis.
Country Reported Trade
Imports Exports
Algeria
Armenia
Aruba (NL)
Australia
Bahamas
Barbados
Benin
Brunei Darussalam
Cambodia
Chad
Chile
China
Colombia
Croatia
Cuba
Democratic Republic of the Congo
Dominican Republic
Gabon
Gambia
Georgia
Greenland (DK)
Guatemala
Guinea
Honduras
Hong Kong, SAR
India
Indonesia
Jamaica
Japan *ZZ
Jordan
Kazakhstan
Kenya
Kuwait
Lao People‘s Democratic
Republic
Macao, SAR Madagascar
Madagascar
Malawi
Malawi
Malaysia
Mali
Mauritania (no trade reported)
Mongolia
Country Reported Trade
Imports Exports
Morocco
Mozambique
Namibia
New Caledonia (FR)
New Zealand
Pakistan
Panama
Peru
Qatar
Republic of Korea
Republic of Moldova
Russian Federation
Saint Kitts and Nevis
Saint Lucia
Saint Vincent and the
Grenadines
San Marino
Senegal
Serbia
Singapore
South Africa
Suriname
Swaziland
Switzerland
Tanzania, United Republic of
Thailand
The former Yugoslav
Republic of Macedonia
Trinidad and Tobago
Tunisia
Turkey
Turks and Caicos Islands
Uganda
United Arab Emirates
United States
Uruguay
Uzbekistan
Vanuatu
Venezuela
Zambia
3. Species showing noteworthy
patterns of trade
3.1 Criteria used to select species
Imports to the EU and candidate countries that showed noteworthy trade patterns are discussed in this section. Imports were identified as noteworthy according to five criteria designed to identify:1. High volume trade in 2008
2. Globally threatened and near threatened species traded at relatively high volumes in 2008
3. Sharp increase in trade in 2008
4. General long term increases or decreases in trade between 1999 and 2008
5. Long term variability in trade between 1999 and 2008
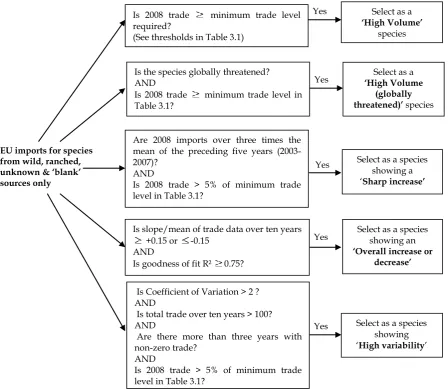
Species were selected on the basis of imports from wild, ranched, ‗unknown‘ and unreported sources. An outline of the selection process is provided in Figure 3.1. The thresholds used to identify high volume trade are provided in Table 3.1; species traded at levels exceeding these thresholds in 2008 qualified for the high volume trade criterion. Species were considered ‗globally threatened‘ or ‗near threatened‘ if they were listed as Critically Endangered (‗CR‘), Endangered (‗EN‘), Vulnerable (‗VU‘) or Near Threatened (‗NT‘) in the IUCN Red List. The 2010 IUCN Red List was accessed online in March 2010.4
Table 3.1. Minimum number of wild, unknown and ranched individuals imported in 2008 needed to qualify for selection on the basis of high trade volume.
Taxonomic group CITES Appendix
I II
(CR, EN, VU, NT*)
II III
(CR, EN, VU, NT*)
III
Mammals 50 50 5,000 5,000 25,000
Birds 50 50 5,000 5,000 25,000
Reptiles 50 50 25,000 25,000 50,000
Amphibians 50 50 25,000 25,000 —
Fish 50 50 25,000 25,000 —
Invertebrates (non-corals) 250 250 25,000 25,000 50,000
Corals — 10,000 25,000 25,000 50,000
Plants (non-timber) 250 250 25,000 25,000 50,000
Plants (timber) 250 m³ 250 m³ 500 m³ 500 m³ 2,500 m³
*CR = Critically Endangered, EN = Endangered, VU = Vulnerable, NT = ‗Near Threatened‘ in IUCN Red List
Overview of Species Selected
The sections that follow are divided according to the following groups: mammals, birds, reptiles, amphibians, fish, invertebrates (non-corals and corals) and plants (non-trees and trees).5A table of
animals and plants selected is presented at the beginning of each section. Species accounts are presented in the order in which the species appears in the Annexes of the EU Regulations.
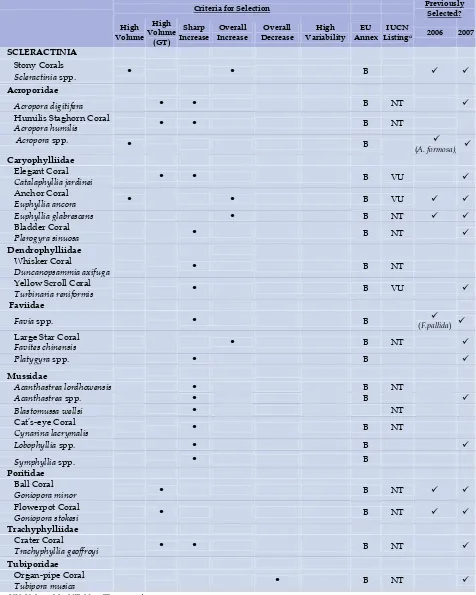
In total, 18 mammal, four bird, 18 reptile, one amphibian, nine fish, three invertebrate (other than corals), 23 coral, and 13 plants (including five tree
5 www.iucnredlist.org
taxa) were selected on the basis of high volume of trade, sharp increase and changing trends in trade. All species were selected on the basis of import data reported by EU Member States or candidate countries, as appropriate. Data relating to trade within the EU, where reported, have been excluded from this analysis.
Yes The CITES Appendix, EU Annex and IUCN Red
List status for each taxon are also included.
Unless otherwise specified in the text, trade volumes relate to importer-reported quantities as reported by the EU Member States.
Figure 3.1. Diagram showing the criteria for selection of species for inclusion in Chapter 3.
EU imports for species from wild, ranched, unknown & ‘blank’ sources only
Scientific Review Group Decisions
Where appropriate, decisions of the Scientific Review Group, a group comprising representatives from each of the CITES Scientific Authorities of the EU Member States, are noted. The recommendations for SRG opinions are based on the following general guidelines:
Negative opinion. The species is in trade, or is likely to be in trade, and introduction to the Community from the country of origin at current or anticipated levels of trade is likely to have a harmful effect on the conservation status of the species or the extent of the territory occupied by the species.
Positive opinion. The species is in trade, or is likely to be in trade, and introduction to the Community from the country of origin at current or anticipated levels of trade will not have a harmful effect on the conservation status of the species or the extent of the territory occupied by the species.
Yes Yes Yes Is 2008 trade minimum trade level required?
(See thresholds in Table 3.1)
Is slope/mean of trade data over ten years +0.15 or -0.15
AND
Is goodness of fit R² 0.75?
Select as a species showing an ‘Overall increase or
decrease’
Is Coefficient of Variation > 2 ? AND
Is total trade over ten years > 100? AND
Are there more than three years with non-zero trade?
AND
Is 2008 trade > 5% of minimum trade level in Table 3.1?
[image:10.595.72.521.132.522.2]Are 2008 imports over three times the mean of the preceding five years (2003-2007)?
AND
Is 2008 trade > 5% of minimum trade level in Table 3.1?
Select as a species showing a ‗Sharp increase’
Yes Select as a species showing ‗High variability‘
Select as a ‘High Volume
(globally threatened)’ species Is the species globally threatened?
AND
Is 2008 trade minimum trade level in Table 3.1?
Select as a ‘High Volume’
3.2 Species accounts
3.2.1. Mammals
Eighteen species of mammal were selected for review and are discussed in this section: six Annex A species and thirteen Annex B species (African Elephant met the criteria for both Annex A
and B populations). Five of these (Hippopotamus, Cheetah, African Lion, Polar Bear and Slow Loris) are globally threatened and five are ‗Near Threatened‘ (Table 3.2.).
Table 3.2. Summary of mammal species showing noteworthy patterns of trade. ‘’ indicates that the criteria was met by candidate countries.
Criteria for Selection Previously
Selected? High
Volume
High Volume (GT)
Sharp Increase
Overall Increase
Overall Decrease
High Variability
EU Annex
IUCN
Listingα 2006 2007
Hippopotamidae
Hippopotamus
Hippopotamus amphibius B VU
Tayassuidae
Collared Peccary
Pecari tajacu B LC
White-lipped Peccary
Tayassu pecari B NT
Canidae
South American Grey Fox
Lycalopex griseus , B LC
Pampas Fox
Lycalopex gymnocercus , B LC
Felidae
Cheetah
Acinonyx jubatus A VU
Canada Lynx
Lynx canadensis B LC
Bobcat
Lynx rufus B LC
African lion
Panthera leo A/B* VU
Leopard
Panthera pardus A NT
Mustelidae
North American Otter
Lontra canadensis , B LC
Otariidae
Cape Fur Seal
Arctocephalus pusillus B LC
Ursidae
Brown Bear
Ursus arctos A LC
Polar Bear
Ursus maritimus B VU
Monodontidae
Narwhal
Monodon monoceros A NT
Manidae
Three-cusped Pangolin
Manis tricuspis B NT
Lorisidae
Slow Loris
Nycticebus coucang A VU
Elephantidae
African Elephant
Loxodonta africana , A/B NT
Hippopotamus
(Hippopotamus amphibius)
Criteria met: high volume (globally threatened) Principal trade term to EU: teeth & trophies Percentage of global trade to EU: 23% of trophies
(including skins and skulls), 64% of teeth Principal source: wild
Top trading partner: United Republic of Tanzania, Zimbabwe, Hong Kong, Special Administrative Region6, Zambia
CITES Appendix: II EU Annex: B
IUCN Red List status: Vulnerable
Imports of Hippopotamus were primarily wild-sourced trophies and teeth in 2008. In total, approximately 295 wild individuals were imported into the EU in the form of trophies (135), skins (25), skulls (15), feet (7), tails (4), tusks (12) and teeth (1301 teeth, equivalent to approximately 108 individuals when the conversion factor of 12 teeth to one hippopotamus is applied). Other wild-sourced items imported cannot easily be equated to individuals, and included 26 skin pieces skins and six small leather products. Imports were mainly reported as either a hunting trophy or for commercial trade.
The number of individuals imported in 2008 was 5% higher than the number imported in 2007 and 32% less than the nine-year average between 1999 and 2007 (Figure 3.2).
0 100 200 300 400 500 600 700
1999 2000 2001 2002 2003 2004 2005 2006 2007 2008
N
o.
im
p
or
te
d
Figure 3.2. EU-reported imports of wild-sourced Hippopotamus hunting trophies, 1999-2008.
Eighteen EU countries imported Hippopotamus parts and derivatives in 2008. The top exporters of wild-sourced items were the United Republic of Tanzania (hereafter referred to as Tanzania), Zimbabwe and Zambia. Trophies, skins and teeth also originated in Cameroon, Ethiopia, Guinea, Mozambique, and Namibia. The SRG confirmed a positive opinion for Tanzania on 29/2/2008 and for Zimbabwe on 29/10/2001, and formed a positive opinion for Zambia on 18/7/2001.
6 Hereafter referred to as Hong Kong, SAR.
Hippopotamus © Patrick Gijsbers
Collared Peccary
(Pecari tajacu)
Criteria met: high volume Principal trade term to EU: skins
Percentage of global trade to EU: 93% of skins Principal source: wild
Top trading partner: Peru
CITES Appendix: II (except populations of Mexico and the United States which are not included in the CITES Appendices)
EU Annex: B
IUCN Red List status: Least Concern
In 2008, all EU imports of Collared Peccary were from wild sources, predominantly for commercial trade. Imports to the EU in 2008 consisted of direct exports from Peru (41,128 skins, 3234 garments and 2,974 small leather products), the Plurinational State of Bolivia (hereafter referred to as Bolivia) (5,700 skins) and Argentina (five trophies and two skulls). Seven EU Member States reported imports in 2008. The quantity of wild-sourced skins imported in 2008 (46,828) was greater than that imported in 2007 (42,749 skins), but 3% lower than the average for the nine year period 1999-2007 (Figure 3.3).
The SRG formed a positive opinion for all countries on 22/07/1997.
0 10,000 20,000 30,000 40,000 50,000 60,000 70,000
1999 2000 2001 2002 2003 2004 2005 2006 2007 2008
N
o.
im
p
or
te
d
White-lipped Peccary
(Tayassu pecari)
Criteria met: high volume (globally threatened) Principal trade term to EU: skins
Percentage of global trade to EU: 99% of skins Principal source: wild
Top trading partner: Peru CITES Appendix: II EU Annex: B
IUCN Red List status: Near Threatened
All EU imports of White-lipped Peccary during 2008 were wild-sourced skins exported directly from Peru for commercial purposes. In total, 11,281 skins and 1,844 garments were imported by three EU Member States. The volume of wild-sourced skins imported in 2008 (11,281) was slightly less than that imported in 2007 (11,317 skins), and 22% lower than the average for the nine year period 1999-2007 (Figure 3.4). The SRG formed a positive opinion for all countries on 22/07/1997, and reconfirmed the positive opinion for Peru on 16/02/2010.
0 5,000 10,000 15,000 20,000 25,000 30,000
1999 2000 2001 2002 2003 2004 2005 2006 2007 2008
N
o.
im
p
or
te
d
Figure 3.4. EU-reported imports of wild-sourced White-lipped Peccary skins, 1999-2008.
South American Grey Fox
(Lycalopex griseus) Criteria met: high volume Principal trade term: skins
Percentage of global trade: 20% of skins Principal source: wild
Top trading partner: Argentina CITES Appendix: II
EU Annex: B
IUCN Red List status: Least Concern
All EU imports of South American Grey Fox in 2008 were wild-sourced skins or skin derivatives. Imports included 38,740 skins, 114 plates, 23 kg of skin pieces, 17 garments and 11 small leather products. All imports originated in Argentina, with 1,100 skins re-exported via Turkey. Eight EU Member States reported the import of skins or skin derivatives. The SRG formed a positive opinion for the species from Argentina on 02/12/2008.
South American Grey Fox © Gaston Cassus The quantity of wild-sourced skins imported by the EU in 2008 (38,740 skins) was less than half the quantity imported in 2007 (80,000 skins), and 33% lower than the average for the nine-year period 1999-2007 (Figure 3.5).
0 20,000 40,000 60,000 80,000 100,000 120,000 140,000
1999 2000 2001 2002 2003 2004 2005 2006 2007 2008
N
o.
im
p
or
te
d
Figure 3.5. EU-reported imports of wild-sourced South American Grey Fox skins, 1999-2008.
Pampas Fox
(Lycalopex gymnocercus) Criteria met: high volume Principal trade term to EU: skins
Percentage of global trade to EU: 23% of skins Principal source: wild
Top trading partner: Argentina CITES Appendix: II
EU Annex: B
IUCN Red List status: Least Concern
Cheetah
(Acinonyx jubatus)
Criteria met: high volume (globally threatened), overall increase
Principal trade term to EU: trophies
Percentage of global trade to EU: 77% of trophies (including ‗skins‘ and ‗skulls‘)
Principal source: wild Top trading partner: Namibia CITES Appendix: I
EU Annex: A
IUCN Red List status: Vulnerable
EU imports of wild-sourced Cheetah in 2008 consisted of 154 trophies, six skins, one skull and 0.5 kg of hair. This equates to approximately 161 wild-sourced hunting trophies, which is a 66% increase on the 97 hunting trophies imported in 2007 (Figure 3.6).
0 20 40 60 80 100 120 140 160 180
1999 2000 2001 2002 2003 2004 2005 2006 2007 2008
N
o.
Im
p
or
te
d
trophies skins skulls
Figure 3.6. EU-reported imports of wild-sourced Cheetah hunting trophies (trophies, skins and skulls), 1999-2008.
Three trophies originated in Zimbabwe and the remaining trophies, skins and skulls originated in Namibia. Twenty EU Member States reported the import of at least one Cheetah hunting trophy. A total of 1,500 scientific specimens from wild-sourced cheetahs were also imported from Namibia in 2008. In addition, 22 live cheetahswere imported for the purposes of breeding or zoos; all were captive-born or captive-bred in either South Africa, the United Arab Emirates or the EU.
Canada Lynx
(Lynx canadensis)
Criteria met: high volume Principal trade term to EU: skins
Percentage of global trade to EU: 45% of skins Principal source: wild
Top trading partners: Canada, United States CITES Appendix: II
EU Annex: B
IUCN Red List status: Least Concern
EU-reported imports of Canada Lynx consisted entirely of wild-sourced items, primarily skins in 2008. In total, 6,248 skins and two skin pieces, six skulls, eight trophies, three bodies and one plate were imported. In addition, the confiscation/seizure of 34 garments from the
Russian Federation was reported by one Member State. The majority of the trade was imported for commercial purposes.
Imports primarily originated in Canada, although 38% of skins, 12% of trophies and all skin pieces originated in the United States of America (hereafter referred to as the United States). Eleven EU Member States reported imports of this species in 2008.
The total quantity of skins imported in 2008 (6,248) was 25% lower than the quantity imported in 2007 (8,381 skins) and 8% lower than the average for the nine-year period 1999-2007. The SRG reconfirmed positive opinions for this species for both Canada and the United States on 27/3/2007.
Bobcat © Don DeBold
Bobcat
(Lynx rufus)
Criteria met: high volume, overall increase Principal trade term to EU: skins
Percentage of global trade to EU: 47% of skins Principal source: wild
Top trading partners: United States, Canada CITES Appendix: II
EU Annex: B
IUCN Red List status: Least Concern
All Bobcat imports in 2008 were wild-sourced and the vast majority comprised skins. In total, 39,410 skins, six garments, four skulls and two trophies were imported by the EU. In addition, 22 garments from the Russian Federation were reported confiscated/seized by one Member State. Approximately 87% (34,121) of the skins originated in the United States, although 31% of these were re-exported via Canada, Hong Kong, SAR and San Marino. The remaining 13% of skins originated in Canada. Nine EU Member States reported the import of Bobcat in 2008. The SRG reconfirmed positive opinions for Bobcat for both Canada and the United States on 27/3/2007.
0 5,000 10,000 15,000 20,000 25,000 30,000 35,000 40,000 45,000
1999 2000 2001 2002 2003 2004 2005 2006 2007 2008
N
o.
im
p
or
te
d
Figure 3.7. EU-reported imports of wild-sourced Bobcat skins, 1999-2008.
African Lion
(Panthera leo)
Criteria met: high volume (globally threatened) Principal trade term to EU: trophies
Percentage of global trade to EU: 25% of trophies (includes skins and skulls)
Principal source: captive-bred, wild
Top trading partners: South Africa, Tanzania CITES Appendix: I/II*
EU Annex: A/B*
IUCN Red List status: Vulnerable
*Appendix I and Annex A applies to P. leo persica
only
In 2008, EU imports of wild-taken African Lion from Annex B populations consisted mainly of captive-bred and wild-sourced hunting trophies and trophy parts (captive bred: 90 trophies, nine bodies, four skins, two bones, two skulls, wild-sourced: 76 trophies, eight skulls, six skins, four bodies), as well as 22 live animals (21 captive-bred, one source unknown), five claws, two bones, 1 kg of hair, 0.2 kg of specimens and 0.004 litres of specimens. The confiscation/seizure of one skin from South Africa was also reported by one Member State. EU-reported imports represented approximately 93 lions, slightly less than the 98 lions imported in 2007 (Figure 3.8).
0 50 100 150 200 250 300 350 400
1999 2000 2001 2002 2003 2004 2005 2006 2007 2008
N
o.
im
p
or
te
d
Figure 3.8. EU-reported imports of wild-sourced African Lion hunting trophies, 1999-2008.
Nineteen EU Member States imported wild-sourced trophies and skins in 2008. Six EU Member States reported the import of captive-bred live lions. African Lion hunting trophies and trophy parts mainly originated in South Africa (115 trophies, 12
bodies, nine skulls and six skins), Tanzania (25 trophies) and Zambia (11 trophies). Smaller quantities of wild-sourced African Lion products also originated in Benin, Botswana, Central African Republic, Chad, Kenya, Mozambique, Namibia and Zimbabwe. The live animals were exported from Algeria (eight), South Africa (eight), Ukraine (four), Switzerland (one) and Turkey (one).
Leopard © Steve Garvie
Leopard
(Panthera pardus)
Criteria met: high volume (globally threatened), overall decrease
Principal trade term to EU: trophies, bones Percentage of global trade to EU: 38% of trophies
(including skins & skulls) Principal source: wild
Top trading partners: Tanzania, Namibia, Zimbabwe
CITES Appendix: I EU Annex: A
IUCN Red List status: Near Threatened
Leopard was selected due to the high volume of trade in 2008. It also met the ‗overall decrease‘ criterion for skins and skulls (which may be indicative of improved reporting practises for imports of hunting trophies by Member States), whilst imports of hunting trophies (combined terms) have actually increased over the last three years (Figure 3.9).
0 100 200 300 400 500 600
1999 2000 2001 2002 2003 2004 2005 2006 2007 2008
N
o.
Im
p
or
te
d
trophies skins skulls bodies
Figure 3.9. EU-reported imports of wild-sourced Leopard hunting trophies (all terms), 1999-2008.
imported. This equates to approximately 408 hunting trophies, a 19% increase on the 343 trophies imported in 2006. Twenty-two EU Member States reported importing at least one wild-sourced trophy in 2008.
The majority of the trophies imported originated in Tanzania (152 trophies), Namibia (94 trophies), and Zimbabwe (49 trophies). Trophies originating in the Central African Republic, Mozambique, South Africa, Zambia, and Botswana were also imported. In addition to the trophies, wild-sourced Leopard derivatives consisting of 257 bones, 44 specimens and 0.5 kg of hair were imported for scientific purposes and four live, captive-bred Leopards were also imported for zoos.
North American Otter
(Lontra canadensis)
Criteria met: high volume, sharp increase Principal trade term to EU: skins
Percentage of global trade to EU: 33% of skins Principal source: wild
Top trading partner: Canada CITES Appendix: II
EU Annex: B
IUCN Red List status: Least Concern
All EU imports of North American Otter in 2008 were wild-sourced (predominantly imported for commercial purposes), with trade comprising 13,555 skins, 30 tails, four skin pieces and one garment. The majority of skins originated in Canada (9,093 skins); the remainder originated in the United States and were imported predominantly via Canada.
Eight EU Member States reported imports of this species in 2008.
The quantity of wild-sourced otter skins imported by the EU increased over the five year period 2004-2008; with imports in 2008 almost five times greater than the quantity imported in 2007 (Figure 3.10). The SRG formed a positive opinion for this species from all countries on 2/9/1997 and reconfirmed the positive opinion for Canada on 16/2/2010.
0 2,000 4,000 6,000 8,000 10,000 12,000 14,000 16,000
1999 2000 2001 2002 2003 2004 2005 2006 2007 2008
N
o.
im
p
or
te
d
Figure 3.10. EU-reported imports of wild-sourced North American Otter skins, 1999-2008.
Brown Bear
(Ursus arctos)
Criteria met: overall decrease Principal trade term to EU: trophies
Percentage of global trade to EU: 62% of trophies (including skins & skulls)
Principal source: wild
Top trading partner: Russian Federation CITES Appendix: I/II (Appendix I applied to the
populations of Bhutan, China, Mongolia and Mexico only)
EU Annex: A
IUCN Red List status: Least Concern
Brown Bear met the ‗overall decrease‘ criterion on the basis of a decline in imports of wild-sourced skins and skulls over the ten year period 1999-2008, but imports reported as ‗trophies‘ have shown an overall, if variable, increase over the same period (Figure 3.11). This may be indicative of improved reporting practises for imports of hunting trophies by Member States rather than an actual change in the type of commodities being imported.
0 50 100 150 200 250 300 350 400 450
1999 2000 2001 2002 2003 2004 2005 2006 2007 2008
N
o.
Im
p
or
te
d
skins skulls trophies
Figure 3.11. EU-reported imports of wild-sourced Brown Bear hunting trophies (skins, skulls, trophies), 1999-2008.
EU imports in 2008 were predominantly wild-sourced, consisting of 285 trophies, 19 skins, nine claws, eight skulls, three live, two ears and one body. This indicates that approximately 313 wild-sourced hunting trophies were imported in 2008. In addition, 18 live, captive-bred specimens were imported for the purpose of zoos (two individuals) or circuses and travelling exhibitions (16 individuals). Nineteen Member States reported Brown Bear imports.
Wild-sourced imports mainly originated in the Russian Federation (85% of trophies and skins, 50% of skulls); the remaining imports originated in the United States, Canada, Croatia, Norway and Bosnia and Herzegovina.
The negative opinion for the Caucasian population was reconfirmed on 18/5/2010.
Polar Bear © Alan D. Wilson
Polar Bear
(Ursus maritimus)
Criteria met: high volume (globally threatened) Principal trade term to EU: bones, skins Percentage of global trade to EU: 99% of bones,
48% of skins Principal source: wild Top trading partner: Canada CITES Appendix: II
EU Annex: B
IUCN Red List status: Vulnerable
EU imports in 2008 were predominantly wild-sourced, consisting of 277 bones, 47 skins, 19 skulls, 18 claws, 17 trophies, ten carvings, three specimens, three skin pieces and one body. This equates to the import of approximately 84 wild-sourced hunting trophies. In addition, two live animals were also imported for the purposes of zoos: one captive-bred animal imported from Serbia and one captive-born animal imported from the Russian Federation. The wild-sourced products mainly originated in Canada (277 bones, 40 skins, 13 skulls, 18 claws, 17 trophies, three skin pieces an one body) or Greenland (10 carvings, seven skins, six skulls and one scientific specimen), with two scientific specimens exported from Iceland.
Fourteen EU Member States reported the import of sourced Polar Bear. EU imports of wild-sourced hunting trophies decreased over the period 2005-2008, with imports in 2008 being the lowest over the ten-year period 1999-2008 (Figure 3.12).
0 20 40 60 80 100 120 140 160 180
1999 2000 2001 2002 2003 2004 2005 2006 2007 2008
N
o.
Im
p
or
te
d
Figure 3.12. EU-reported imports of wild-sourced Polar Bear hunting trophies (including trophies, skins, skulls and bodies), 1999-2008.
The SRG formed a positive opinion for all subpopulations of Polar Bear except those of Baffin Bay and Kane Basin (Canada), for which a negative opinion was formed on 30/11/2009. The negative opinion for the Baffin Bay and Kane Basin subpopulations was reconfirmed on 16/02/2010.
Narwhal
(Monodon monoceros)
Criteria met: high volume (globally threatened) Principal trade terms to EU: tusks, teeth Percentage of global trade to EU: 97% of teeth,
92% of tusks
Principal sources: wild Top trading partners: Canada CITES Appendix: II
EU Annex: A
IUCN Red List status: Near Threatened
All populations of Narwhal are listed in Annex A, however in accordance with EU Regulation 1332/2005 and EU Regulation (EC) No. 318/2008 (applicable from 31 March 2008), all Appendix II Cetacea ―including products and derivatives other than meat products for commercial purposes, taken by the people of Greenland under licence granted by the competent authority concerned‖ are treated as belonging to Annex B. As such, assuming the proper domestic licensing procedures were followed, it can be inferred that the the 250 specimens, 45 tusks and 11 carvings imported by the EU in 2008, which all originated in Greenland, should be considered as originating from Annex B populations. These items were all wild-sourced and were imported for scientific purposes or as household effects.
The remaining trade in wild-sourced Narwhal in 2008 originated in Canada and consisted of 75 tusks, 44.7 kg of tusks, 30 teeth, 2 kg of teeth, three skulls, three trophies and one carving, all of which was wild-sourced. These were imported by eight EU Member States.
The majority of imports from Annex A populations were for personal purposes (with one tusk for educational purposes), however four tusks and two trophies were imported for commercial purposes by one Member State.
0 20 40 60 80 100 120 140 160
2004 2005 2006 2007 2008
N
o.
Im
p
or
te
d
Total Canada Greenland
Figure 3.13. EU-reported imports of wild-sourced Narwhal trophies, tusks and teeth between 2004 and 2008 (excluding those imported for scientific, exhibition or educational purposes).
The SRG formed a negative opinion for Greenland and a positive opinion for Canada on 13/12/2004. The negative opinion for Greenland was reconfirmed on 15/3/2005. Greenland introduced a ban on the export of Narwhal products in 2006; subsequently, the negative opinion was removed on 16/2/2010.
Three-cusped Pangolin
(Manis tricuspis)
Criteria met: High volume (globally threatened), sharp increase
Principal trade term to EU: live
Percentage of global trade to EU: 100% of live Principal source: ranched
Top trading partner: Togo CITES Appendix: II EU Annex: B
IUCN Red List status: Near threatened
EU imports in 2008 consisted of 500 live, ranched pangolins originating in Togo imported for commercial purposes and two wild-sourced trophies from Cameroon imported as personal possessions.
The only other imports of this species by EU Member States 1999-2008 were two live, wild-sourced animals in 2006 for scientific purposes, two pre-Convention bodies in 2002, and six wild-sourced specimens imported in 1999 for biomedical purposes.
Slow Loris
(Nycticebus coucang) Criteria met: Sharp increase Principal trade term to EU: live
Percentage of global trade to EU: 100% of live Principal source: Unknown
Top trading partner: Hong Kong, SAR CITES Appendix: I
EU Annex: A
IUCN Red List status: Vulnerable
Slow Loris met the sharp increase criterion due to the import of six live animals to the EU in 2008, compared with none the previous year, for
breeding purposes. Five of the live animals were imported from Hong Kong, SAR (three source unknown, one source ‗F‘ and one source ‗I‘), and the remaining animal was imported from Singapore (origin and source unknown). One pre-Convention skeleton was also imported in 2008 from Canada, for educational purposes.
Previous trade in this species over the period 1999-2007 consisted of 15 live animals confiscated/seized by one Member State in 2000 (exporter unknown) and the import of two live animals in 2006 for the purpose of breeding (one source ‗I‘, one source unknown). A 4.6(b) import suspension for Slow Loris from Singapore and the Philippines was first formed on 22/12/1997 and was later confirmed on 21/11/1998, although was not included in subsequent updates to the suspensions regulation. The species was transferred from Appendix II to Appendix I on 13/09/07.
African Elephant
(Loxodonta africana)
Both the Appendix I/Annex A population and the Appendix II/Annex B populations of the African Elephant qualified for inclusion in this section. The trade in each population is discussed separately.
African Elephant (Annex A)
Criteria met: high volume (globally threatened), sharp increase
Principal trade terms to EU: trophies, tusks, ivory carvings
Percentage of global trade to EU: 69% of trophies, 30% of tusks (no units), 4% of tusks (kg), 17% of ivory carvings
Principal sources: wild (trophies, tusks), pre-Convention (ivory carvings)
Top trading partners: Tanzania, Cameroon CITES Appendix: I (except for the populations of
Botswana, Namibia, South Africa and
Zimbabwe, which are listed in Appendix II for specific purposes)
EU Annex: A (except for the populations of Botswana, Namibia, South Africa and Zimbabwe, which are listed in Annex B for specific purposes)
IUCN Red List status: Near Threatened
EU-reported imports of African Elephant from Annex A populations during 2008 originated mainly from the wild (predominantly trophies and tusks) or were pre-Convention ivory carvings and products.
Wild-sourced elephant products
tails and 1 kg of hair in 2008. This equates to approximately 239 individuals7, an increase on the
170 elephants reported imported in 2007.
The principal exporters of trophies, tusks and ivory carvings were Tanzania (98 trophies, 14 tusks, 52 ivory carvings), Cameroon (59 trophies, 18 tusks, 18 kg tusks), and Mozambique (21 trophies, 26 tusks, two ivory carvings). All three countries set export quotas for tusks as trophies from a specified number of animals in 2008.
EU imports of Annex A tusks and trophies were both greater in 2008 (76 tusks, 195 trophies) than in the previous year (49 tusks, 139 trophies). Over the period 1999-2008, trade in Annex A tusks has remained relatively constant whilst imports of trophies have been more variable (Figure 3.14).
0 50 100 150 200 250 300
1999 2000 2001 2002 2003 2004 2005 2006 2007 2008
N
o.
Im
p
or
te
d
tusks trophies
Figure 3.14. EU-reported imports of wild-sourced Annex A African Elephant trophies and tusks, 1999-2008.
Pre-Convention
The trade in pre-Convention Annex A elephant products comprised 561 ivory carvings, 181.7 kg of ivory carvings, 15 tusks, 3.5 kg of tusks and four ivory pieces.
Exporters of pre-Convention tusks included the United States, Cameroon, Cote d‘Ivoire, Equatorial Guinea, Bahrain and Sudan. Ivory carvings from pre-Convention sources were exported primarily by the United States and Switzerland, with the country of origin reported as unknown.
Elephant products imported with an ‘unknown’ source
Thirteen ivory carvings and one ivory piece reported with an ‗unknown‘ source were imported in 2008, all of which were exported by the United States with ‗unknown‘ origin. However, it is possible that these items were pre-Convention.
Elephant confiscations/seizures
Four EU Member States reported the confiscation/seizure of 210 ivory carvings, three tusks and one small leather product in 2008. The
7 Parker, I.S.C. and Martin, E.B. (1982). How many
elephants are killed for the ivory trade? Oryx 16(3): 235-239.
majority of carvings originated inAngola (93 carvings) and Mozambique (60 carvings), whilst the tusks originated in Ethiopia (two tusks) and Angola (one tusk).
African Elephant © Wikimedia Commons/Gorgo
African Elephant (Annex B)
Criteria met: high volume (globally threatened) Principal trade terms to EU: tusks, skins Percentage of global trade to EU: 36% of tusks,
4% of skins, <1% of skins (m2)
Principal sources: wild
Top trading partners: Botswana, Zimbabwe, South Africa
CITES Appendix: II (populations of Botswana, Namibia, South Africa and Zimbabwe for specific purposes)
EU Annex: B (populations of Botswana, Namibia, South Africa and Zimbabwe for specific purposes)
IUCN Red List status: Near Threatened
EU-reported imports of Appendix II/Annex B populations of Loxodonta africana (products originating in Botswana, Namibia, South Africa or Zimbabwe which meet specified annotations) during 2008 were mainly from wild sources, with the exception of one pre-Convention trophy and one pre-Convention ivory carving from Canada.
Wild-sourced elephant products
Wild-sourced imports consisted of 307 tusks, 173 skins and 7.127 m2 of skins, 47 skin pieces and
232.38 m2 of skin pieces, 68 feet, 47 trophies, 41
hairs, 35 small leather products, 25 ears, 13 ivory carvings, 13 teeth, 13 tails, nine live elephants, three bones and two skulls. Most parts and derivatives, including all the tusks and trophies, were reported as either personal possessions or hunting trophies. Most of the skins and skin pieces were imported for commercial purposes. All of the live elephants were imported for either breeding purposes (six) or circuses and travelling exhibitions (three).
to be the same animal. On this basis, it is estimated that this trade represented 256 individuals. Skins were not considered in this estimate because, being very thick, they can be split into many pieces and are therefore difficult to equate to individuals. More than three times the number of wild-sourced tusks were imported into the EU in 2008 (303 tusks) compared with 2007 (86 tusks), but the number of trophies imported fell by 73% over the same period (Figure 3.15).
Fourteen EU Member States imported wild-sourced Annex B trophies and tusks.
Wild-sourced Annex B trophies and tusks mainly originated in Botswana (135 tusks and 22 trophies),
Zimbabwe (126 tusks and 22 trophies) and Namibia (36 tusks and two trophies). South Africa was the main (re-)exporter of skins and skin pieces, although 99% of skins originated in Zimbabwe.
0 50 100 150 200 250 300 350
1999 2000 2001 2002 2003 2004 2005 2006 2007 2008
N
o.
im
p
or
te
d
trophies tusks
Figure 3.15. EU-reported imports of wild-sourced Annex B African Elephant trophies and tusks, 1999-2008.
3.2.2 Birds
One Annex A bird species, White-tailed Eagle, met the criteria for inclusion in this section on the basis of sharp increase in trade in 2008 (Table 3.3). African Grey Parrot and Senegal Parrot met the criteria solely on the basis of imports by candidate countries; these species will be discussed in the section on candidate trade at the end of this chapter.
Several other bird species technically met the ‗Overall decrease‘ criteria, but as this decrease in trade was clearly the result of import restrictions in place in the EU due to animal health regulations, declines in imports of bird species into the EU are not considered further.
Table 3.3. Summary of bird species showing noteworthy patterns of trade. ‘’ indicates that the criteria was met by candidate countries.
Criteria for Selection Previously Selected?
High Volume
Sharp Increase
Overall Increase
Overall Decrease
High Variability
EU Annex
IUCN
Listingα 2006 2007
Accipitridae
White-tailed Eagle
Haliaeetus albicilla A LC
Psittacidae
Senegal Parrot
Poicephalus senegalus B LC
African Grey Parrot
Psittacus erithacus B NT
α Timneh African Grey Parrot
Psittacus erithacus timneh B NT*
Key: NT: Near Threatened, LC: Least Concern; α Psittacus erithacus timneh assessed as Psittacus erithacus
White-tailed Eagle
(Haliaeetus albicilla)
Criteria met: sharp increase Principal trade term to EU: live
Percentage of global trade to EU: 95% of live Principal source: wild
Top trading partner: Norway CITES Appendix: I
EU Annex: A
IUCN Red List status: Least Concern
EU imports of White-tailed Eaglein 2008 included 33 live, wild-sourced birds originating in Norway which were imported by the EU for re-introduction
programs. In addition, four live, captive-bred birds originating in Kazakhstan were imported; two for breeding purposes and two for commercial purposes.
3.2.3 Reptiles
One species of Annex A reptile, sixteen Annex B reptile species, and one Annex C reptile species met the criteria for inclusion in this section (Table 3.4).
[image:21.595.42.558.170.743.2]Five species (Loggerhead Turtle, African Spurred Tortoise, Yellow-spotted Sideneck Turtle, Home‘s Hinge-back Tortoise and Afghan Tortoise) are globally threatened.
Table 3.4. Summary of reptile species showing noteworthy patterns of trade. ‘’ indicates that the criteria was met by candidate countries.
Criteria for Selection Previously Selected?
High
Volume Volume (GT) High Increase Sharp Increase Overall Decrease Overall Variability High EU Annex ListingIUCN α 2006 2007
Alligatoridae
American Alligator
Alligator mississippiensis B LC
South American Spectacled Caiman
Caiman crocodilus crocodilus
B ( LC
C. crocodilus) Yacare Caiman
Caiman yacare B LC
Crocodylidae
Nile Crocodile
Crocodylus niloticus
A/B LC
Teiidae
Argentine Black & White Tegu
Tupinambis merianae B
Varanidae
Nile Monitor
Varanus niloticus B
Water Monitor
Varanus salvator B
Colubridae
Oriental Rat Snake
Ptyas mucosus B
Pythonidae
Blood Python
Python brongersmai B
Sumatran Short-tailed Python
Python curtus B
Royal Python
Python regius B
Reticulated Python
Python reticulatus B
Cheloniidae
Loggerhead Turtle
Caretta caretta A EN
Emydidae
False Map Turtle
Graptemys pseudogeographica
C*
(USA)
Pelomedusidae
Yellow-spotted Sideneck Turtle
Podocnemis unifilis B VU
Testudinidae
African Spurred Tortoise
Geochelone sulcata B VU
Home's Hinge-back Tortoise
Kinixys homeana B VU
Afghan Tortoise
Testudo horsfieldii B VU
American Alligator
(Alligator mississippiensis) Criteria met: high volume Principal trade term to EU: skins
Percentage of global trade to EU: 50% of skins Principal sources: wild
Top trading partners: United States CITES Appendix: II
EU Annex: B
IUCN Red List status: Least Concern
American Alligatorimportsinto the EUduring 2008 were primarily whole skins (281,272), with the remaining trade mostly consisting of skin pieces (5,966) and small leather products (2,320). Ninety-nine percent of skins and skin pieces were wild-caught. Seventy-seven live alligators, ten skulls, four garments, two bodies and one trophy were also imported. In addition, the confiscation/seizure of 321 small leather products and six skins were reported.
American Alligator imports were reported by fourteen Member States in 2008. All skins and skin pieces originated in the United States, with 78% of skins imported directly, and the remaining skins and all skin pieces being re-exported via Singapore, Hong-Kong SAR and Switzerland.
Skin imports in 2008 were roughly equivalent to the quantity imported in 2007 (Figure 3.16). The apparent increase in the number of wild-sourced skins and decrease in skins from captive-bred and ranched sources since 2005 is likely to be due to changes in the way the United States reports source codes.
0 50,000 100,000 150,000 200,000 250,000 300,000 350,000 400,000
1999 2000 2001 2002 2003 2004 2005 2006 2007 2008
N
o.
Im
p
or
te
d
C F I R U W
Figure 3.16. EU-reported imports of American Alligator skins by source: captive-bred (C), born in captivity (F), ranched (R), wild (W), seized/confiscated (I) and unknown (U), 1999-2008.
Of the 77 live alligators, 70 originated in the United States (68 of which were imported via Switzerland). The majority of alligators were imported for commercial purposes.
The SRG formed a positive opinion for American Alligator from the United States on 18/07/2001, which was reconfirmed on 14/09/2007.
American Alligator © USFWS
South American Spectacled Caiman
(Caiman crocodilus crocodilus) Criteria met: high volume Principal trade term to EU: skins
Percentage of global trade to EU: 57% of skins Principal source: wild
Top trading partners: Switzerland, Bolivarian Republic of Venezuela
CITES Appendix: II EU Annex: B
IUCN Red List status: Least Concern (C. crocodilus)
EU-reported imports of South American Spectacled Caiman during 2008 mainly consisted of commercial imports of wild-sourced skins (Figure 3.17). In total, 45,015 skins, 826 live caiman and six skin pieces were imported. In addition, the EU also reported the confiscation/seizure of four small leather items from Guyana. Five EU Member States reported wild-sourced imports of this sub-species.
0 10,000 20,000 30,000 40,000 50,000 60,000 70,000 80,000
1999 2000 2001 2002 2003 2004 2005 2006 2007 2008
N
o.
Im
p
or
te
d
Figure 3.17. EU-reported imports of wild-sourced South American Spectacled Caimanskins, 1999-2008.
The majority of skins (99%) originated in the Bolivarian Republic of Venezuela (hereafter referred to as Venezuela), although 61% of skins were imported to the EU indirectly (primarily via Switzerland). A small number of skins also originated in Guyana (452 skins) and Colombia (13 skins).
were imported directly from Guyana, with the remainder directly from Suriname.
The SRG formed positive opinions for Guyana, Suriname and Venezuela on 14/9/2007.
Yacare Caiman
(Caiman yacare)
Criteria met: high volume
Principal trade term to EU: skins, tails Percentage of global trade to EU: 79% of skins,
79% of tails Principal source: wild Top trading partner: Bolivia CITES Appendix: II EU Annex: B
IUCN Red List status: Least Concern
Six EU Member States reported imports of Yacare Caiman during 2008. EU imports consisted of 49,151 skins, 41,448 tails, 1,769.7 kg of skin pieces and 350 skin pieces and 691 small leather products (all primarily wild-sourced) and two live captive-bred caiman.
All of the wild-sourced imports originated in Bolivia, although 18.8 kg of the skin pieces were imported via Panama. EU-reported imports of skins directly from Bolivia accounted for virtually all (98%) of Bolivia‘s 2008 export quota (50000 skins). The ranched and captive-bred skins and small leather products originated in Argentina (154 skins) and Brazil (102 skins, 57 small leather products). The number of wild-sourced skins imported in 2008 (48,895 skins) was 10% greater than that imported in 2007 (44,591 skins), and 30% higher than the average for the nine year period 1999-2007 (Figure 3.18). Imports of wild-sourced tails in 2008 (41,448 tails) were also greater than the number imported in 2007 (28,938) and more than twice the average imported 1999-2007.
0 10,000 20,000 30,000 40,000 50,000 60,000
1999 2000 2001 2002 2003 2004 2005 2006 2007 2008
N
o.
Im
p
or
te
d
skins tails
Figure 3.18. EU-reported imports of wild-sourced Yacare Caimanskins and tails, 1999-2008.
The SRG formed a positive opinion for Bolivia on 23/02/1999, which was reconfirmed on 12/06/2006.
Nile Crocodile
(Crocodylus niloticus)
Criteria met: high variability
Principal trade term to EU: skins, meat Percentage of global trade to EU: 39% of skins,
27% of meat
Principal source: captive-bred, ranched Top trading partner: Zimbabwe, South Africa CITES Appendix: I/II
EU Annex: A/B
IUCN Red List status: Least Concern
EU-reported imports of Appendix II/Annex B Nile Crocodile (populations of Botswana, Ethiopia, Kenya, Madagascar, Malawi, Mozambique, Namibia, South Africa, Uganda, Tanzania [subject to an annual export quota of no more than 1600 wild specimens including hunting trophies, in addition to ranched specimens], Zambia and Zimbabwe) during 2008 consisted of 94,638 skins, 60,735 kg of meat, 17,011 skin pieces, 3,043 skulls, 920 small leather products, 87 trophies, 7 kg of oil, four bodies, one specimen and 0.4 kg of derivatives. Imports were primarily captive-bred or ranched (for example, skins: 87% captive bred, 13% ranched, <1% wild-sourced, meat: 73% captive bred, 27% ranched). One Member State also reported the confiscation/seizure of 24 small leather items (21 from Zimbabwe, three from South Africa).
In addition, the EU also reported the following imports from Appendix I/Annex A Nile Crocodile (all populations except those in Appendix II/Annex B) in 2008: 895 small leather products, 624 skins, 105 live and five specimens. The confiscation/seizure of one skin was also reported.
Nile Crocodile © Hans Hillewaert
Annex B populations: