Laser Anemometry Advances and Applications University of Limerick, Ireland, September 2001
Liquid Velocity Field Measurements during Bubble Formation and Detachment at an Orifice
T. Vidinha, W. Dempster1, M Stickland Mechanical Engineering,
University of Strathclyde, Glasgow
1
Corresponding Author email: [email protected]
keywords: PIV, two phase flow, velocity field, bubble formation
ABSTRACT
This paper discusses the formation of gas bubbles at orifices with the purpose of experimentally investigating the influence of the surrounding liquid velocity field. The liquid velocity field measurements are established using PIV techniques utilising an Argon-ion laser to illuminate the fluorescent seeding. The images are recorded using high-speed digital video and the PIV results are obtained by cross correlation of the acquired images. Optical filters are used in an attempt to remove the glare from the bubble interface. The liquid velocity field was determined for the single bubble regime over a range of gas flowrates and orifice diameters of 2 mm and 6 mm. The investigation revealed a number of phenomena that are important to the growth of the bubble. These include liquid re-circulation due to necking, the extent of the influence of the preceding bubble and appearance of vortex rings generated by interface oscillations.
1. - INTRODUCTION
initially at rest, the bubble is growing in isolation, i.e. under no influence of a previous bubble, the bubble remains attached to the edges of the orifice at all times and detaches when the neck attains zero width. The objective of this work is to question these assumptions by investigating the role of the surrounding liquid. In this study, PIV techniques have been used to investigate the transient liquid velocity field that is produced by a bubble as it forms at an orifice.
2. – EXPERIMENTAL SETUP AND MEASUREMENT TECHNIQUES
2.1 – Experimental Apparatus and Procedure
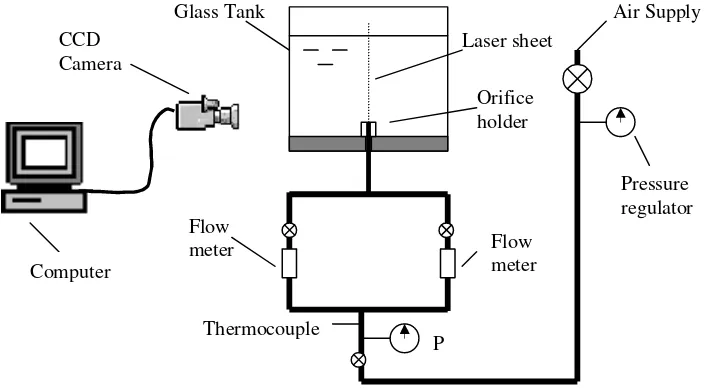
The experimental apparatus for simultaneous visualisation of the interface and liquid flow around an air bubble forming at an orifice is schematically shown in figure 1. The glass tank (145 mm x 145mm x 500 mm) is filled with water (140 mm water height approximately). This tank is supported by a steel box section frame that sits on a plinth for stability purposes. The air is supplied from a compressor system and the supply pressure has been regulated to approximately 1.37 bar (gauge). In order to achieve constant flow conditions, the air is directly fed into the orifice holder. Constant flow conditions are normally maintained by minimising tube volume and ensuring critical flow condition at the control valve. Some tests were conducted at non choked conditions. However, the resistance in the supply ensured that fluctuations in pressure did not influence the flowrate. The flowrate and pressure of the air upstream the orifice is controlled by needle valves. The pressure of the air upstream of the orifice is 0.62 bar (gauge). To measure the mass flow rates there are two rotameters one ranging from 1 to 10 cm3/s and another one ranging from 2 to 20 cm3/s. The pressure and temperature of the air upstream of the orifice is measured by a bourdon gauge and thermocouple respectively. There is one PVC orifice holder with 2 mm diameter hole and a brass orifice holder with 6 mm orifice diameter.
[image:2.595.117.469.426.621.2]Air Supply Glass Tank Laser sheet Orifice holder Pressure regulator P Flow meter Flow meter CCD Camera Computer Thermocouple
Figure 1: Schematic representation of the experimental setup.
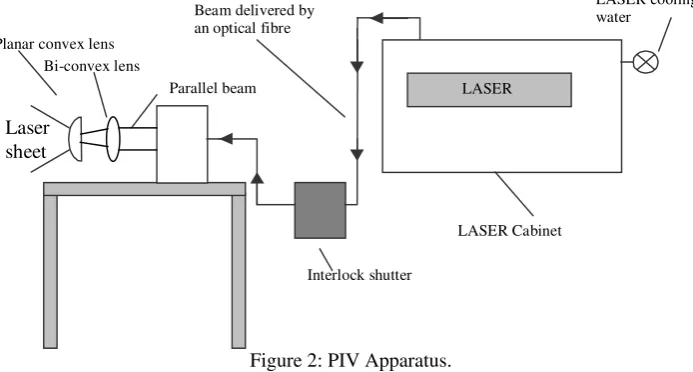
the centre of the bubble. A CCD camera is used to record instantaneous images in the direction perpendicular to the illuminated plane. The laser light does not, however, illuminate the bubble interface. In order to capture the bubble interface, a halogen spot light lamp is used to illuminate the interface and a low pass optical filter optical filter is used to remove the glare from the laser sheet. As the bubble formation time was of the order of 40 ms, the digital images were obtained using an exposure time of 1ms and a recording speed of 500 fps. Before each session a scaling cube (8.02 mm x 6.44 mm x 6.43 mm, accurate to 0.005 mm) is positioned at the centre of the orifice. This image provides scaling for the PIV analysis. The images recorded are downloaded directly to a PC. The PIV analysis is done using a point interrogation technique which cross-correlates two digital image planes. The images are analysed using Optical Flow Systems VidPIV analysis Software by cross correlation on a Pentium P200 PC. Figure 2 shows a schematic representation of the PIV apparatus.
LASER
LASER cooling water
Interlock shutter Beam delivered by
an optical fibre
Parallel beam Bi-convex lens
Planar convex lens
LASER Cabinet Laser
[image:3.595.122.469.224.410.2]sheet
Figure 2: PIV Apparatus.
2.2 - Test Conditions
A number of different gas bubbling conditions are possible depending on the test conditions. Significant amongst these are whether the gas flowrate is constant or pressure controlled and if the flowrate magnitude is sufficient to cause bubble coalescence during the formation period. For the tests presented in this paper, the gas flowrates were at constant flow conditions and produced a single bubble regime. It is, therefore, necessary to point out that the work is limited to a range of low flowrates to remain in the single bubble regime. This is unlike bubbles forming under constant pressure or intermediate conditions (bubbles generated by feeding the air into a chamber below the orifice). As bubbles that are formed under non-constant flow conditions, have an extended formation time, this allows for the preceding bubbles to depart leaving a less significant wake with reduced possibility of coalescence.
For the 2 mm PVC orifice diameter the flowrate range tested was from 0.533 cm3/s to 2.3 cm3/s. For the 6 mm brass orifice diameter the flowrate range was from 2 cm3/s to 6 cm3/s. Air and water were used as the working fluids and were approximately at room temperature (23 oC). Above the flow rates ranges mentioned the bubbles start coalescing, therefore, no data was taken above these values.
2.3 – Problems observed
obtained close to the bubble interface. This problem is more evident at the top of the bubble were the velocities are higher and at high flow rates were the bubble is very close to the preceding bubble.
3. - RESULTS AND DISCUSSION
3. 1 – PIV for typical bubble formation
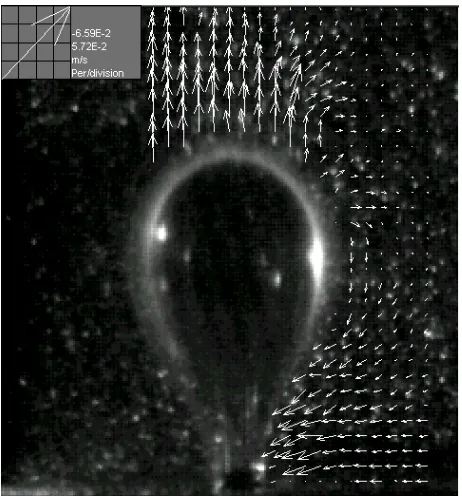
[image:4.595.314.545.201.448.2]Typical results are shown in Figures 3 to 6 which show bubbles and the associated liquid velocity field for a 2 mm orifice and a bubble being formed over a period of 64 ms.
[image:4.595.50.282.203.449.2]Figure 3: Flow field at the initial stage of bubble formation, after 2 ms (at a 2 mm PVC orifice and flowrate 0.53 cm3/s).
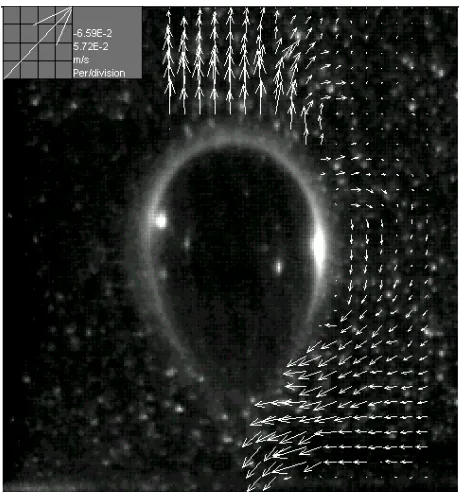
Figure 4: Flow field at the expansion stage of bubble formation, after 30 ms (at a 2 mm PVC orifice and flowrate 0.53 cm3/s).
[image:4.595.50.281.511.759.2]Figure 6: Flow field during detachment stage of bubble formation, after 64 ms (at a 2 mm PVC orifice and flowrate 0.53 cm3/s).
During the initial stage, the bubble expands from a nearly hemispherical shape. At this stage the velocity field is radial and uniform (Figure 3). Thereafter, the bubble assumes an elongated shape (Figure 4). The buoyancy forces start to dominate and the liquid velocities at the top of the bubble become higher than on the sides. In fact, in some cases, the PIV results show that the liquid velocities on the sides of the bubble are nearly zero, as the bubble is simply elongating during this phase. During the later stages of bubble growth, the interface tends to create a necking effect at the region close to orifice attachment. This produces an inward flow which, combined with an expansion of the upper surface of the bubble, induces liquid re-circulation (Figure 5). The bubble will, than, detach when the neck attains zero width (Figure 6). The inward liquid velocity in the neck region is, at this stage, of the same order of magnitude than the liquid velocity at the top of the bubble (approximately 0.13 m/s for the bubble shown in figure 6).
3.2 – Influence of the preceding bubble
Figure 7: Flow field at the expansion stage of bubble formation (at a 2 mm PVC orifice and flowrate 2.3 cm3/s).
Figure 8: Flow field at the initial stage of bubble formation (at a 6 mm brass orifice and flowrate 2.4 cm3/s).
The effect of the preceding bubble is to generate an upflow above the growing bubble. This effect has been previously identified but rarely investigated in practice. It is apparent that this influence becomes prominent at higher flow rates when the flow is being sucked into the preceding bubble. Comparing the PIV results shown in figures 7 and 8 with figures 3 to 6, where the influence of the preceding bubble is negligible, it can be seen that the liquid flow field generated by the preceding bubble affects the shape and growth rate of the growing bubble.
3.3 – Velocity field during necking
[image:6.595.50.280.63.307.2][image:7.595.49.281.62.333.2]
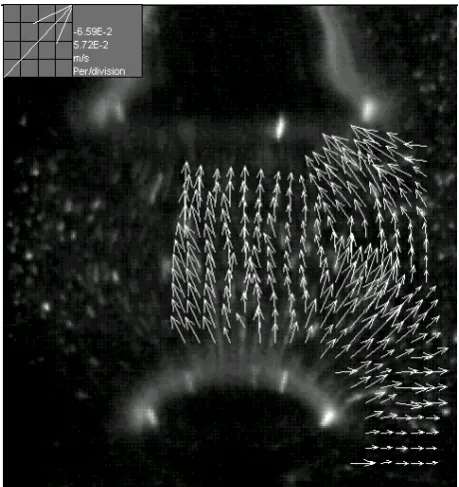
Figure 9: Flow field at the necking stage (at a 6 mm brass orifice and flowrate 2.4 cm3/s).
Figure 10: Flow field at end of the necking stage (at a 6 mm brass orifice and flowrate 5 cm3/s).
It can be observed from these figures that at the start of the necking the upwards velocity is extremely high. Flow re-circulation around the bubble is generated as the bubble forms the upper section contours to translate upwards and expand outwards, while the lower section contracts.
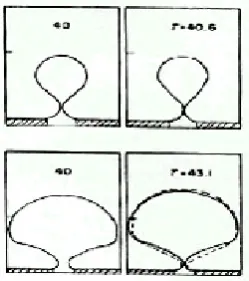
Figure 11: Marmur and Robin (1976) typical sequences of bubble formation.
It can also be inferred from figure 5, 9 and 10, that the bubble does not remain attached to the orifice edges, as the bubble interface at the orifice in much smaller than the orifice itself. This contradicts the assumption, made in most theoretical models (Marmur and Robin (1976), Tan and Harris (1986) and Hooper (1986)), that the interface of the bubble remains attached to the orifice edges. Figure 11 illustrates this assumption.
Although the bubble is attached to the orifice edges during most of its growth, during necking the liquid motion becomes so strong that of the bubble is released from the edges of the orifice. This phenomenon occurred for all the range of conditions and orifice materials tested.
[image:7.595.74.199.442.583.2]3.4 – Vortex rings
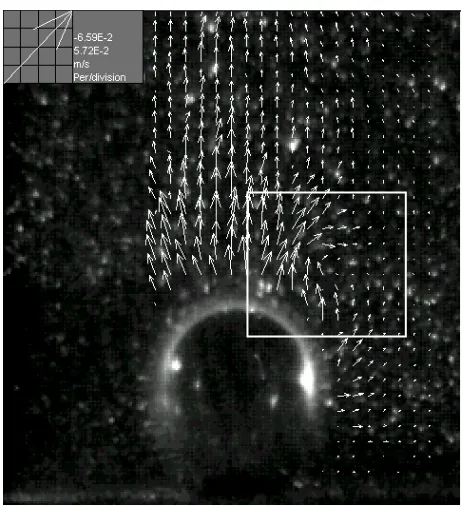
[image:8.595.49.280.168.421.2]An additional phenomenon was observed for low flow rates (i.e. 0.5 to 1 cm3/s for a 2 mm orifice diameter) where the interface was observed to oscillate. This interface oscillation generated a vortex ring, which influenced the liquid flow in the upper regions of the bubble. This phenomenon was encountered after the initial expansion stages and before necking. This is shown in figures 12 and 13.
Figure 12: Vortex ring generated at the top of the bubble (at a 2 mm PVC orifice and flowrate 0.53 cm3/s).
Figure 13: Vortex ring generated at the top of the bubble (at a 2 mm PVC orifice and flowrate 0.53 cm3/s).
[image:8.595.313.545.169.421.2]The streamline profile modelled by Hooper (1986) using potential flow theory gives good agreement with the velocity fields encountered in this study (for flowrates above 2 cm3/s). This streamline profile can be seen in figure 14. Hooper (1986) did not, however, simulate a bubble growing under flowrates of 0.5-1 cm3/s. It is, therefore, unknown if the potential flow analysis would be applicable to extremely low flowrates and, whether it would, or not, simulate the vortex ring that occurs due to the oscillatory movement of the bubble.
[image:8.595.77.495.580.731.2]4. – CONCLUSIONS
The main outcomes of the study indicate that
(i) Preceding bubbles may significantly influence the flow field around the bubble during the whole formation period.
(ii) The change in shape of the bubble interface produces both outward and inward radial contribution leading to re-circulation effects at the bubble surface. This effect being associated with the bubble necking during the later stages of the formation period
(iii) Additional vortex ring phenomena have been identified for low flow conditions where the interface oscillations occur further influencing the surrounding flow field.
(iv) Further work should be carried out in order to obtain a sharper simultaneous view of the bubble interface and seeding particles.
ACKNOWLEDGEMENTS
The authors would like to acknowledge the assistance of Mr Eric Duncan, Laboratory Superintendent, in the experimental set-up.
REFERENCES
DAVIDSON, J. F. and SCHULER, B. O. G. (1960) Bubble formation at an orifice in an inviscid liquid. Trans. Instn. Chem. Eng., 38, 335-342.
HAYES, W. B., HARDY, B. W. and HOLLAND, C. D. (1959) Formation of gas bubbles at submerged orifices. A.I.Ch.E. Journal, 5, 319-324.
HOOPER, A. P. (1986) A study of bubble formation at a submerged orifice using the boundary element method. Chem. Eng. Sci., 41, 1879-1890.
MARMUR, A. and RUBIN, E. (1976) A theoretical model for bubble formation at an orifice submerged in an inviscid liquid. Chem. Eng. Sci., 31, 453-463.
PINCZEWSKI, W. V. (1981) The formation and growth of bubbles at a submerged orifice. Chem. Eng. Sci., 36, 405-411.