White Rose Research Online URL for this paper:
http://eprints.whiterose.ac.uk/117015/
Version: Accepted Version
Article:
Kang, J. orcid.org/0000-0001-8995-5636, Meng, Q. and Jin, H. (2012) Effects of individual
sound sources on the subjective loudness and acoustic comfort in underground shopping
streets. Science of the Total Environment, 435. pp. 80-89. ISSN 0048-9697
https://doi.org/10.1016/j.scitotenv.2012.06.105
Article available under the terms of the CC-BY-NC-ND licence
(https://creativecommons.org/licenses/by-nc-nd/4.0/
eprints@whiterose.ac.uk https://eprints.whiterose.ac.uk/
Reuse
This article is distributed under the terms of the Creative Commons Attribution-NonCommercial-NoDerivs (CC BY-NC-ND) licence. This licence only allows you to download this work and share it with others as long as you credit the authors, but you can’t change the article in any way or use it commercially. More
information and the full terms of the licence here: https://creativecommons.org/licenses/
Takedown
If you consider content in White Rose Research Online to be in breach of UK law, please notify us by
Science of the Total Environment, Volume 435-436, 2012, Pages:80-89 page 1
Effects of Individual Sound Sources on the Subjective Loudness and
Acoustic Comfort in Underground Shopping Streets
Jian Kang a, b Qi Meng a* Hong Jin a
a School of Architecture, Harbin Institute of Technology, Harbin, 150001, China b School of Architecture, University of Sheffield, Sheffield S10 2TN, UK *Correspondence author: mengq@hit.edu.cn
Abstract
Previous studies have demonstrated that human evaluation of subjective loudness and acoustic comfort depends on a series of factors in a particular situation rather than only on sound pressure levels. In the present study, a large-scale subjective survey has been undertaken on underground shopping streets in Harbin, China, to determine how individual sound sources influence subjective loudness and acoustic comfort evaluation. Based on the analysis of case study results, it has been shown that all individual sound sources can increase subjective loudness to a certain degree. However, their levels of influence on acoustic comfort are different. Background music and the public address system can increase acoustic comfort, with a mean difference of 0.18 to 0.32 and 0.21 to 0.27, respectively, where a five-point bipolar category scale is used. Music from shops and vendor shouts can decrease acoustic comfort, with a mean difference of -0.11 to -0.38 and -0.39 to -0.62, respectively. The feasibility of improving acoustic comfort by changing certain sound sources is thus demonstrated.
Keywords: Sound source; underground shopping street; subjective loudness; acoustic
comfort
Date received: 4 June 2012 Date accepted:26 June 2012
Science of the Total Environment, Volume 435-436, 2012, Pages:80-89 page 2
1. Introduction
Underground shopping streets are very common in China, and acoustic problems have become one of the major research topics as a result of the construction of underground shopping streets in recent years (Wang, 2000). Although several studies on reducing noise in underground shopping streets (Tong, 1996; CAE, 2001; Ding, 2008) have been conducted, other studies suggest that the human evaluation of subjective loudness and acoustic comfort depends on a series of factors, such as individual sound sources, social characteristics of users, and general environment, rather than on sound levels only (Schafer 1977; Gaver, 1993; Dubois, 2000; Yang and Kang, 2005; Zhang and Kang, 2007; Mao, 2009; Joynt and Kang, 2010; Kang and Zhang, 2010). In the current study, several main sound sources, such as
background music, music from shops, public address (PA) system, and vendor shouts in underground shopping streets, are analysed to determine their influence on subjective loudness and acoustic comfort.
2. Methodology
Science of the Total Environment, Volume 435-436, 2012, Pages:80-89 page 3
locations were distributed evenly in every underground shopping street to ensure that typical areas were considered. Figure 1 shows the plans of two typical underground shopping streets, namely Shi Tou Dao and Harbin Railway Station. The surveys were conducted every 10 minutes in these survey locations to ensure stochastic behaviour in the survey.
Table1. The correlations between other factor and subjective loudness as well as acoustic comfort.
Variables
Subjective loudness
Acoustic comfort
Shi Tou Dao Harbin Railwa y Station Qiu Lin Hui Zha n Le Son g Shi Tou Dao Harbin Railwa y Station Qiu Lin Hui Zha n Le Son g Users’ social backgrounds
Gender 0.05 -0.24* 0.13 0.01 0.00 -0.19* -0.15 -0.05 -0.07 0.03 Age -0.06 0.08 0.10 -0.01 -0.02 -0.03 -0.01 -0.01 -0.05 0.09 Income 0.38*
* 0.12** 0.21* * 0.30* * 0.26* * -0.45* * -0.44** -0.52* * -0.51* * -0.37* *
Education 0.20*
* 0.06 0.07 0.04 0.05 -0.32* * -0.41** -0.39* * -0.45* * -0.40* * Occupation 0.22*
* 0.27** 0.19*
* 0.13 0.19*
* 0.19*
* 0.17 0.18* 0.16* 0.17* * Users’ behaviours Aim of coming 0.15*
* 0.19** 0.13* 0.18*
* 0.17*
* 0.10 0.13** 0.10 0.09 0.16* * Frequency of coming -0.29* * -0.37** -0.20* * -0.18* * -0.30* * 0.20*
* 0.16** 0.18* * 0.13* * 0.26* *
Seasons 0.08 0.18 0.15 0.17 0.20*
* 0.23* 0.18* 0.19* 0.18 0.19*
* Visit time 0.04 0.02 0.02 0.03 0.05 0.09 0.11 0.04 0.08 0.10
Stay time -0.16*
*
-0.32** -0.08 -0.14* * -0.33* *
0.06 0.27** 0.22*
* -0.01 0.12*
Partners 0.03 -0.31** 0.08 0.10* -0.04 -0.09 0.01 0.11 -0.01 -0.12 Environmenta
l variables
Density of
people 0.27** 0.30** 0.34* * 0.36* * 0.38* * -0.21* * -0.16** -0.15* * -0.19* * -0.17* *
SPL 0.69*
* 0.64** 0.74* * 0.64* * 0.79* * -0.26* * -0.39** -0.25* * -0.16* * -0.21* * Air
temperature -0.02 0.01 -0.11*
*
-0.01 -0.06 0.13*
* 0.04 0.05 0.09 0.07
Relative
humidity -0.10 -0.29** 0.30* * 0.26* * -0.33* * 0.16*
* 0.35** -0.32* * -0.33* * 0.23* Horizonta l luminanc e
0.02 -0.07 -0.11*
*
-0.10* 0.23* *
0.32*
* 0.18** 0.27* * 0.23* * 0.29* * Reverberatio
n -0.03 0.25** 0.30*
Science of the Total Environment, Volume 435-436, 2012, Pages:80-89 page 4
(a)
[image:5.595.102.506.79.315.2](b)
Figure 1. Plans of the Shi Tou Dao (a) and Harbin Railway Station (b) underground shopping streets indicating the survey locations
The SPSS 14.0 software was used to establish a database of all results. T-test (two-tailed) was used for factors with two scales, such as subjective loudness with any sound or without sound.
3. Results and Analysis
Interviewees were asked to describe up to 5 sounds they heard in the underground shopping streets during the interview, and to note the three sounds they heard at first (Yu and Kang, 2009). In the analysis below, if a sound was listed by the interviewee as one of the 5 heard sounds, it is called “with the sound”, whereas if a sound was not listed by the interviewee, it is called “without the sound”.
The statistical analysis of the survey results reveals four sound sources that were cited most frequently (>600 times) by the interviewees in the questionnaire survey. These sources are background music (1485 times), music from shops (1077 times), PA system (942 times), and vendor shouts (880 times). This section focuses on the relationships between these sounds and subjective loudness or acoustic comfort.
3.1. Background Music
In all survey sites, subjective loudness is higher with background music than without,
with a mean difference of 0.21 in Shi Tou Dao (p ≤ 0.01), 0.08 in Harbin Railway Station (p ≤
Science of the Total Environment, Volume 435-436, 2012, Pages:80-89 page 5
background music ranges from 1.80 to 3.50. In Harbin Railway Station, the subjective loudness with background music ranges from 2.00 to 3.40, and that without background music ranges from 2.10 to 3.30, as shown in Figure 2.
(a)
[image:6.595.163.433.130.413.2](b)
Figure 2. Influence of background music on the subjective loudness evaluation in Shi Tou Dao (a) and Harbin Railway Station (b) underground shopping streets
Acoustic comfort is also higher with background music than without background music,
with a mean difference of 0.32 in Shi Tou Dao (p ≤ 0.01), 0.18 in Harbin Railway Station (p ≤
Science of the Total Environment, Volume 435-436, 2012, Pages:80-89 page 6
(a)
[image:7.595.161.437.79.386.2](b)
Figure 3. Influence of background music on the acoustic comfort evaluation in Shi Tou Dao (a) and Harbin Railway Station (b) underground shopping streets
3.2. Music from Shops
In all survey sites, subjective loudness is higher with than without music from shops, with a mean difference of 0.36 in Shi Tou Dao (p ≤ 0.01), 0.64 in Harbin Railway Station (p ≤ 0.01), 0.28 in Qiu Lin (p ≤ 0.01), 0.34 in Hui Zhan(p ≤ 0.01), and 0.40 in Le Song (p ≤ 0.01). Subjective loudness also varies in every survey location. In Shi Tou Dao, the subjective loudness with music from shops ranges from 3.20 to 3.90, whereas that without music from shops ranges from 2.70 to 3.40. In Harbin Railway Station, the subjective loudness with music from shops ranges from 3.30 to 4.20, whereas that without music from shops is 2.50 to 3.40, as shown in Figure 4.
Acoustic comfort, however, is lower with music from shops than that without in most survey sites, with a mean difference of -0.38 in Harbin Railway Station (p ≤ 0.01), -0.11 in
Qiu Lin (p ≤ 0.05), -0.20 in Hui Zhan (p ≤ 0.05), and -0.28 in Le Song (p ≤0.05). The mean
Science of the Total Environment, Volume 435-436, 2012, Pages:80-89 page 7
(a)
[image:8.595.168.432.73.356.2](b)
Figure 4. Influence of music from shops on the subjective loudness evaluation in Shi Tou Dao (a) and Harbin Railway Station (b) underground shopping streets
(a)
(b)
[image:8.595.163.433.393.687.2]Science of the Total Environment, Volume 435-436, 2012, Pages:80-89 page 8
3.3. PA System
In all survey sites, the subjective loudness with the PA system is higher than that without, with a mean difference of 0.20 in Shi Tou Dao (p ≤ 0.01), 0.20 in Hui Zhan (p ≤ 0.01), and
0.15 in Le Song (p ≤0.05). It is noted that the PA system did not work in Qiu Lin and Harbin
Railway Station. Subjective loudness also varies in every survey location. In Shi Tou Dao, the subjective loudness with the PA system ranges from 2.40 to 4.30, whereas that without the PA system ranges from 2.60 to 3.70. In Hui Zhan, the subjective loudness with the PA system ranges from 2.60 to 4.10, whereas that without the PA system ranges from 2.70 to 3.80, as shown in Figure 6. The influence on subjective loudness by the PA system is lower than that by music from shops in several locations because the music from shops was too loud that the
PA system could not be heard by the interviewees.
(a)
(b)
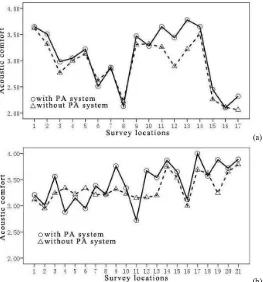
Acoustic comfort is also higher with the PA system than that without, with a mean difference of 0.27 in Shi Tou Dao (p ≤ 0.01), 0.25 in Hui Zhan (p ≤ 0.01), and 0.21 in Le
Song (p ≤ 0.01). The influence on acoustic comfort by the PA system is lower than that by
Science of the Total Environment, Volume 435-436, 2012, Pages:80-89 page 9
(a)
[image:10.595.169.432.74.356.2](b)
Figure 7. Influence of the PA system on the acoustic comfort evaluation in Shi Tou Dao (a) and Hui Zhan (b) underground shopping streets
(a)
(b)
[image:10.595.166.432.400.688.2]Science of the Total Environment, Volume 435-436, 2012, Pages:80-89 page 10
3.4. Vendor Shouts
In several underground shopping streets where the PA system does not work, such as Qiu Lin and Harbin Railway Station, vendors have to shout to attract the attention of customers. In these survey sites, subjective loudness is higher with vendor shouts than without vendor
shouts, as expected, with a mean difference of 0.43 in Qiu Lin (p ≤ 0.01), and 0.29 in Harbin
Railway Station (p ≤ 0.01). In Qiu Lin, the subjective loudness is 3.30 to 4.00 with vendor shouts, whereas that without vendor shouts is 2.60 to 3.60. In Harbin Railway Station, the subjective loudness with vendor shouts ranges from 3.10 to 3.70, whereas that without vendor shouts is 2.60 to 3.40, as shown in Figure 8.
However, the acoustic comfort with vendor shouts is lower than without in most survey
sites, with a mean difference of -0.62 in Qiu Lin (p ≤ 0.01), and -0.39 in Harbin Railway Station (p ≤ 0.01). In Qiu Lin, the acoustic comfort with vendor shouts ranges from 2.20 to 3.30, whereas that without vendor shouts is 3.10 to 3.90. In Harbin Railway Station, the acoustic comfort with vendor shouts ranges from 2.60 to 3.40, whereas that without vendor shouts is 3.00 to 3.70, as shown in Figure 9. Comparing the PA system and vendor shouts, which have the same goal of providing shopping information, the latter is usually considered as noise, hence causing discomfort to respondents. Therefore, a PA system instead of vendor shouts may be a better way to increase acoustic comfort.
(a)
[image:11.595.169.433.401.685.2](b)
Science of the Total Environment, Volume 435-436, 2012, Pages:80-89 page 11
6. Conclusions
Based on the analysis of the case study results, all individual sound sources can increase subjective loudness to a certain degree in underground shopping streets. However, their levels of influence on acoustic comfort are different. Background music and the PA system can increase acoustic comfort, with a mean difference of 0.18 to 0.32 and 0.21 to 0.27, respectively. Music from shops and vendor shouts can decrease acoustic comfort, with a mean difference of -0.11 to -0.38 and -0.39 to -0.62, respectively.
These results can enhance knowledge on the effect of individual sound sources. With these results, acoustic comfort can be improved by changing certain sound sources.
Acknowledgments: The work was funded by the State Natural Science
Foundation of China (Project Number: 50928801), the PR China Ministry of
Education Foundation for PhD Bases (20112302110045) and the Harbin
Science of the Total Environment, Volume 435-436, 2012, Pages:80-89 page 12
References
Ding, J.H. (2008). A Research on Fire Safety Evacuation Design in Underground Shopping Streets. Master Thesis, Harbin Institute of Technology, Harbin, China.
Dubois, D. (2000). Categories as acts of meaning: the case of categories in olfaction and audition. Cognitive Science Quarterly, 1, 35–68.
Gaver, W. (1993). What in the world do we hear, An ecological approach to auditory event perception. Ecological Psychology, 5, 1–29.
Joynt, J., and Kang, J. (2010). The influence of preconceptions on perceived sound reduction by environmental noise barriers. Science of the Total Environment, 408, 4368-4375.
Kang, J. (2006). Urban Sound Environment, Taylor and Francis, London, UK.
Kang, J., and Zhang, M. (2010). Semantic differential analysis of the soundscape in urban open public spaces. Building and Environment, 45, 150-157.
Mao, D.X. (2009). Recent progress in hearing perception of loudness. Technical Acoustics, 28, 693-696.
Meng, Q. (2010). Research and Prediction on Soundscape in Underground Shopping Streets. PhD Thesis, Harbin Institute of Technology, Harbin, China.
Research Teams of Chinese Academy of Engineering. (2001). Development and Utilization of Underground Space in Urban Areas of China. China Architecture & Building Press, Beijing.
Schafer, R.M. (1977). The Tuning of the World, New York, Knopf.
Szeremeta, B., Trombetta, Z., and Paulo, H. (2009). Analysis and evaluation of soundscapes in public parks through interviews and measurement of noise. Science of the Total
Environment, 407, 6143-6149.
Tong, L.X. (2006). Planning and Design in Underground Shopping Streets. China Architecture & Building Press, Beijing, 57.
Wang, W.Q. (2000). Plan and Design in Underground Space of Urban Areas. Southeast University Press, Nanjing.
Yang, W., and Kang, J. (2005). Acoustic comfort evaluation in urban open public spaces. Applied Acoustics, 66, 211–229.
Science of the Total Environment, Volume 435-436, 2012, Pages:80-89 page 13
Yu, L., and Kang, J. (2009). Modeling subjective evaluation of soundscape quality in urban open spaces: An artificial neural network approach. Journal of the Acoustical Society of America, 126, 1163-1174.
Zhang, M., and Kang, J. (2007). Towards the evaluation, description, and creation of