White Rose Research Online URL for this paper: http://eprints.whiterose.ac.uk/87743/
Version: Accepted Version
Article:
Holmes, J., Meier, P.S., Booth, A. et al. (2 more authors) (2012) The temporal relationship between per capita alcohol consumption and harm: A systematic review of time lag
specifications in aggregate time series analyses. Drug and Alcohol Dependence , 123 (1-3). 7 - 14. ISSN 0376-8716
https://doi.org/10.1016/j.drugalcdep.2011.12.005
[email protected] https://eprints.whiterose.ac.uk/
Reuse
Unless indicated otherwise, fulltext items are protected by copyright with all rights reserved. The copyright exception in section 29 of the Copyright, Designs and Patents Act 1988 allows the making of a single copy solely for the purpose of non-commercial research or private study within the limits of fair dealing. The publisher or other rights-holder may allow further reproduction and re-use of this version - refer to the White Rose Research Online record for this item. Where records identify the publisher as the copyright holder, users can verify any specific terms of use on the publisher’s website.
Takedown
If you consider content in White Rose Research Online to be in breach of UK law, please notify us by
1
The temporal relationship between per capita alcohol consumption and harm: A systematic review of time lag specifications in aggregate time series analyses
John Holmes 1; Petra S. Meier.1; Andrew Booth2; Yelan Guo1; Alan Brennan2.
Author affiliations: 1
Section of Public Health, School of Health and Related Research (ScHARR), University of Sheffield, 30 Regent Street, Sheffield, S1 4DA, UK
2
Health Economics and Decision Science (HEDS), School of Health and Related Research (ScHARR), University of Sheffield, 30 Regent Street, Sheffield, S1 4DA, UK
Corresponding author: Dr. John Holmes, 0044 114 2226384; [email protected]
Running head: Time lags from consumption harm
Declaration of interest: This work was funded by a grant from the Medical Research Council (G000043)
2 Abstract:
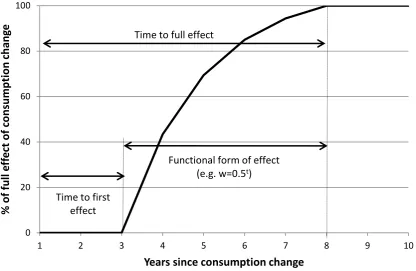
Background: Changes in per capita alcohol consumption are temporally linked to changes in rates of alcohol-related harm. Methodological approaches for analysing this relationship have been suggested, however, the problem of time lags is not well-addressed. This study provides a review of time lag specifications, looking at a) time to first effect on harm, b) time to full effect and c) the functional form of the effect accumulation from first to full effect to inform modelling of the relationship between changes in aggregate alcohol consumption and changes in rates of harm.
Methods: Bibliographic databases were searched and citation and reference checking was used to identify studies. Included studies were time series analyses of the relationship between aggregated population alcohol consumption and rates of alcohol-related harms where time lag specifications had been derived or tested.
Results: 36 studies were included with liver cirrhosis, heart disease and suicide dominating the evidence base. For a large number of alcohol-related harms, no literature was identified. There was strong evidence of an immediate first effect following a change in consumption for most harms. Recommended lag specifications are proposed for a set of alcohol-attributable harms.
Conclusions: Research on time lag specifications is under-developed for most harms although we provide suggested specifications based on the findings of the review. Greater methodological attention needs to be given to the rationale for choosing or applying lag specifications and the inherent complexity of the time lag process. More consistent and transparent reporting of methodological decisions would aide progress in the field.
3 1. Introduction
Average levels of alcohol consumption in the population are widely recognised as a relevant public health indicator. Such aggregate levels of consumption have been associated with the incidence and prevalence of a range of alcohol-related harms including morbidity and mortality from various health conditions and also rates of crime, unemployment and workplace absences (2009). These associations can be seen in cross-sectional studies; however, stronger evidence comes from time series analyses showing that changes in per capita alcohol consumption are temporally linked to changes in rates of alcohol-related harms. Although methodological approaches for such analyses have been suggested
(Norström & Skog 2001; Rehm & Gmel 2001) debates on aspects of applying these continue. One such aspect is the time lag problem.
Given that much alcohol-related harm is the accumulated result of years of harmful individual drinking behaviours, the full effect of changes in consumption may not be
immediately apparent in harm data. Instead, the effect of changes in aggregate consumption may be delayed and distributed over a number of years. In response to this problem, it is commonplace to incorporate a lag structure into time series analyses to ensure the full long-term effect is captured.
Studies which have explored time lags in depth have tended to focus on liver cirrhosis and have found that, despite the anticipated long-term effect, much of the impact on cirrhosis mortality rates occurs in the first year following a change in consumption (Kerr et al. 2000; Skog 1984). This somewhat paradoxical finding of immediate effects at the aggregate level on a harm which develops after many years of heavy drinking at the individual level can be clearly observed in the sharp falls in cirrhosis deaths following alcohol rationing in Paris during World War Two (Norström 1987).
The notion of critical thresholds has typically been used to explain this paradox (Norström 1987; Norström 1989; Skog 1980). It is postulated that, at any given time, there are a group of people with advanced liver cirrhosis for whom a change in alcohol consumption could prompt or prevent liver failure. It is changes in the mortality rate within this group which are often used to explain the rapid effects of changes in aggregate alcohol consumption
(Norström & Skog 2001). Simultaneous changes in alcohol consumption amongst those who are not at this critical threshold also need to be accounted for and Skog (1984) and Norström (1987) have obtained consistent results modelling lag structures specifying both short- and long-term effects for the UK and Sweden respectively. However, other work has suggested time series models accounting only for a short-term effect adequately fit the data (Kerr et al. 2000; Roizen et al. 1999).
4 2. Methods
The search was conducted across the following databases between December 2010 and February 2011: ASSIA, Campbell Collaboration, CINAHL, Econlit, IBSS, Embase, Medline, PsychINFO, Scopus, Social Care Online, Sociological Abstracts, Web of Knowledge and World Political Science Abstracts.
The full search terms can be seen in the online Appendix 1. The search was conducted in three stages using a set of alcohol terms combined in turn with three sets of terms relating to lags. These three sets were progressively less precise to account for the anticipated
diffuseness of the literature with lags typically not mentioned in abstracts. A search of the first twenty pages of Google Scholar results using the same search terms and reference and citation checking of all relevant studies were used to identify further studies.
Search results were first assessed by title and then abstract. This process was initially undertaken independently on small samples of papers by two researchers with high rates of agreement obtained. Studies not rejected at this stage were obtained and read in greater depth to assess relevance.
Inclusion criteria were that studies should 1) be aggregate level time series analyses with sufficient data points to assess lag specifications; 2) examine effects of changes in alcohol consumption on rates of alcohol-attributable health, crime or employment harms; 3) conduct analyses of at least one of the three lag specifications of interest. The main exclusion criteria were that 1) studies should not simply include lag specifications without mentioning any testing of alternative specifications and 2) that lag specifications should be empirically analysed, not simply inferred from inspection of time series graphs or raw data.
Data extraction was undertaken by the lead author. The key data extracted were location of study and time period, modelling approach employed, specific consumption and harm measures used, the lag specifications and the method used for deriving them
No meta-analysis was attempted as the resulting lag specifications are insufficiently homogenous in structure or varied in duration for this to be meaningful.
3. Results
5
cirrhosis, heart disease and suicide in turn. Finally, a brief summary of results for other harms is presented. For each harm section, the results for time to first effect are discussed first followed by the results for the functional form and finally the time to full effect. The full results can be seen in the online Appendix 2.
3.1Methodological findings
The most widely used approach to modelling population-level time series relationships between alcohol consumption and alcohol-related harm is ARIMA modelling, also referred to as the Box-Jenkins method, (Box & Jenkins 1976), and this was used by almost all of the studies identified. This method allows analysts to regress the harm series onto the
consumption series whilst controlling for a range of statistical features commonly found in time series which may bias parameter estimates. These include underlying trends in the data, autoregression of the time series and autocorrelation of error terms. ARIMA modelling also permits easy inclusion of consumption levels from previous years as additional predictors of current levels of harm in the regression equation. Therefore, a common approach is to weight the coefficients of these lagged consumption terms to specify the lagged effects of
consumption on harm – the lag structure. .
The basic ARIMA model estimating the influence of alcohol consumption on alcohol-related is as follows:
Where indicates the series has been differenced to account for shared underlying trends between the consumption and harms series which may bias correlations; lnHt is the natural logarithm of the harm series at time t; b is the effect of a weighted alcohol series (Awt) on harm; c is the effect of confounders (Dt) on harm and Nt is the noise term which may include autoregressive or moving average parameters (see Box & Jenkins 1976).
The weighted alcohol series contains the lag structure such that:
Where w terms are the different effects of the lagged alcohol consumption series A.
Although most studies employed ARIMA modelling, this was not always the case and where lag specifications differed between studies, a key explanation is found in different
methodological approaches to deriving specifications. Although rarely discussed in the literature, the methods employed have important implications for the lag specifications which are chosen and also for which lag parameters are being derived within the analysis and which must be implicitly or explicitly selected a priori.
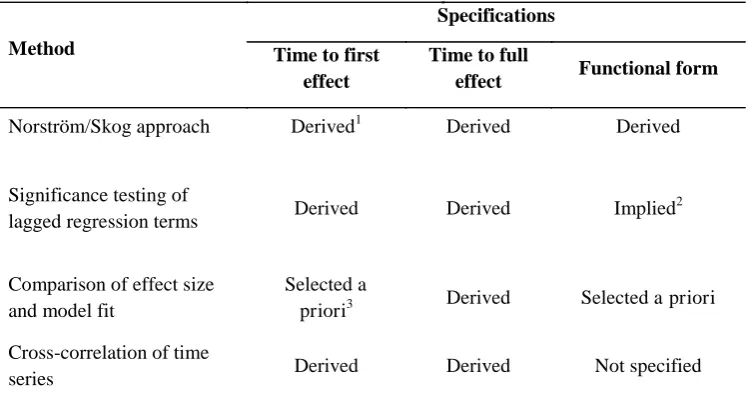
Four main approaches to deriving specifications were identified and are outlined below with a summary provided in Table 1.
6
a distributed lag structure with both short- and long-term effects operating over many years and taking the form:
Where is the total lag weight at time t, is the short-term effect at time t, is the long-term effect at time t and p is the balance of total effect between the short- and long-long-term effect where p ≤ 1 and p ≥ 0. Skog then derived parameters to fit this pre-specified structure for Britain giving the lag structure:
Norström (1987) subsequently replicated Skog’s findings by selecting the same form of lag structure and re-estimating its parameters for the Swedish context, obtaining the lag structure:
Although comprehensive, Skog’s approach is complex, requiring inferences drawn from analyses across multiple data sources and has not been attempted in the published literature for other harms. For this reason, we distinguish it from other approaches.
The second approach is more widely used and involves iteratively testing the significance of lagged consumption terms in regression equations (usually ARIMA regression equations but in some cases generalised linear model regression equations) to assess the effects of
consumption in each previous year on current levels of harm. Significant terms are then included in the final regression equation. Although, the derivation of a functional form for the lag structure is usually not an explicit aim of this process, such a structure is implied by the relative size of each consumption year’s coefficient in the regression equation.. Skog and Elekes (1993) extend this analysis by using a Koyck model (Johnson 1984) to derive a functional form, however, no other study did so. This second approach to empirically deriving lag specifications is more straightforward than Skog’s (1984) method; however, identification of long-term lags is hampered by the difficulty of testing the significance of small effect sizes seen at longer lags. As a result, studies using this approach tend to identify only short-term lag structures and this may be considered an inherent bias.
7
approach is that it allows longer lags to full effect to be specified as the focus is on model fit and total effect size rather than the significance of individual consumption terms.
A final approach is to test the significance of correlations between harm series and the consumption series at various lags. Best practice suggests this should be done using differenced data (Norström & Skog 2001) although this is not always adhered to. This approach is the weakest of the methods as it has the same difficulties in identifying longer lags as the second approach and does not derive or imply a functional form for the lag structure.
As noted above, most papers offer little or no explanation of why they have chosen a particular method. However, when reading the results below, the limitations of each approach should be borne in mind when interpreting the lag specifications which have
resulted. No approach can be said to be inherently superior as, for example, Skog’s approach is comprehensive but beyond the scope of many analyses, testing the significance of
regression terms is straightforward but has a bias for shorter lag durations and selecting lag structures a priori offers grounding in previous research but justifications for the validity of selections are rarely readily available.
3.2Liver cirrhosis
The most sophisticated work on lag specifications has been undertaken for liver cirrhosis with eight studies identified covering a broad range of developed nations (Corrao 1998; Corrao et al. 1997; Kerr et al. 2000; Norström 1987; Ramstedt 2007; Roizen et al. 1999; Skog 1984; Ye & Kerr 2011) and Eastern Europe (Corrao 1998; Corrao et al. 1997; Roizen et al. 1999). Methods used for selecting lag structures were the Norström/Skog approach
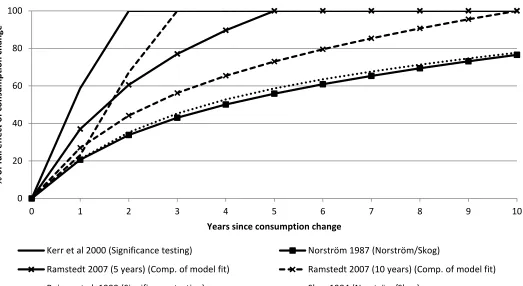
(Norström 1987; Skog 1984), significance testing of regression terms (Kerr et al. 2000; Roizen et al. 1999) and comparison of overall effect size or model fit (Corrao 1998; Corrao et al. 1997; Ramstedt 2007; Ye & Kerr 2011). Where sufficient specifications and information were available, the lag structures are shown in Figure 3.
Most studies used lag specifications which modelled an immediate effect and, where tested, change in current aggregate drinking was found to have a significant effect on cirrhosis rates within the first year following the change (Corrao 1998; Corrao et al. 1997; Kerr et al. 2000; Roizen et al. 1999). Evidence from Eastern Europe was contradictory with studies finding the first effect was lagged by more than five years (Corrao 1998; Corrao et al. 1997) whilst Ramstedt (2007) modelled an immediate effect. Limitations relating to the use of
undifferenced time series in the Corrao studies and specifying immediate effects a priori in the Ramstedt study mean neither finding can be considered robust evidence; thus further validation of the time to first effect is needed for Eastern Europe.
8
years. The size of the first year effect showed some consistency with Skog (1984), Norström (1987) and Kerr et al. (2000) finding approximately 60 per cent of the total effect is seen in the first year if Skog and Norström’s lag durations are truncated to the same length as Kerr et al.’s. A smaller first year effect of 23 per cent was derived by Roizen et al. (1999) and the reasons for this disparity are unclear. One possible explanation may lie in Roizen et al.’s national-level US data being less robust to random error than Kerr et al.’s pooled state-level US data.
The duration to full effect was estimated by four studies (Kerr et al. 2000; Ramstedt 2007; Roizen et al. 1999; Ye & Kerr 2011) and, additionally, the lag structures of both Skog (1984) and Norström (1987) imply the full effect is distributed over as many as 40 years. Roizen et al. (1999) and Kerr et al. (2000) found only short-term lagged consumption term were significant in their regression equations and, consequently, the lag duration was truncated to two years and one year respectively. In contrast Ye and Kerr (2011) and Ramstedt (2007) tested the effect size of Norström’s (1987) lag structure with lag durations of zero and five years, with Ramstedt also testing a ten year lag model. In both cases the five year lag models showed larger effects than alternatives, although the differences may be insignificant for some of the wide range of modelling techniques explored by Ye and Kerr. Given the
difficulty of identifying small individual effect sizes at longer lags (Norström & Skog 2001), this review gives greater weight to those studies comparing different lag durations rather than testing individual terms and concludes that lags of at least five years may be necessary to capture the full effect of changes in aggregate alcohol consumption on rates of cirrhosis mortality. However, it should be noted that the number of specific lag durations tested was limited and evidence in this area can therefore only be considered as indicative at this stage.
3.3 Heart disease
Eight studies addressed ischaemic heart disease (IHD) with data again taken from a range of developed countries (Hemstrom 2001; Kerr et al. 2011; Kerr & Ye 2007; Laporte et al. 1980; Schmidt & Popham 1981; Skog 1983) and Eastern Europe (Razvodovsky 2009a, 2010a). Lag specifications were selected using comparison of overall effect size or model fit
(Hemstrom 2001; Kerr et al. 2011) and cross correlation of differenced (Razvodovsky 2009a, 2010a; Skog 1983) or undifferenced (Laporte et al. 1980; Schmidt & Popham 1981) time series. One study selected lagged specifications using unspecified testing (Kerr & Ye 2007). Where sufficient specifications and information was available, the lag structures are shown in Figure 4.
Most of the studies found significant effects on heart disease rates in the first year and no evidence of a lag to first effect in any context. The exception was LaPorte et al. (1980) which found a five year lag to first effect for beer consumption and no significant effects for other alcohol measures. Given the consistency across the other studies, it is likely this result can be attributed to the analysis using undifferenced time series with their associated biases
9
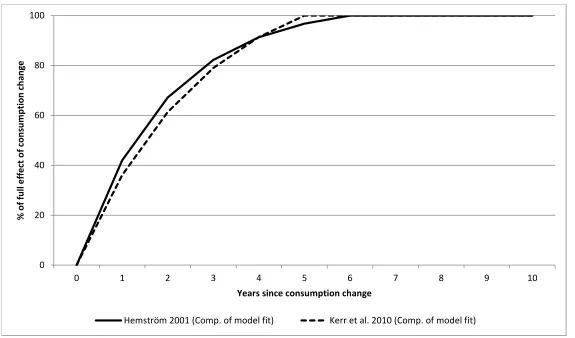
Five of the studies found no evidence of, or did not test for, a lag to full effect and
consequently included no lag structure (Kerr & Ye 2007; Laporte et al. 1980; Razvodovsky 2009a, 2010a; Skog 1983). Where lag structures were used, there was limited information provided as to why these were selected. Both Kerr et al. (2011) and Hemström (2001) employed distributed geometrically declining lag structures (i.e. lag structures where the lag weight allocated to each lagged year i equalled xi). Kerr et al. derived a distributed lag structure where x equalled 0.7 through testing which is not detailed in the paper, whilst Hemström employed a lag structure where x equalled 0.8 which was derived in a study of cigarette smoking and all-cause mortality (Hemstrom 1999). As with the liver cirrhosis lag structures, both of these loaded the greatest effect onto the first year with declining loads on subsequent lagged years.
Systematic disagreement was found with regard to the duration to full effect. Studies which used cross-correlation of differenced time series found no significant lags to full effect; however, those studies which compared a zero lag model to one with five or six years lag (Hemstrom 2001; Kerr et al. 2011) found the longer lag durations gave the better model fit. This is again in line with the implications of the methodological results discussed above relating to identifying small effect sizes at longer lags.
3.4Suicide
Suicide represents something of a special case in the time lags literature as it straddles the boundary between chronic harms, which are assumed to be subject to lagged effects, and acute harms, which are not. An individual may commit suicide both following a single bout of heavy drinking and also as a result of suicidal ideation attributable to chronic heavy drinking (Mäkelä 1996). Ten studies relating to suicide were identified with the study locations covering Russia (Pridemore & Chamlin 2006; Razvodovsky 2009c, 2009d, 2010b; Stickley et al. 2011), Belarus (Razvodovsky 2007b, 2009b, 2011), Hungary (Skog & Elekes 1993) and Finland (Mäkelä 1996). Methods for estimating lag specifications were cross-correlation of differenced time series (Pridemore & Chamlin 2006; Razvodovsky 2007b, 2009b, 2009c, 2009d, 2010b, 2011; Stickley et al. 2011) and significance testing of regression terms (Mäkelä 1996) with one study extending this approach by using Koyck models (Skog & Elekes 1993).
10
In line with expectations regarding the relationship between suicide and acute and chronic drinking, the studies which identified no lagged effects were all those which used proxies for acute drinking as their consumption measure whereas studies which identified lagged effects all used mean consumption measures.
3.5Other harms
In addition to those harms discussed above, smaller numbers of studies were found which tested lag specifications for overall alcohol-related mortality (Skog 1987), pancreatitis (Ramstedt 2004), diabetes (Razvodovsky 2008a), delirium tremens (Skog & Melberg 2006), drink-driving related incidents (Wagenaar 1985), homicide (Razvodovsky 2007a, 2008b; Stickley & Razvodovsky 2011), work absences (Norström 2006) and various forms of violent and sudden alcohol-related mortality (Razvodovsky 2010b; Skog 1986). As above, different approaches for selecting lag specifications were used, namely comparison of overall effect size or model fit (Ramstedt 2004), cross-correlation of differenced time series (Razvodovsky 2007a, 2008a, 2008b, 2010b; Skog 1986; Skog & Melberg 2006; Stickley & Razvodovsky 2011; Wagenaar 1985) and unspecified or unsuccessful testing in two cases (Norström 2006; Skog 1987).
Immediate effects were specified for all of the above studies, although not all studies actually tested for the presence of these effects. A range of lag structures were applied, however, only the Wagenaar (1985) study of drink-driving derived its lag structure. Others transferred lag structures derived for other harms to a new context. For example, Ramstedt’s (2004) analysis of pancreatitis mortality used Norström’s (1987) cirrhosis lag structure and Norström’s (2006) study of work absence used a 0.7 geometrically declining lag structure derived for all-cause mortality (although Norström notes that efforts to derive a work absence-specific lag structure were unsuccessful). The duration to full effect was tested in several studies and results ranged from zero years to five years; however, as above, the specification of this duration appeared partially dependent on the means used to derive it with shorter durations found when significance testing was employed.
3.6Harms not covered
11 4. Discussion
The above review presents current knowledge on the different ways of deriving time lag specifications when modelling the effects of aggregate alcohol consumption on rates of various alcohol-related harms. Although consistency across studies is limited, some recommendations can be made about valid lag specifications for different harms. These are presented at the start of the discussion followed by some general comments on deriving, modelling and reporting lag specifications.
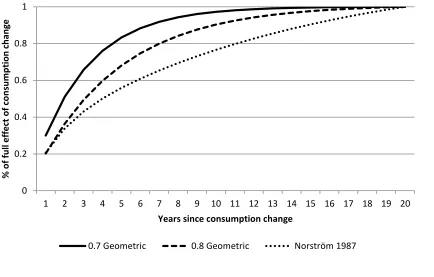
The results highlight that substantial work on lag specifications has only been conducted for liver cirrhosis, heart disease and suicide mortality, with the latter primarily examined in the context of Eastern Europe with its particular drinking culture. For these harms, the evidence indicates that immediate effects from a change in alcohol consumption should be expected at the aggregate level. The theoretical rationale is well established in the case of liver cirrhosis mortality and relates to the notion of critical thresholds whereby individuals with advanced cirrhosis are particularly sensitive to consumption changes (Norström & Skog 2001). For suicide the immediate effect is attributed to the role of acute intoxication in prompting the suicidal act. However, for heart disease, the rationale is ill-addressed and better links need to be made between the aetiological and aggregate time series literature to explain this finding. A range of lag structures and durations to full effect are applied and Figure 5 demonstrates how different lag structures can substantially alter the rate at which the total effect
accumulates. The lag structures used typically specified the immediate effect as the greatest single year effect, with declining effects attributed to subsequent years1. However, a
justification for this is only found in the empirical work of Skog (1984) and Norström (1987) on liver cirrhosis. The substantial variation found in durations to full effect is partly a
product of methodological decisions, but for liver cirrhosis, models which have specified lag durations of five or more years have typically found these specifications fit the data better and show larger overall effect sizes than short-term lags, although only limited exploration of this has been undertaken. In the case of heart disease, there is less evidence or agreement and work remains to be done to establish appropriate lag durations. For suicide, a lag duration of one year is repeatedly found for the Eastern European context.
The overall findings of the review describe a fairly underdeveloped knowledgebase, with a lack of any literature on a large number of major alcohol-attributable harms such as cancers and stroke. For alcohol-related morbidity, specifying temporal effects such as lag times is complicated by the fuzzy nature of the state of morbidity, inconsistent recording practises and difficulties in linking the timing of diagnoses with disease progress. Consequently, morbidity
1
12
lag specifications have generally not been addressed, despite some attention being given to the area in policy evaluations and avoidable cost studies (Herttua et al. 2011; Jarl et al. 2010).
Our motivation for reviewing time lag specifications was to inform the selection of specifications for use in a model of the effects of alcohol policies on alcohol consumption and related harms (Purshouse et al. 2009). Existing versions of the model assume no time lags for acute harms and all chronic conditions specify an immediate effect with linear functional form and ten years to full effect. As an addendum to this paper, we present in Table 2 what we consider to be our current ‘best evidence’ specifications for the full set of health harms modelled. These specifications would be used for all population groups for both mortality and, in the absence of better information, also morbidity. For cancers, selection was informed by a study of the change in head and neck cancer risk following drinking cessation (Rehm et al. 2007). For other harms where evidence was not found in the review, specifications were selected in consultation with clinicians. This involved
considering the processes by which alcohol causes each harm, comparing processes for harms with time lag evidence and those without and, in line with these comparisons, modifying the specifications for harms with evidence to provide specifications for those without. Lag specifications were truncated at a maximum of twenty years to reflect the longest expected running time of our model. This process is clearly prone to subjectivity and we welcome discussion of our suggestions.
One reason for the lack of attention given to time lags in the literature is that modelling them is a challenging task. It requires investigation of the aetiological and disease literature to inform and rationalise decisions, with awareness given to the relevance of both initial volume and patterns of consumption, the exposure period required for disease development, evidence of protective effects, the influence of competing risks, the risks for different social groups and the functional form of those risks. At the population level, attention needs to be given to age, period and cohort trends which may also distort temporal processes. It may also be necessary to address whether the lag response differs for consumption increases and decreases. Such complexity may be acting as a barrier to further investigation, particularly as time lags are typically only one element of most time series analyses (Rehm & Gmel 2001).
13
Greater reflection is also needed on how methodological decisions play a substantial role in determining which lag specifications are selected. Where lag structures or durations have been derived using significance testing, longer-term lags to full effect are rarely identified. Although it is possible this reflects the true nature of the effect, Norström and Skog (2001) argue it is due to the difficulties of significance testing for the small effect sizes inherent to longer-term lags.
With these considerations in mind we recommend the following to ensure better theoretical and empirical validation of lag specifications. Where possible, a comprehensive approach such as that undertaken by Skog (1984) and Norström (1987) should be used. This allows the identification of more complex lag structures which incorporate both short- and long-term effects as well as achieving improved model fit and longer lag times. Incorporating such complex lag structures has costs in terms of parsimony and the impact on overall effect estimates may be small; however, where there is a strong interest in modelling the
distribution of lagged effects across individual years, the trade-off may be beneficial. More generally, it would be a valuable addition to the field if further in-depth empirical work along these lines were undertaken, particularly for harms other than liver cirrhosis and with an additional focus on how lag specifications may be affected by the individual and population-level contexts we discuss above.
If this more complex approach is not possible and structures are selected a priori, authors should be aware of how different approaches to selecting or deriving lag specifications may impact on their findings. In particular, we recommend that they should be explicit in justifying their selection and their source of lag structures, in noting where potential
challenges to validity may lie and, in light of these acknowledgments, they should signpost when caution needs to be employed when interpreting results. When selecting lag durations using empirical methods, analysts should look beyond simply significance testing of
regression terms and, instead, examine patterns in the sign of cross-correlations of lagged years which may indicate consistent effects despite a lack of statistical significance. They should also test model fit and overall effect size using different lag durations to explore whether longer lag durations may be appropriate.
5. Limitations
The main limitation of the review was the difficulty in identifying relevant studies as lag specifications were commonly not referred to in abstracts. Reference and citation checking and professional networks were invaluable in limiting this; however, it is possible studies may have been omitted due to non-identification.
14
Time lag specifications for aggregate time series analyses of the impacts of changes in alcohol consumption on alcohol-related harms are underdeveloped for most harms. For liver cirrhosis, heart disease and suicide some recommendations can be made including the
15 References
Box,G.E.P., Jenkins,G.M., 1976. Time Series Analysis: Forecasting and Control. Holden-Day, London.
Corrao,G., 1998. Liver cirrhosis mortality trends in Eastern Europe, 1970-1989. Analyses of age, period and cohort effects and of latency with alcohol consumption. Addict Biol, 3, 413-422.
Corrao,G., Ferrari,P., Zambon,A., Torchio,P., 1997. Are the recent trends in liver cirrhosis mortality affected by the changes in alcohol consumption? Analysis of latency period in European countries. J. Stud. Alcohol, 58, 486-494.
Gruchow,H.W., Rimm,A.A., Hoffmann,R.G., 1983. Alcohol-Consumption and Ischemic-Heart-Disease Mortality - Are Time-Series Correlations Meaningful. Am J Epidemiology, 118, 641-650.
Hemstrom,O., 1999. Explaining differential rates of mortality decline for Swedish men and women: a time-series analysis, 1945-1992. Soc Sci Med, 48, 1759-1777.
Hemstrom,O., 2001. Per capita alcohol consumption and ischaemic heart disease mortality. Addiction, 96, S93-S112.
Herttua,K., Mäkelä,P., Martikainen,P., 2011. The effects of a large reduction in alcohol prices on hospitalizations related to alcohol: a population-based natural experiment. Addiction, 106, 759-767.
Jarl,J., Gerdtham,U.G., Ludbrook,A., Petrie,D., 2010. On Measurement of Avoidable and Unavoidable Cost of Alcohol: An Application of Method for Estimating Costs Due To Prior Consumption. Int J Environ Res Public Health, 7, 2881-2895.
Johnson,J., 1984. Econometric Methods. McGraw-Hill, New York.
Kerr,W.C., Fillmore,K.M., Marvy,P., 2000. Beverage-specific alcohol consumption and cirrhosis mortality in a group of English-speaking beer-drinking countries. Addiction, 95, 339-346.
Kerr,W.C., Karriker-Jaffe,K., Subbaraman,M., Ye,Y., 2011. Per capita alcohol consumption and ischemic heart disease mortality in a panel of US states from 1950 to 2002. Addiction, 106, 313-322.
Kerr,W.C., Ye,Y., 2007. Population-level relationships between alcohol consumption measures and ischemic heart disease mortality in US time-series. Alcohol Clin Exp Res, 31, 1913-1919.
16
Mäkelä,P., 1996. Alcohol consumption and suicide mortality by age among Finnish men, 1950-1991. Addiction, 91, 101-112.
Norström,T., 1987. The Impact of Per-Capita Consumption on Swedish Cirrhosis Mortality. Br. J. Addict., 82, 67-75.
Norström,T., 1989. The Use of Aggregate Data in Alcohol Epidemiology. Br. J. Addict., 84, 969-977.
Norström,T., 2006. Per capita alcohol consumption and sickness absence. Addiction, 101, 1421-1427.
Norström,T., Skog,O.J., 2001. Alcohol and mortality: methodological and analytical issues in aggregate analyses. Addiction, 96, S5-S17.
Pridemore,W.A., Chamlin,M.B., 2006. A time-series analysis of the impact of heavy drinking on homicide and suicide mortality in Russia, 1956-2002. Addiction, 101, 1719-1729.
Purshouse, R. C., Brennan, A., Latimer, N., Meng, Y., Rafia, R., Jackson, R., and et al 2009. Modelling to assess the effectiveness and cost-effectiveness of public health related strategies and interventions to reduce alcohol attributable harm in England using the Sheffield Alcohol Policy Model version 2.0: Report to the NICE Public Health Programme Development Group.
Ramstedt,M., 2003. Alcohol consumption and liver cirrhosis mortality with and without mention of alcohol - the case of Canada. Addiction, 98, 1267-1276.
Ramstedt,M., 2004. Alcohol and pancreatitis mortality at the population level: experiences from 14 western countries. Addiction, 99, 1255-1261.
Ramstedt,M., 2007. Population drinking and liver cirrhosis mortality: is there a link in eastern Europe? Addiction, 102, 1212-1223.
Razvodovsky,Y.E., 2007a. Homicide and alcohol intoxication in Russia, 1956-2005. Alcoholism (Zagreb), 43, 37-49.
Razvodovsky,Y.E., 2007b. Suicide and alcohol psychoses in Belarus 1970-2005. Crisis-the Journal of Crisis Intervention and Suicide Prevention, 28, 61-66.
Razvodovsky,Y.E., 2008a. Alcohol poisoning and diabetes mortality rate in Russia, 1956-2005. Alcoholism, 44, 19-28.
Razvodovsky,Y.E., 2008b. Homicide and alcohol psychoses in Belarus. Psychiatria Danubina, 20, 71-74.
Razvodovsky,Y.E., 2009a. Aggregate beverage specific effect of alcohol sale on myocardial infarction rate. Addiciones, 21, 229-238.
17
Razvodovsky,Y.E., 2009c. Beverage-Specific Alcohol Sale and Suicide in Russia. Crisis-the Journal of Crisis Intervention and Suicide Prevention, 30, 186-191.
Razvodovsky,Y.E., 2009d. Suicide and fatal alcohol poisoning in Russia, 1956-2005. Drugs Educ Prev Pol, 16, 127-139.
Razvodovsky,Y.E., 2010a. Beverage Specific Alcohol Sale and Cardiovascular Mortality in Russia. Alcohol Clin Exp Res, 34, 108A.
Razvodovsky,Y.E., 2010b. Beverage-specific alcohol sales and violent mortality in Russia. Adicciones, 22, 311-315.
Razvodovsky,Y.E., 2011. Alcohol consumption and Suicide in Belarus, 19802005. Suicidology Online, 2, 1-7.
Rehm,J., Gmel,G., 2001. Aggregate time-series regression in the field of alcohol. Addiction, 96, 945-954.
Rehm,J., Patra,J., Popova,S., 2007. Alcohol drinking cessation and its effect on esophageal and head and neck cancers: A pooled analysis. Int. J. Cancer, 121, 1132-1137.
Roizen,R., Kerr,W.C., Fillmore,K.M., 1999. Cirrhosis mortality and per capita consumption of distilled spirits, United States, 1949-94: trend analysis. Brit Med J., 319, 666-670A.
Schmidt,W., Popham,R.E., 1981. Alcohol-Consumption and Ischemic-Heart-Disease - Some Evidence from Population Studies. Br. J. Addict., 76, 407-417.
Skog,O.J., 1980. Liver-Cirrhosis Epidemiology - Some Methodological Problems. Br. J. Addict., 75, 227-243.
Skog,O.J., 1983. Methodological Problems in the Analysis of Temporal Covariation Between Alcohol-Consumption and Ischemic-Heart-Disease. Br. J. Addict., 78, 157-172.
Skog,O.J., 1984. The Risk-Function for Liver-Cirrhosis from Lifetime Alcohol-Consumption. J Stud Alcohol, 45, 199-208.
Skog,O.J., 1986. Trends in Alcohol-Consumption and Violent Deaths. Br. J. Addict., 81, 365-379.
Skog,O.J., 1987. Trends in Alcohol-Consumption and Deaths from Diseases. Br. J. Addict., 82, 1033-1041.
Skog,O.J., Elekes,Z., 1993. Alcohol and the 1950-90 Hungarian Suicide Trend - Is There A Causal Connection. Acta Sociol, 36, 33-46.
Skog,O.J., Melberg,H.O., 2006. Becker's rational addiction theory: an empirical test with price elasticities for distilled spirits in Denmark 1911-31. Addiction, 101, 1444-1450.
18
Stickley,A., Razvodovsky,Y.E., 2011. The effects of beverage type on homicide rates in Russia, 19702005. Drug Alcohol Rev, DOI: 10.1111/j.1465-3362.2011.00310.x, no.
Wagenaar,A.C., 1985. Alcohol-Consumption and the Incidence of Acute Alcohol-Related Problems. Br. J. Addict., 80, 173-180.
19 0
20 40 60 80 100
1 2 3 4 5 6 7 8 9 10
%
o
f
fu
ll
e
ff
e
ct
o
f
co
n
su
m
p
ti
o
n
c
h
a
n
g
e
Years since consumption change
Time to full effect
Time to first effect
Functional form of effect
[image:20.595.87.504.115.386.2](e.g. w=0.5t)
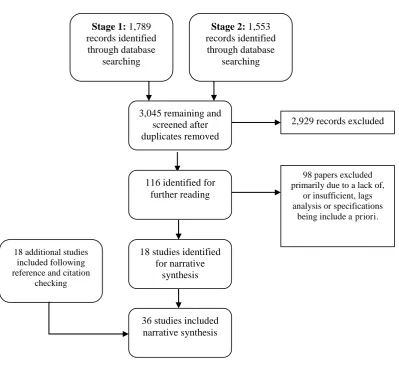
20 36 studies included
narrative synthesis 18 studies identified
for narrative synthesis
18 additional studies included following reference and citation
checking
116 identified for further reading
Stage 1: 1,789
records identified through database
searching
Stage 2: 1,553
records identified through database
searching
3,045 remaining and screened after duplicates removed
2,929 records excluded
98 papers excluded primarily due to a lack of,
or insufficient, lags analysis or specifications
[image:21.595.92.492.111.478.2]being include a priori.
21
Figure 3: Accumulation of effect as described by lag specifications in liver cirrhosis studies (where sufficient specifications were provided) 0
20 40 60 80 100
0 1 2 3 4 5 6 7 8 9 10
%
o
f
fu
ll
e
ff
e
ct
o
f
co
n
su
m
p
ti
o
n
c
h
a
n
g
e
Years since consumption change
Kerr et al 2000 (Significance testing) Norström 1987 (Norström/Skog)
Ramstedt 2007 (5 years) (Comp. of model fit) Ramstedt 2007 (10 years) (Comp. of model fit)
22
Figure 4: Accumulation of effect as described by the lag specifications in ischaemic heart disease studies (where sufficient specifications were provided)
0 20 40 60 80 100
0 1 2 3 4 5 6 7 8 9 10
%
o
f
fu
ll
e
ff
e
ct
o
f
co
n
su
m
p
ti
o
n
c
h
a
n
g
e
Years since consumption change
23
Figure 5: Accumulation of effect under different lag structures for a twenty year lag period
0 0.2 0.4 0.6 0.8 1
1 2 3 4 5 6 7 8 9 10 11 12 13 14 15 16 17 18 19 20
%
o
f
fu
ll
e
ff
e
ct
o
f
co
n
su
m
p
ti
o
n
c
h
a
n
g
e
Years since consumption change
24 Table 1: Approaches to selecting lag specifications
Method
Specifications
Time to first effect
Time to full
effect Functional form
Norström/Skog approach Derived1 Derived Derived
Significance testing of
lagged regression terms Derived Derived Implied 2
Comparison of effect size and model fit
Selected a
priori3 Derived Selected a priori
Cross-correlation of time
series Derived Derived Not specified
1
Derived specifications are those identified through analysis as part of the study. 2Implied specifications are those not directly derived but which are the result of selecting
other parameters.
3Selected a priori specifications are those not resulting from analysis within the study and
25
Table 2: Proposed time lag specifications for chronic alcohol-related health harms
Harm ICD10 code Time to
first effect
Time to full effect
Functional form
Alcohol-induced pseudo-Cushing's syndrome E24.4 Immediate 20 years Linear
Degeneration of the nervous system G31.2 Immediate 20 years Linear
Alcoholic polyneuropathy G62.1 Immediate 20 years Linear
Alcoholic myopathy G72.1 Immediate 20 years Linear
Alcoholic cardiomyopathy I42.6 Immediate 20 years Linear
Alcoholic gastritis K29.2 Immediate 10 years 0.5 geometric
Alcoholic liver disease K70 Immediate 20 years Norström1
Chronic pancreatitis K86.0 Immediate 20 years 0.8 geometric
Malignant neoplasm of lip, oral cavity and pharynx C00-C14 10 years 20 years Linear
Malignant neoplasm of oesophagus C15 10 years 20 years Linear
Malignant neoplasm of colon C18 10 years 20 years Linear
Malignant neoplasm of rectum C20 10 years 20 years Linear
Malignant neoplasm of liver and intrahepatic bile ducts C22 10 years 20 years Linear
Malignant neoplasm of larynx C32 10 years 20 years Linear
Malignant neoplasm of breast C50 10 years 20 years Linear
Diabetes mellitus (type II) E11 Immediate 10 years 0.8 geometric
Epilepsy and status epilepticus G40-G41 Immediate 5 years 0.6 geometric
Hypertensive diseases I10-I15 Immediate 10 years 0.8 geometric
Ischaemic heart disease I20-I25 Immediate 10 years 0.7 geometric
Cardiac arrhythmias I47-I48 Immediate 10 years 0.8 geometric
Haemorrhagic stroke I60-I62, I69.0-I69.2 Immediate 10 years 0.7 geometric
Ischaemic stroke I66, I69.3, I69.4 Immediate 10 years 0.7 geometric
Oesophageal varices I85 Immediate 20 years Norström1
Gastro-oesophageal laceration-haemorrhage syndrome K22.6 Immediate 5 years Linear
Unspecified liver cirrhosis K74, K74 Immediate 20 years 0.8 geometric
Cholelithiasis K80 Immediate 5 years Linear
Acute and chronic pancreatitis K85-K86.1 Immediate 20 years 0.8 geometric
Psoriasis L40 excludes L40.5 Immediate 10 years 0.5 geometric
Intentional self-harm X60-X84 Immediate 5 years 0.4 geometric
Tuberculosis A15-A19 Immediate 5 years 0.4 geometric
26 Appendix 1: Search strategy
1. Alcohol* OR drink* OR drunk* OR drank* OR liquor OR beer* OR wine* OR spirit* OR "malt beverage*" OR smok* OR cigar* OR tobacco NOT (radiat* OR mice OR rats OR pollut* OR hydro* OR MRSA OR staphylococcus OR pregnan*)
2. Alcohol* OR drink* OR drunk* OR drank* OR liquor OR beer* OR wine* OR spirit* OR "malt beverage*" OR smok* OR cigar* OR tobacco NOT (radiat* OR mice OR rats OR pollut* OR hydro* OR MRSA OR staphylococcus) AND (Miscarri* OR abort*) 3. #1 OR #2
4. Lag w/3 struct* OR delay w/3 effect* OR time w/3 lag* OR distribut* w/3 lag* OR laten* w/3 period* OR latent* w/3 effect*
5. Declin* w/3 effect* OR “time-limited” w/3 effect* OR decay* w/3 effect* OR tempor* w/3 effect* OR sustain* w/3 effect* OR perman* w/3 effect* OR ARIMA OR ARMA
6. “long* term” w/3 effect* OR “short* term” w/3 effect* OR full w/3 effect* OR contemporaneous w/3 effect* OR immediate w/3 effect*
7. #3 AND #4
8. #3 AND #5
Appendix 1: Data extraction table
Study Location and
period
Modelling technique Consumption, harm and control measures
Derivation method
Time to first effect Number of lagged years to full effect
Lag structure
Cirrhosis mortality papers
Corrao, 1998 Eastern Europe: Bulgaria, Hungary, Poland, Romania, former
Czechoslovakia, Yugoslavia, East Germany. Europe as a whole 1970-89 Age-period-cohort analysis with regression to establish latency periods
Moving average of per capita alcohol consumption for population aged 15+ Standardised cirrhosis mortality rate Comparison of model fit
E. Europe: 5 years Rest of Europe: Immediate
Method cannot estimate Method cannot estimate
Corrao, 1997 22 European countries, grouped into northern, eastern, southern and western Europe 1961-89
Pooled time series using Poisson regression
Per capita alcohol consumption for population aged 15+ Cirrhosis mortality rate Comparison of model fit
N. Europe: 1 year E. Europe: 6 years S. Europe: 2 years W. Europe: Immediate
Method cannot estimate Method cannot estimate
Kerr et al., 2000 Australia, Canada, New Zealand, UK, USA
1953-93
Pooled time series using generalised estimating equations
Per capita alcohol consumption (total and beverage-specific) Standardised cirrhosis mortality rate for population aged 15+
Significance testing of lagged regression terms
Immediate One year Not specified
Norström, 1987 Sweden 1931-80
ARIMA Per capita alcohol consumption Male liver cirrhosis mortality
Norström/Skog approach
period harm and control measures
method effect
Ramstedt 2007 Eastern Europe: Belarus, Poland, Russia, Ukraine, Bulgaria, former Czechoslovakia, Hungary, Romania, former Yugoslavia Be: 1970-2003 Po: 1959-97 Ru: 1959-98 UK: 1965-2000 Bu: 1961-2003 Cz: 1950-91 Hu: 1950-2002 Ro: 1962-2002 Yu: 1961-90
Pooled time series using ARIMA
Per capita alcohol consumption (with adjustments for under-recording) Standardised total cirrhosis mortality rate for population aged 15+
Comparison of model fit
Immediate Tested: Zero years:
Total effect of 1L increase in consumption = 3.5% increase in cirrhosis
Five years: Total effect of 1L increase in consumption = 9.1% increase in cirrhosis
Ten years:
Total effect of 1L increase in consumption = 7.8% increase in cirrhosis
See Norström, 1987 (specified a priori)
Roizen et al. 1999 USA 1949-94
ARIMA Per capita alcohol consumption (total and beverage specific) Standardised total cirrhosis mortality rate for population aged 15+ Controls: ICD changes
Significance testing of lagged regression terms
Immediate Two years Not specified
Skog, 1984 UK 1902-75
ARIMA Per capita alcohol consumption Live cirrhosis mortality
Norström/Skog approach
period harm and control measures
method effect
Ye & Kerr, 2011 47 USA states (missing Alaska, Hawaii, Mississippi, Oklahoma) 1950-2002
Pooled time series using ARIMA, generalised estimating equations, generalised linear models, fixed effects models and multi-level modelling
Per capita alcohol consumption (total and beverage-specific) Standardised cirrhosis mortality rate Comparison of effect size/model fit
Immediate Tested: Five years:
Total effect of 1L increase in consumption = 8% increase in cirrhosis
Zero years:
Total effect of 1L increase in consumption = 5% increase in cirrhosis
See Norström, 1987 (specified a priori)
Heart disease mortality papers
Hemström, 2001 15 European countries 1950-95 (Spain: 1962-94)
ARIMA Per capita alcohol sales for population aged 14+
(beers and spirits data missing 1960-4) Standardised IHD mortality rate Controls: ICD changes; per capita cigarette consumption (lagged); outliers Comparison of effect size/model fit
Immediate Tested:
Six years and Zero years Insufficient reporting to provide comparison.
0.8 geometric (specified a priori)
Kerr & Ye, 2007 USA 1955-2002
ARIMA and Vector Error Correlation models
Per capita alcohol consumption (total beverage-specific) Standardised IHD mortality rate for population 15+ Controls: Per capita cigarette
consumption; cirrhosis mortality rate; per capita sugar sweetened soft drink consumption; ICD changes
Study Location and period
Modelling technique Consumption, harm and control measures
Derivation method
Time to first effect Number of lagged years to full effect
Lag structure
Kerr et al., 2011 USA (national and state-level) 1950-2002
Pooled times series using ARIMA Panel models using generalised least square models
Per capita alcohol consumption (total and beverage-specific) Standardised IHD mortality rate Controls: per capita tobacco
consumption; standardised cirrhosis mortality rate; ICD changes
Comparison of effect size/model fit
Immediate Five years 0.7 geometric (specified a priori)
LaPorte et al., 1980 USA 1950-75
Correlational Beverage-specific consumption Age-adjusted ASHD mortality rates Controls: Cigarette consumption; Fat consumption Cross-correlation of undifferenced time series Immediate (beer) Effect not significance (other beverages)
Five years (beer)
Effect not significant (other beverages)
Method cannot estimate
Razvodovsky 2009a Belarus 1970-2005
ARIMA Total alcohol sales (total and vodka) Myocardial infarction mortality rate
Controls: Per capita cigarette sales
Cross-correlation of differenced time series
Immediate Zero years No time lag
Razvodovsky, 2010a
Russia 1970-2005
ARIMA Per capita alcohol sales (total and beverage-specific) Age-adjusted, sex-specific cardiovascular mortality rate Cross-correlation of differenced time series
Study Location and period
Modelling technique Consumption, harm and control measures
Derivation method
Time to first effect Number of lagged years to full effect
Lag structure
Schmidt & Popham, 1981 19 developed countries 1950-77 Time series correlation
Per capita alcohol consumption IHD mortality rate
Cross-correlation of undifferenced time series
Immediate to 2 years lag Method cannot estimate Method cannot estimate
Skog, 1983 Norway
1951-80
ARIMA Per capita alcohol sales (15+) Ischemic heart disease mortality Controls: Intervention model of unreliable data for 1978
Cross-correlation of differenced time series
Immediate Zero years No time lag
Suicide papers
Mäkelä, 1996 Finland 1950-91
ARIMA Per capita alcohol sales (15+) Age-specific male suicide rate (15+) Controls: Marriage, Divorces, Unemployment
Significance testing of lagged regression terms
Immediate One year Not specified
Pridemore & Chamlin, 2006
Russia 1956-2002
ARIMA Sex-specific combined alcohol psychosis, cirrhosis and poisoning and chronic alcoholism rates per 100,000 Age-standardised sex-specific homicide mortality rate per 100,000; Age-standardised sex-specific suicide rate per 100,000
Cross-correlation of differenced time series
Study Location and period
Modelling technique Consumption, harm and control measures
Derivation method
Time to first effect Number of lagged years to full effect Lag structure Razvodovsky, 2007b Belarus 1970-2005
ARIMA Alcohol psychoses rate
Suicide rate
Cross-correlation of differenced time series
Immediate Zero years No time lag
Razvodovsky, 2009c
Russia 1970-2005
ARIMA Alcohol sales per capita (total and beverage-specific) Age-adjusted, sex-specific suicide rate
Cross-correlation of differenced time series
Immediate One year Not specified
Razvodovsky, 2009d
Russia 1956-2005
ARIMA Age-adjusted, sex-specific alcohol poisoning mortality rate
Age-adjusted, sex-specific suicide rate
Cross-correlation of differenced time series
Immediate Zero years No time lag
Razvodovsky 2010b Russia 1980-2005
ARIMA Per capita alcohol sales (total and beverage-specific) Violent mortality rate plus individual mortality rates for each of alcohol poisoning, homicide, suicide and accidents or injury
Cross-correlation of differenced time series
Immediate Zero years:
Homicide, fatal alcohol poisoning (total alcohol); violent mortality, accidents/injuries, suicide, fatal alcohol poisoning (vodka) One year:
Violent mortality,
accidents/injuries, suicide (total alcohol); homicide (vodka)
period harm and control measures
method effect
Razvodovsky, 2011 Belarus 1980-2005
ARIMA Per capita alcohol consumption Total, BAC positive and BAC negative suicide mortality rate per 100,000
Cross-correlation of differenced time series
Immediate Total suicide rate: Zero years BAC positive suicide rate: One year BAC negative suicide rate:: no relationship
Not specified
Skog & Elekes,1993 Hungary 1950-90
ARIMA
Granger’s causal test
Per capita alcohol consumption (total population Suicide rate per 100,000 (total population)
Significance testing of lagged regression terms extended with Koyck models
Immediate Two years 33% of effect in first year
45% of effect at one year lag
Stickley et al. 2011 Russia 1870-94 1956-2005
ARIMA Alcohol consumption per capita (Tsarist only); Alcohol poisoning mortality rates per 100,000 Suicide rate per 100,000 Alcohol poisoning mortality rates per 100,000 (Tsarist only)
Cross-correlation of differenced time series
Immediate Suicide: Zero years Alcohol poisoning: One year
Not specified
Homicide and other violent mortality papers
Razvodovsky, 2007a
Russia 1956-2005
ARIMA Alcohol poisoning mortality rates Age-adjusted, sex-specific homicide rates Cross-correlation of differenced time series
Immediate Zero years No time lag
Razvodovsky, 2008b
Belarus 1970-2005
ARIMA Alcohol psychoses mortality rate Homicide rate
Cross-correlation of differenced time series
Immediate Zero years No time lag
measures
Razvodovsky 2010b Russia 1980-2005
ARIMA Per capita alcohol sales (total and beverage-specific) Violent mortality rate plus individual mortality rates for each of alcohol poisoning, homicide, suicide and accidents or injury
Cross-correlation of differenced time series
Immediate Zero years: Homicide, fatal alcohol poisoning (total alcohol); violent mortality, accidents/injuries, suicide, fatal alcohol poisoning (vodka).
One year: Violent mortality,
accidents/injuries, suicide (total alcohol); homicide (vodka)
Not specified
Skog, 1986 Norway 1930-80
ARIMA Per capita consumption (15+) Violent deaths mortality rate
Cross-correlation of differenced time series
Immediate Zero years No time lag
Stickley & Razvodovsky, 2011
Russia 1970-2005
ARIMA Per capita alcohol consumption (Total and beverage specific) Age-adjusted, sex-specific homicide rates per 100,000
Cross-correlation of differenced time series
Immediate Zero years (total alcohol) One year (vodka)
period harm and control measures
method effect
Miscellaneous papers
Norström, 2006 Sweden 1936-2002
ARIMA Per capita alcohol sales for population aged 15+
Sickness absence rate per insured person Sickness absence according to Labour Force Survey Controls: percentage of workforce unemployed, real wages, changes in recording practices of sickness absence rate
No derivation – derivation of lag structure attempted but results were largely insignificant, inconsistent or implausible
Immediate Five years 0.7 geometric
Ramstedt, 2004 14 western countries: Finland, Norway, Sweden, Austria, Belgium, Denmark,
Netherlands, Ireland, UK, West Germany, France, Italy, Spain, Canada, with grouping for northern, mid- and southern Europe 1950-95
Pooled time series ARIMA
Per capita alcohol sales for population aged 15+
Age-adjusted acute, chronic and combined
pancreatitis mortality rates for population aged 15+ Controls: ICD changes Comparison of effect size/model fit
Immediate Tested: Five years:
1L increase in consumption = 25% increase in pancreatitis
Zero years:
1L increase in consumption = 15% increase in pancreatitis
See Norström 1987 (specified a priori)
Razvodovsky, 2008a
Russia 1956-2005
ARIMA Age adjusted sex-specific alcohol poisoning mortality rate Age-adjusted, sex-specific diabetes mortality rate Cross-correlation of differenced time series
period and control measures
method effect
Skog, 1987 Norway 1930-80
ARIMA Per capita consumption (15+) Alcohol-related disease mortality (Liver cirrhosis, alcoholic psychoses, alcoholism, pancreatitis, cancers of the upper digestive tract and pancreas)
Unspecified Immediate Approximately 80 years wi = 0.1 * ∑ (0.9i * Alc t-i) + 0.5i * ∑ (0.5I * AlcT-I)
Skog & Melberg, 2006
Denmark 1911-31
ARIMA/Rational addiction
Beverage specific per capita sales Delirium tremens GNP (income proxy)
Cross-correlation of differenced time series
Immediate 1 year 65% in first year (spirits)
No time lag (beer) Wagenaar, 1984 Michagan, USA
1972-80
ARIMA Total wholesale beverage-specific alcohol sales Total of officer-reported drinking driver incidents involving property damage or injury-producing motor vehicle crashes
Cross-correlation of differenced time series
Immediate (beer) 1 month (wine)
5 months:
Property damage (beer) 1 month:
Injury (beer); property damage, injury (wine)