ArdA protein affect dimerization and antimodification activity but not antirestriction activity
.
White Rose Research Online URL for this paper:
http://eprints.whiterose.ac.uk/76847/
Article:
Roberts, GA, Chen, K, Bower, EKM et al. (8 more authors) (2013) Mutations of the domain
forming the dimeric interface of the ArdA protein affect dimerization and antimodification
activity but not antirestriction activity. The Federation of European Biochemical Societies
(FEBS) Journal (280). 4903 - 4914. ISSN 1742-464X
https://doi.org/10.1111/febs.12467
[email protected] https://eprints.whiterose.ac.uk/
Reuse
Unless indicated otherwise, fulltext items are protected by copyright with all rights reserved. The copyright exception in section 29 of the Copyright, Designs and Patents Act 1988 allows the making of a single copy solely for the purpose of non-commercial research or private study within the limits of fair dealing. The publisher or other rights-holder may allow further reproduction and re-use of this version - refer to the White Rose Research Online record for this item. Where records identify the publisher as the copyright holder, users can verify any specific terms of use on the publisher’s website.
Takedown
If you consider content in White Rose Research Online to be in breach of UK law, please notify us by
the ArdA protein affect dimerization and antimodification
activity but not antirestriction activity
Gareth A. Roberts1,*, Kai Chen1,*, Edward K. M. Bower1, Julia Madrzak1,†, Arcadia Woods1,‡, Amy M. Barker2, Laurie P. Cooper1, John H. White1, Garry W. Blakely3, Iain Manfield2and David T. F. Dryden1,*
1 EaStCHEM School of Chemistry, University of Edinburgh, UK
2 Centre for Biomolecular Interactions, Astbury Centre for Structural Molecular Biology, Faculty of Biological Sciences, University of Leeds, UK
3 Institute of Cell Biology, School of Biological Sciences, University of Edinburgh, UK
Keywords
antirestriction; ArdA; horizontal gene transfer; restriction enzyme; Tn916
Correspondence
D. Dryden, EaStCHEM School of Chemistry, University of Edinburgh, The King’s Buildings, Edinburgh EH9 3JJ, UK Fax: +44 131 650 6453
Tel: +44 131 650 4735 E-mail: [email protected]
†Present address
Medical Research Council Laboratory of Molecular Biology, Hills Road, Cambridge, CB2 0QH, UK
‡Present address
Institute of Pharmaceutical Science, King’s College London, 150 Stamford Street, London, SE1 9NH, UK
*Joint first authors.
(Received 30 January 2013, revised 26 July 2013, accepted 29 July 2013)
doi:10.1111/febs.12467
ArdA antirestriction proteins are encoded by genes present in many conju-gative plasmids and transposons within bacterial genomes. Antirestriction is the ability to prevent cleavage of foreign incoming DNA by restriction-modification (RM) systems. Antirestriction-modification, the ability to inhibit modifi-cation by the RM system, can also be observed with some antirestriction proteins. As these mobile genetic elements can transfer antibiotic resistance genes, the ArdA proteins assist their spread. The consequence of antire-striction is therefore the enhanced dissemination of mobile genetic ele-ments. ArdA proteins cause antirestriction by mimicking the DNA structure bound by Type I RM enzymes. The crystal structure of ArdA showed it to be a dimeric protein with a highly elongated curved cylindrical shape [McMahon SA et al.(2009)Nucleic Acids Res 37, 4887–4897]. Each monomer has three domains covered with negatively charged side chains and a very small interface with the other monomer. We investigated the role of the domain forming the dimer interface for ArdA activity via site-directed mutagenesis. The antirestriction activity of ArdA was maintained when up to seven mutations per monomer were made or the interface was disrupted such that the protein could only exist as a monomer. The anti-modification activity of ArdA was lost upon mutation of this domain. The ability of the monomeric form of ArdA to function in antirestriction sug-gests, first, that it can bind independently to the restriction subunit or the modification subunits of the RM enzyme, and second, that the many ArdA homologues with long amino acid extensions, present in sequence databases, may be active in antirestriction.
Structured digital abstract
ArdAandArdAbind by molecular sieving (1, 2) ArdAandArdAbind by cosedimentation in solution (1, 2)
Abbreviations
2-ME, 2-mercaptoethanol; anti-RM, antirestriction and antimodification; AUC, analytical ultracentrifugation;f/fo, frictional ratio; HGT, horizontal gene transfer; HsdM, methyltransferase subunit; HsdR, restriction subunit; HsdS, DNA sequence specificity subunit. MTase, methyltransferase; RM, restriction-modification; SEC, size exclusion chromatography; TCEP, tris(2-carboxyethyl)phosphine. TRD, target recognition domain; WT, wild-type.
Introduction
The majority of eubacteria contain the genes for active or putative DNA restriction-modification (RM) sys-tems [1–3]. It is clear that their function is to protect the host cell from invasion by foreign DNA by recog-nising specific DNA sequences and triggering an endo-nuclease activity that rapidly cleaves the foreign DNA. The host DNA sequences are maintained in a methy-lated state by the modification methytransferase (MTase) function.
Despite the demonstrated efficacy of the RM sys-tems, genome analysis of pathogenic bacteria from both clinical and environmental settings makes it abundantly clear that horizontal gene transfer (HGT) by transformation, transduction or conjugation is com-mon within species and even between species. HGT is directly responsible for the spread of antibiotic tance genes [4]. In fact, the spread of antibiotic resis-tance and the resultant selective pressure caused by the continual use of antibiotics is a serious and almost unstoppable phenomenon [5–8]. It is therefore impor-tant for understanding and tackling antibiotic resis-tance to ascertain the mechanism by which HGT circumvents such an apparently effective RM defence. The identification of potential antirestriction and anti-modification (anti-RM) genes within the mobile ele-ments [9,10] suggests a mechanism by which the mobile elements can overcome the RM systems. These anti-RM systems have occasionally been acquired and maintained by the host organism, and the occasional activation of such genes weakens or negates the RM defence system, allowing further HGT [11,12].
The first plasmid-borne antirestriction system identi-fied was encoded by the ardA locus of the ColIbP-9 enterobacterial plasmids [13]. Conserved ardA genes have subsequently been identified in representatives of other plasmid incompatibility groups [10,13–16], other bacterial genomes [17], and ORF18 of the Tn916 con-jugative transposon fromStreptococcus faecalis[17].
The structure of ORF18 ArdA from Tn916reveals a highly elongated dimeric protein with a surface deco-rated with negative charges in such a way that it mim-ics the shape and charge distribution of ~42 bp of DNA [18]. Thus, ArdA is a DNA mimic anti-RM pro-tein similar to the Ocr DNA mimic anti-RM propro-tein encoded by bacteriophage T7 [19,20], although their secondary structures are very different. ArdA mono-mers are further divided into three small domains com-posed of amino acids 1–61, 62–103, and 104–165, with the third domain in each monomer forming the dimer interface. The negative charges on the surface of ArdA are spread over all three domains. ORF18 ArdA
appears to be able to dissociate into monomers at low concentrations in buffer solution [17], raising the possi-bility that the monomer form may be active in addi-tion to the dimer form. It may even be the case that one form targets the modification activity and the other form targets the restriction activity of the RM system, as some ArdA proteins show differential effects on restriction and modification, depending on the level of expressionin vivo[16,21–25].
The Type I RM systems are the targets for ArdA, and are widespread in nature [26]. Moreover, Type I RM systems play a clear role in HGT, as exemplified by the fact that they are used to define clinical strains of Staphylococcus aureus [5,27]. Type I RM enzymes [2] are complex hetero-oligomers of two restriction subunits (HsdRs), two methyltransferase subunits (HsdMs), and one DNA sequence specificity subunit (HsdS) (total molecular mass of ~440 kDa). Depend-ing on the methylation status of the DNA substrate, this complex functions as either a restriction endonu-clease or an MTase. These enzymes recognise an
asym-metric, bipartite sequence (for example, EcoKI
recognises AACNNNNNNGTGC), and require ATP to affect cleavage at a distant site reached via extensive DNA translocation. Two HsdMs and one HsdS form an active MTase in the absence of HsdR [28,29]. Many genomes contain multiple Type I RM systems [3], and some have the ability to switch between multiple DNA specificities [30]. Type I RM systems are extensively represented within clinical strain collections such as the Escherichia coli ECOR collection [26], and can be grouped into families, defined by subunit complemen-tation for example, in which HsdR and HsdM are
highly conserved [31,32]. HsdS sequences show
extreme variability in two~150-residue regions. These regions are called target recognition domains (TRDs). The N-terminal TRD recognises the first part of the bipartite sequence, and the C-terminal TRD recognises the second part. TRDs can be swapped within a family to generate predictable changes in the enzyme specific-ity.
antirestriction activity. These data indicate that antire-striction activity resides in domains 1 and 2 of ArdA, and that antimodification activity resides in domain 3.
Results
Location of amino acid substitutions on the dimer of ORF18 ArdA
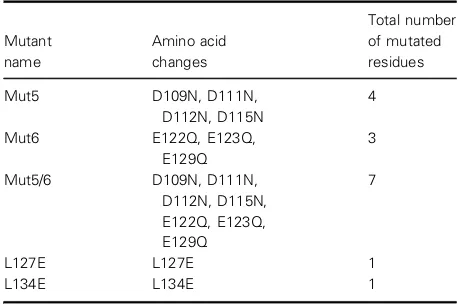
The negatively charged amino acids selected for muta-genesis are shown in Table 1, and were created by the mutagenesis primers Table S1, with plasmid pORF18wt (Fig. S1) as a template. In addition, two leucines (Leu127 or Leu134) at the dimer interface in the crys-tal structure were individually mutated to glutamate, with the idea that the introduction of a negative charge would prevent formation of the hydrophobic dimer interface. The model of ArdA bound to the EcoKI MTase suggests that these amino acid substitu-tions occur at posisubstitu-tions equivalent to the region of DNA recognised by the S subunit of the RM enzyme (Fig. 1). The physical effects of these mutations on the protein structure were first analysed in vitro, to deter-mine whether the substitutions had disrupted the inter-face to form the desired monomeric forms of ArdA or led to other structural changes. Subsequently, in vivo
activity tests were performed to determine whether anti-RM activity was affected.
Characterization of ArdA mutant proteinsin vitro
Overexpression of the mutant proteins by using mutated forms of plasmid pORF18wt (Fig. S2) was only observed for the Mut5, Mut6 and L127E ArdA proteins, as well as wild-type (WT) ArdA. The other mutant proteins, Mut5/6 and L134E, could not be observed in cell extracts, and nor were either of these
proteins observed after fractionation of the cell extracts via ion exchange chromatography (no band of an appropriate size was visible on an SDS/PAGE gel; data not shown). Thus, in vitro characterization was confined to Mut5, Mut6 or L127E ArdA. Cells bouring the various constructs were grown and har-vested, and the recombinant proteins were purified to near homogeneity as described previously for WT ORF18 ArdA [17]. Figure S2a shows the protein frac-tions eluting from the anion exchange (DEAE) column prior to further purification by preparative size exclu-sion chromatography (SEC).
The folding and unfolding curves measured by tryp-tophan fluorescence were essentially identical for WT ORF18 ArdA [17], and Mut5, Mut6, and L127E ArdA (Fig. S2b). The midpoints of the unfolding transitions
were 2.20 0.14M guanidine hydrochloride [24],
2.390.46M guanidine hydrochloride, 2.440.08M
guanidine hydrochloride, and 2.130.13M guanidine
hydrochloride, respectively. The free energies of stabilization were 20.03.3 kJmol 1 [17], 15.4
3.4 kJmol 1, 21.14.7 kJmol 1, and 20.84.1 kJmol 1 respectively. The transition slopes divided by
RT(ideal gas constant multiplied by temperature) were
1.970.33, 1.90 0.47, 3.67 0.77, and 2.03
0.42, respectively. The transition slopes are related to the change in exposed surface area as the protein unfolds. This similarity in stability was expected, as the tryptophans are not located near to the dimer interface, and would only be sensitive to changes in tertiary structure rather than in quaternary structure. CD spectroscopy was used to establish the secondary structure content of all of the purified proteins, and LC-MS was used to determine the exact molecular mass of the Mut5 and Mut6 monomers (Figs S3 and S4). These data suggest that the polypeptide fold was not greatly compromised by the amino acid substitu-tions.
Analytical SEC of ArdA
[image:4.595.52.281.546.698.2]It has previously been observed that the apparent molecular mass of WT ORF18 ArdA changes as its concentration changes [17]. At high concentration, WT ORF18 ArdA eluted from a SEC column at an appar-ent molecular mass of>100 kDa, and at low concen-tration it eluted with an apparent molecular mass of ~40 kDa (Figs 2 and S5). As the crystal structure [18] showed a dimeric protein, it was assumed that the pro-tein was a dimer of mass 38 kDa at high concentration and a monomer of mass 19 kDa at low concentration, despite the fact that the SEC gave apparent molecular masses far different from these expected values. The Table 1. Amino acid substitutions created in domain 3 of WT
ORF18 ArdA.
Mutant name
Amino acid changes
Total number of mutated residues
Mut5 D109N, D111N,
D112N, D115N
4
Mut6 E122Q, E123Q,
E129Q
3
Mut5/6 D109N, D111N,
D112N, D115N, E122Q, E123Q, E129Q
7
L127E L127E 1
discrepancy between observed and expected molecular mass was attributed to the highly elongated shape of the protein, which would give it an unusually large hydrodynamic radius. With this assumption, the data were previously modelled as a monomer–dimer
equilib-rium with a dissociation constant of 1.30.3 lM[17],
although this calculation used the concentration of the injected sample rather than the concentration on the column, which will be lower because of dilution during the chromatography.
Mut5, Mut6 and L127E ArdA were also analysed by SEC. Figure 2 (and Figs S5c and S5e) shows that Mut5 and L127E ArdA eluted with an apparent molecular mass of ~40 kDa at all concentrations below 100lM. Above 100lm, the apparent molecular
mass of L127E ArdA started to increase. The concen-trations of the proteins are the concenconcen-trations of the injected 40-L samples, and the actual concentration of the samples as they move through the column will be somewhat smaller, owing to sample dilution. If the monomer–dimer equilibrium model for ArdA is cor-rect, then it would appear that Mut5 and L127E ArdA are monomers at most concentrations. Mut6 ArdA behaved in the same manner as WT ORF18 ArdA, showing a decrease in apparent molecular mass as con-centration decreased (Figs 2 and S5d).
In order to investigate the discrepancy between the observed and expected molecular masses, an absolute measure of molecular mass was sought for WT ORF18 ArdA and L127E ArdA, by the use of analyti-cal ultracentrifugation (AUC). Such measurements would serve to explain the anomalous molecular masses observed with SEC.
Sedimentation equilibrium AUC of ArdA
Sedimentation equilibrium measurements can give an absolute value for molecular mass. Three different
A
B
[image:5.595.71.295.67.493.2]C
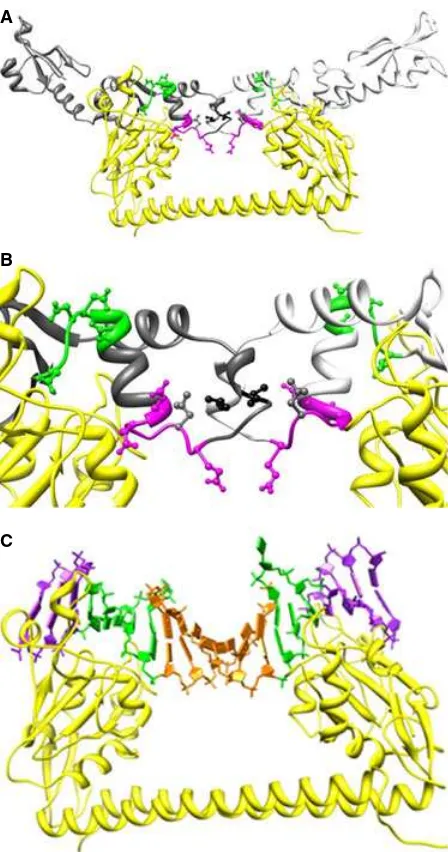
Fig. 1.Structural models of the S subunit (yellow ribbon) of EcoKI bound to WT ORF18 ArdA (Protein Data Bank: 2W82) and the DNA target sequence. (A) ArdA chains are shown as grey and white ribbons, with Mut5 and Mut6 regions shown in green and magenta respectively. Sites of amino acid substitution within these regions are shown in a ball and stick representation in green (Mut5), magenta (Mut6), and grey (L127E), respectively. Leu134 is shown in black ball and stick form. (B) An expanded view of the ArdA dimer interface coloured as in (A). (C) The DNA bases are coloured in purple for sequence outside the DNA target sequence, green for the defined bases in the target sequence, and orange for the central undefined bases in the target sequence.
140
120
100
80
60
40
Apparent molecular mass (kDa)
20
1
Concentration (µM)
[image:5.595.315.542.70.248.2]10 100
Fig. 2.SEC analysis to investigate the solution apparent molecular mass as a function of protein monomer concentration injected onto the column. ●, WT ORF18 ArdA;○, L127E ArdA;□, Mut5 ArdA;
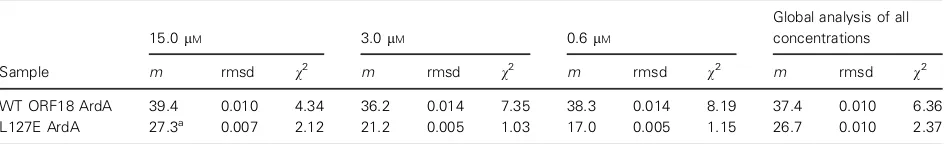
sample concentrations of WT ArdA or L127E ArdA were analysed individually, to give an idea of their behaviour in solution (Fig. 3A,B). Initially, all samples were modelled as single species (Table 2). The whole cell weight average molecular mass of WT ORF18 ArdA was not observed to change over the concentra-tion range studied (0.6–15lM), and had an average of
37.4 kDa, indicating that WT ORF18 ArdA exists as
a dimer (Fig. 3A). The detection limits on the AUC instrument precluded measurements of the dissociation of WT ORF18 ArdA at very low concentrations. A global analysis for WT ORF18 ArdA was also per-formed, assuming the same molecular mass at all three concentrations, to confirm that a single average molec-ular mass was appropriate. Individual analyses for L127E ArdA showed that the molecular mass changed
A
C
B
3.0
2.5
2.0
1.5
c
(
s
)
1.0
0.5
0.0
0
Sedimentation Coefficient (Svedbergs)
2 4 6 8 10 12 14
17 000 r.p.m. 27 000 r.p.m. 35 000 r.p.m. 17 000 r.p.m. 27 000 r.p.m. 35 000 r.p.m.
[image:6.595.56.523.173.609.2]17 000 r.p.m. 27 000 r.p.m. 35 000 r.p.m. 17 000 r.p.m. 27 000 r.p.m. 35 000 r.p.m.
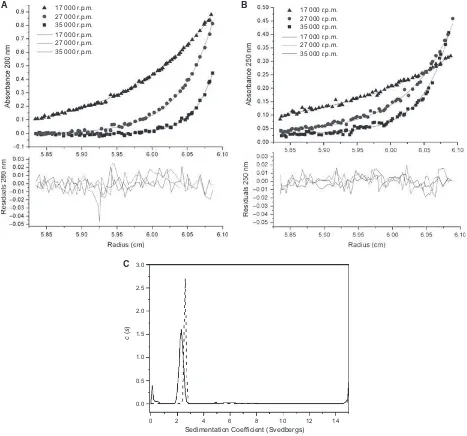
Fig. 3.AUC of WT ORF18 ArdA and L127E ArdA. (A) SEDPHAT sedimentation equilibrium data analysis of WT ORF18 ArdA at 15lM at 17 000 r.p.m., 27 000 r.p.m., and 35 000 r.p.m. , with detection at 280 nm. The samples had reached equilibrium at each rotor speed, as the rmsd between scans was below0.01 absorbance units (typical noise level in the centrifuge). The fitted line and residuals are for a single-species fit. (B) SEDPHAT sedimentation equilibrium data analysis of L127E ArdA at 15lM at 17 000 r.p.m., 27 000 r.p.m., and 35 000 r.p.m., with detection at 280 nm. The samples had reached equilibrium at each rotor speed, as the rmsd between scans was below
with respect to concentration and that the global anal-ysis was inappropriate (Table 2). At low concentra-tions, the molecular mass was between 21.2 and 17.0 kDa, indicating that it is a monomer in solution at these concentrations (Table 2). However, L127E ArdA at 15lM was modelled as two species, and the
fit was improved (Table 2; Fig. 3B). The two species in this fit had molecular masses of 39.1 and 20.3 kDa, suggesting that, at 15lM, L127E ArdA is in rapid
exchange between monomeric and dimeric forms. The presence of monomers and dimers at high concentra-tion is consistent with the increase in the apparent molecular mass for L127E ArdA observed in the SEC experiment at high concentrations (Fig. 2). The 15lM
data were also modelled as a monomer–dimer equilib-rium withSEDPHAT[33], fixing the monomer molecular
mass of 19.1 kDa. This gave a dissociation constant of 10lM, but carried a high rmsd of 0.01 (a good fit has
0.001) and largely reduced v2 value of 7.9 (a good fit has a value of 1), suggesting a poorer fit than the two-species fit, which had av2of 1.95.
The discrepancy in the concentration range between the SEC and the AUC experiments in which the two proteins show monomeric–dimeric behaviour can be explained by the fact that the SEC column dilutes the protein by approximately five-fold to 10-fold but we have reported the injected SEC protein concentration and calculated the apparent dissociation constant for the proteins by using the injected concentration. As the SEC detection was performed with tryptophan flu-orescence emission, there is no reliable method to determine the dilution factor.
Sedimentation velocity AUC of ORF18 ArdA and L127E ArdA
The samples for sedimentation velocity AUC had con-centrations of 33.9lM and 36.9lM, so WT ORF18
ArdA should be primarily in the large molecular mass form and L127E ArdA in both the monomeric and
dimeric forms, as judged from the SEC data shown in Fig. 2 and the sedimentation equilibrium results. Absorbance scans before and after a low-speed centri-fugation step were identical, indicating the absence of high molecular mass aggregates. Preliminary bance scans of the samples indicated that the absor-bance at 280 nm would be outside of the linear range of the detector, but that 260 nm would give an accept-able signal.
Analysis of the radial absorbance scans (Fig. S6) used continuous c(s) distribution analysis to show the distribution of sedimentation coefficients in the sam-ples (Fig. 3C). For the major species present in each sample, calculated molecular masses and proportions are summarized in Table 3. The major species (89%) for WT ORF18 ArdA had a sedimentation coefficient,
so20,w, of 2.6 S, and the major species (78%) for
L127E ArdA had an so20,w of 2.3 S. Other minor
spe-cies contributed to the remaining signal, particularly for L127E ArdA. These small amounts of material hads-values between 15 S and 50 S in thec(s) analysis (data not shown). L127E ArdA showed a lower sedi-mentation coefficient than WT ORF18 ArdA and a slightly broadened peak. The lower sedimentation coefficient could be attributable to increased asymme-try, unfolded protein conformations, a change in pro-tein hydration, or a different multimeric state. The broadened peak could arise from equilibrium between a monomeric L127E ArdA and a dimeric form. Assuming that a different multimeric state is the source of the difference in sedimentation coefficient
between WT ORF18 ArdA and L127E ArdA, SEDFIT
[34] designated apparent molecular masses for the two species as 32.6 kDa for WT ORF18 ArdA and 15.1 kDa for L127E ArdA. The f/fo determined from
data analysis was also examined.
The frictional ratio (f/fo) is given in Table 3. This is
[image:7.595.70.543.93.165.2]a parameter describing the asymmetry of the molecules sedimenting in solution. A spherical unhydrated mole-cule will have an f/fo of 1.0, whereas values in the
Table 2.Sedimentation equilibrium analytical ultracentrifugation analysis for determination of molecular mass (m) in kDa. Rmsd and reduced v2are given.
Sample
15.0lM 3.0lM 0.6lM
Global analysis of all concentrations
m rmsd v2 m rmsd v2 m rmsd v2 m rmsd v2
WT ORF18 ArdA 39.4 0.010 4.34 36.2 0.014 7.35 38.3 0.014 8.19 37.4 0.010 6.36
L127E ArdA 27.3a 0.007 2.12 21.2 0.005 1.03 17.0 0.005 1.15 26.7 0.010 2.37
aThe value given is for analysis assuming a single species. However, at the highest concentration, the data fitted best to two species in
range 1.1–1.3 are expected for hydrated, globular pro-teins [35]. Thisf/fo analysis suggests that WT ORF18
ArdA with anf/foof 1.50 is very asymmetric, as would
be expected from the crystal structure. Assuming a hydration level of ~30% for the proteins, the experi-mental f/fo for WT ORF18 ArdA gives an axial ratio
of~7 if modelled as a prolate ellipsoid [35].
The data indicate that L127E ORF18 ArdA has an
f/fo of 1.08 (Table 3), which would correspond to an
almost globular protein if there were only a single spe-cies present in solution. The crystal structure of ArdA indicates that a monomer of ArdA should have an axial ratio of ~3.5 if modelled as a prolate ellipsoid, and an f/fo of ~1.25. The observed f/fo for L127E
ArdA was lower than expected, but this can be explained by the measurement of sedimentation veloc-ity being skewed by the presence of more than one species, namely the monomer–dimer equilibrium indi-cated by SEC and sedimentation equilibrium.
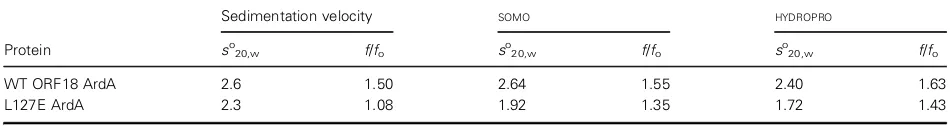
Furthermore, calculation of sedimentation velocity and f/fo by HYDROPRO and SOMO [36–38] from bead
models calculated with the crystal monomer and dimer showed good agreement with the experimental data for WT ORF18 ArdA, and, because of the monomer– dimer equilibrium, only qualitative agreement for the mutant (Table 4).
Comparison ofin vivoactivity of ORF18 ArdA
and ArdA mutants against the EcoKI Type I RM system
After determination of the effects of the amino acid substitutions on the quaternary structure of ArdA, the
ability of the mutant ArdA proteins to inhibit restric-tion and modificarestric-tion by the EcoKI RM system
in vivo was examined. The in vivo activities of WT ORF18 ArdA and the mutant ArdA proteins were examined with a restriction assay in which the ability of phagekv.0 to infect two strains of E. coli, one with
the EcoKI RM system, E. coliNM1049(DE3), and
one without the RM system, E. coli NM1261(DE3),
transformed with the expression plasmids, was investi-gated (Table 5). The control experiment with the
pTRC99 vector [39] showed that E. coliNM1261
(DE3) was easily infected by phagekv.0 (high titre), but that E. coliNM1049(DE3) was not easily infected (low titre), owing to restriction by the EcoKI RM system.
Cells transformed with plasmid expressing WT ORF18 ArdA or active ArdA mutants (Mut6 and L127E) showed a high titre of phage for both bacterial strains, indicating that the ArdA proteins were abol-ishing the restriction activity of EcoKI and were ~80% as effective as WT ORF18 ArdA. Cells trans-formed with plasmids expressing Mut5 were only 5% as active as WT ArdA; L134E ArdA showed 2% activity, and Mut5/6 ArdA showed essentially zero (0.3%) inhibition of restriction by the EcoKI system. The low antirestriction activity of Mut5/6 and L134E ArdA is most probably a consequence of their poor expression, whereas the low activity of Mut5 ArdA, which was expressed well, is suggestive of a defect in activity.
[image:8.595.52.527.519.574.2]A further in vivo test was performed to determine whether some of the mutant ArdA proteins were able to prevent modification of phagekv.0 by EcoKI.
Table 4.Comparison of experimental sedimentation velocity andf/fofor the major sedimenting species, with values calculated withSOMO [37,38] and HYDROPRO[36], based on the crystal structure of the ArdA dimer for WT ORF18 ArdA [18] and the monomer coordinates extracted from the crystal structure for L127E ArdA.
Protein
Sedimentation velocity SOMO HYDROPRO
so
20,w f/fo so20,w f/fo so20,w f/fo
WT ORF18 ArdA 2.6 1.50 2.64 1.55 2.40 1.63
[image:8.595.52.527.637.700.2]L127E ArdA 2.3 1.08 1.92 1.35 1.72 1.43
Table 3.Estimated molecular mass distributions andf/fovalues from sedimentation velocity AUC. Rmsd values of sedimentation coefficient (so
20,w) andf/foare given for the major sedimenting species. The rmsd at a confidence level of 0.683 (one standard deviation) is given for the major sedimenting species.
Sample Concentration (lM)
Measured sedimentation coefficient (so 20,w)
(% composition) of 260-nm signal Total% rmsd f/fo
WT ORF18 ArdA 33.9 2.6 (89.0) 5.2 (4.3) 9.0 (3.0) 96.3 0.0076 1.50
Phage were recovered after growth onE. coliNM1049 (DE3) transformed with the plasmid expressing WT ORF18 ArdA or with plasmid expressing Mut5, Mut6, L127E or L134E ArdA, and tested for modification by comparing the titre of the recovered phage on
E. coliNM1049(DE3) and E. coliNM1261(DE3) (Table 5). An antimodification value of 122 was obtained for phage recovered from the strain trans-formed with the WT ORF18 ArdA plasmid, indicating that a proportion of the recovered phages were unmodified and that ORF18 ArdA was partially active as an antimodification protein, as expected. However an efficiency of plating of order 1 was obtained for phage recovered from the strains expressing the ArdA mutants or containing the plasmid vector. This indi-cated that these mutant proteins were not able to pre-vent the methylation reaction of EcoKI in vivo, and that the phage DNA had been modified. Whereas this loss of antimodification activity can be attributed to low protein expression for Mut5/6 and L134E ArdA, the other proteins were expressed well, so the loss of antimodification activity indicates a loss of interaction between the ArdA mutant and the EcoKI enzyme.
Discussion
Our results show that mutations in domain 3 of ORF18 ArdA affect the ability of the protein to form the dimer observed in the crystal structure. Examina-tion of the structural model of the ArdA dimer bound to HsdS of the EcoKI MTase (Fig. 1A,B) [18] and the model of DNA bound to HsdS (Fig. 1C) reveals that the locations of the mutations analysed in this study are located near the DNA-binding site of the TRDs in HsdS (Mut5 and Mut6) or at the ArdA dimer inter-face (L127E and L134E). The observation that Mut5 ArdA is a monomer when the substitutions made are not at the interface suggests that they have caused a minor alteration in protein structure, which manages to propagate through the structure to the dimer
interface, preventing its correct formation. Of note is the change D112N at the start of an a-helix. Removal of the charge at this end of the helix and consequent interference with the normal electrostatic dipole of the helix may alter its orientation, even though no affect on folding stability or secondary structure was observed. The substitutions forming Mut6 ArdA commence at the other end of this same a-helix, but do not disrupt dimerization. As most of the substitu-tions in Mut6 ArdA are on a loop in the structure, perhaps there is sufficient flexibility in the loop to accommodate them but not in the helix region in Mut5 ArdA.
The concatenation of Mut5 and Mut6 to make
Mut5/6 prevented protein expression, probably
because of exacerbation of the folding problem present in Mut5 ArdA. Leu127 and Leu134 are in contact with each other across the dimer interface in the crystal structure, so it was not unexpected that their replace-ment with a large negatively charged side chain in an already charged region (Leu127 lies within the region mutated in Mut6 ArdA) would disrupt the interface (L127E ArdA) and even lead to expression problems (L134E).
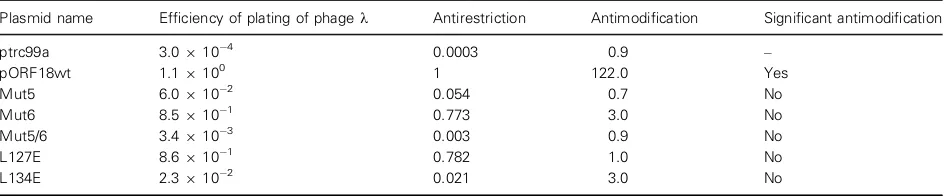
[image:9.595.70.542.103.201.2]Our recent mutational analysis of the Ocr DNA mimic binding to the EcoKI MTase defined similar regions of interactions with HsdS of EcoKI as delin-eated here for Mut5 and Mut6 ArdA [40]. Thus, despite the completely different folds of Ocr and ArdA, the equivalent regions on their surface are in contact with the EcoKI MTase. The region defined by Mut5 ArdA interacts with part of the TRDs of HsdS, which recognise the specified bases in the EcoKI tar-get, i.e. the AAC and GTGC parts of the target sequence, whereas the region defined by Mut6 ArdA (and Leu127) interacts with the region of HsdS that interacts nonspecifically with the six base pairs in the middle of the bipartite target sequence. Mutations in Ocr affecting DNA binding affinity were clustered in the same location as Mut6 ArdA, and also resulted Table 5.In vivo anti-RM activity of ArdA proteins. The titre of phage per millilitre was determined in E. coliNM1261(DE3, r m ) and
E. coliNM1049(DE3, r+m+), and the ratio was calculated (phage per millilitre in NM1049/phage per millilitre in NM1261) to obtain the efficiency of plating. The two strains were transformed with either the vector alone or plasmids expressing mutants of ArdA.
Plasmid name Efficiency of plating of phagek Antirestriction Antimodification Significant antimodification
ptrc99a 3.0910 4 0.0003 0.9 –
pORF18wt 1.19100 1 122.0 Yes
Mut5 6.0910 2 0.054 0.7 No
Mut6 8.5910 1 0.773 3.0 No
Mut5/6 3.4910 3 0.003 0.9 No
L127E 8.6910 1 0.782 1.0 No
in a weaker interaction between the Ocr mutant and the EcoKI MTase than between the MTase and its DNA target.
Although the solution environment in vivo is very different from the in vitro conditions, it appears rea-sonable to assume that the ability to retain antirestric-tion activity does not depend on the quaternary structure of ArdA, as one of the monomeric forms, L127E ArdA, retained 80% antirestriction activity, whereas the other monomeric form, Mut5 ArdA, showed only 5% activity. The dimeric Mut6 ArdA retained 80% antirestriction activity. None of these three mutants, Mut5 ArdA, Mut6 ArdA, or L127E ArdA, showed antimodification activity in vivo. However, if one again assumes that thein vitroresults can be extended to the in vivo situation, the inability of these mutants to cause antimodification is not attributable to the quaternary structure of ArdA, as both the monomeric and dimeric mutant ArdA forms failed to inhibit modification. Nor can the loss of anti-modification activity be attributed to low protein
expression levels, as these mutant proteins all
expressed well. Our results obtainedin vivo agree with earlier work [21,23–25] where in vivo expression levels of ArdA from the ColIb-P9 plasmid were varied. These in vivo experiments showed that antirestriction was prevalent over antimodification when the concen-tration of ArdA was low. It was proposed that mono-mers of ArdA inhibited only the restriction activity, because they could only bind to the HsdRs of Type I RM enzymes, whereas dimers of ArdA could also bind to the MTase core of the RM enzyme [21–25]. Such an interaction between HsdR and the Ocr antirestric-tion protein has been observed previously [41], so it could be expected that ArdA would also have binding sites on the RM enzyme in addition to the binding site on the core MTase. It would be of interest to examine the HsdR–ArdA interactions in more detail but, unfor-tunately, HsdR of EcoKI and the complete RM enzyme are available in too small amounts for mean-ingful biophysical analyses. As the structural model suggests that domain 3 of ArdA is primarily responsi-ble for interacting with the MTase core of the RM enzyme (Fig. 1), domains 1 and 2 of ArdA projecting beyond the MTase core would appear to contain the binding surface for HsdR of the RM enzyme, as suggested previously [18].
Finally, a search of the NCBI database using the
Tn916 ORF18 ArdA sequence and BLINK (http://
www.ncbi.nlm.nih.gov/sutils/blink.cgi?mode=query) reveals putativeardAgenes in many conjugative trans-posons and prophage integrated into the genomes of a large number of bacterial species. Sequenced ardA
genes are mostly predicted to encode small polypeptides of 166–177 residues, many of which are highly acidic
and carry a net negative charge of 22 to 29. A
proportion of the putative ArdA proteins in the NCBI database are larger than a typical ArdA, which comprises 166–177 residues. Some of these larger ArdA proteins contain significant N-terminal or C-terminal extensions, indicating that the ArdA monomer has been fused to the end of another protein. A smaller number of putative ArdA proteins appear to have both N-terminal and C-terminal extensions. If these sequences were actually translated into protein, then our data on the monomeric forms of ArdA would indicate that these putative antirestriction proteins could bind to and inhibit the restriction reaction of HsdRs in Type I RM systems in a wide range of organisms.
Experimental procedures
TheE. coli strains used and methods for assessing in vivo
activity of ArdA and its mutants were essentially the same as described previously [40], although only spot tests, rather than full plate assays, were used to determine the antimodification activity. The protocol for analytical SEC has been described previously [40]. The buffer for the
chromatography was 20 mM Tris, 20 mM Mes, 200 mM
NaCl, 10 mMMgCl2, 0.1 mMEDTA, and 7 mM
2-mercap-toethanol (2-ME), adjusted to pH 6.5 with HCl. The flow rate was set to 0.5 mL/min, and the sample volume was 40lL. The column eluate was excited at 295 nm, and the
fluorescence emission was continuously monitored at
350 nm.
Construction of ORF18 ArdA mutants, and protein purification and characterization
The construction of a plasmid containing the ORF18ardA
gene from Tn916(Fig. S1) and the purification of the pro-tein have been described previously [17,18]. Site-directed mutagenesis was carried out with the QuikChange II Site-Directed Mutagenesis kit from Stratagene (La Jolla, CA, USA), with the primers shown in Table S1, to create the substitutions shown in Table 1. DNA sequencing confirmed that the desired changes in the ORF18ardAgene had been achieved.
The ArdA proteins were overexpressed and purified as described previously [17]. The extinction coefficient for the monomeric form of ArdA was calculated from the amino
acid sequence (WT ORF18 ArdA, 28 020M 1cm 1) and
Equilibrium unfolding as a function of guanidinium chlo-ride was monitored by tryptophan fluorescence spectros-copy. WT ORF18 ArdA has two tryptophans, Trp23 and Trp70, located in domains 1 and 2, distant from the dimer interface. A stock solution of guanidinium chloride was made up, and the precise concentration was determined from the refractive index [43]. Protein (3.5lM) in 20 mM Tris/HCl, 10 mMMgCl2and 7 mM2-ME (pH 8.0) was incu-bated with various concentrations of guanidinium chloride at 25°C, and allowed to equilibrate overnight. The fluores-cence intensity was then measured for each sample, with excitation at 295 nm and emission at 350 nm and 380 nm, with 5-nm bandwidths, on an Edinburgh Instruments FS900 fluorimeter (Edinburgh Instruments, Livingston, UK). The ratio of intensity at 350–380 nm was then fitted to a two-state unfolding model assuming a linear relationship between free energy of unfolding and the concentration of guanidinium chloride [44]. This ratio compensates for slight differences in the protein concentration between samples.
CD measurements were carried out on a Jasco
Model J-180 spectropolarimeter (Jasco Corporation, Tokyo, Japan). All measurements were conducted in 20 mMsodium
phosphate, 50 mM NaF, and 0.5 mM 2-ME (pH 8.0).
Far-UV CD spectra were measured in the range 190–260 nm at protein concentrations of 5.6–5.8lM. All CD measurements were made at 20°C in a 1.0-mm pathlength cell, and each spectrum was the average of three individual scans. The spectra were corrected for buffer contribution.
LC-MS experiments were performed by D. Clarke (School of Chemistry, University of Edinburgh). For LC-MS, an Ultimate 3000 HPLC system (Dionex Corpora-tion, Sunnyvale, CA, USA), equipped with a monolithic
PS-DVB (500lm95 mm) analytical column (Dionex
Corporation), was used. Samples containing~1lg of pro-tein were injected into the column. MS data were acquired on a Bruker 12 Tesla Apex Qe FT-ICR (Bruker Daltonics, Billerica, MA, USA) equipped with an ESI source. Fast Fourier transforms and subsequent analyses were per-formed withDATAANALYSIS(Bruker Daltonics) software.
AUC
Prior to any AUC, the samples were analysed with UV absorbance spectrophotometry to determine an appropriate wavelength for data collection. Stock protein samples were subjected to a 3000 r.p.m. (500g) spin in a benchtop mi-crocentrifuge to remove any particulates. The buffer used
was 200 mM NaCl, 20 mM Tris, 20 mM MES, and 1 mM
tris(2-carboxyethyl)phosphine (TCEP), adjusted to pH 6.5 with HCl. TCEP was used instead of 2-ME in the AUC experiments. The density and viscosity were calculated to beq=1.00704 gmL 1andg=1.026910 2Poise, respec-tively. Owing to software restrictions, the values for density
and viscosity omitted the presence of 20 mM MES and
1 mM TCEP. The partial specific volumes (υ-bar) for
ORF18 ArdA and L127E ArdA were calculated from their
amino acid composition to be 0.726 mLg 1 and
0.725 mLg 1, respectively. The partial specific volume of the sample and buffer density and viscosity were calculated withSEDNTERPV1.09 (March 2006) [45].
For sedimentation equilibrium, we used samples
(0.125 mL) centrifuged in 1.2-cm pathlength six-sector epon centrepiece cells with sapphire windows in a four-place An-60 Ti analytical rotor at a temperature of 20°C. Rotor speeds (17 000, 27 000 and 35 000 r.p.m.) were calculated on the assumption of a monomer molecular mass of 19 125 Da. Because of the range of concentrations present (15 lM, 3lM and 0.6lMin monomers), radial absorbance scans at 230, 250 and 280 nm, with 20 scans with a radial step size of 0.001 cm, were performed and interference scans were also performed. Scan intervals at 17 000 r.p.m. (23 305g) were after 12 h, and then every 1 h until equilib-rium was reached. Scan intervals at 27 000 (58 787 g) and 35 000 r.p.m. (98 784g) were after 9 h, and then every 1 h until equilibrium was reached. Scans were judged to be at equilibrium with SEDFIT V11.9 (July 2010), by looking at the difference between successive scans [34]. Blank water scans were also collected at all speeds and wavelengths
used. The results were analysed with SEDPHAT V6.5 (June
2009) [33] (P. Schuck, http://www.analyticalultracentrifuga-tion.com/sedphat/sedphathtm; and https://sedfitsedphat.ni-bib.nih.gov/default.aspx). The total run time was just over 68 h. After data collection, the rotor was accelerated to 48 000 r.p.m. (185 795g) to pellet macromolecular material and to measure the baseline absorbance resulting from any low molecular mass material.
For sedimentation velocity AUC, we used 0.406-mL samples centrifuged in 1.2-cm pathlength two-sector alu-minium centrepiece cells built with sapphire windows in an
eight-place An50 Ti analytical rotor running in an
Optima XL-I analytical ultracentrifuge (Beckman Instru-ments, Fullerton, CA, USA) at 50 000 r.p.m. (201 600 g) and a temperature of 20°C. Changes in solute concentra-tion were detected by radial absorbance scans at 260 nm; 200 scans per cell were collected over 15 h in radial step-wise increments of 0.003 cm, with a scan interval of 2 mins. Results were analysed by whole boundary profile analysis with SEDFITV11.9 (July 2010) [34]. The fitting resolution in SEDFIT of the sedimentation velocity AUC data is 150. The
concentration of ORF18 ArdA was 33.9lM, and that of
L127E ArdA was 36.9 lM, in terms of monomers.
Hydro-dynamic parameters were calculated from the crystallo-graphic data withHYDROPRO[36] andSOMO[37,38].
Acknowledgements
K. Chen was partly supported by an EaStChem PhD studentship. E. K. M. Bower thanks the EPSRC for a PhD studentship.
References
1 Roberts RJ, Belfort M, Bestor T, Bhagwat AS, Bickle TA, Bitinaite J, Blumenthal RM, Degtyarev SKh,
Dryden DTF, Dybvig Ket al.(2003) A nomenclature
for restriction enzymes, DNA methyltransferases, homing endonucleases and their genes.Nucleic Acids Res31, 1805–1812.
2 Tock MR & Dryden DTF (2005) The biology of restriction and anti-restriction.Curr Opin Microbiol8, 466–472.
3 Roberts RJ, Vincze T, Posfai J & Macelis D (2010) REBASE: restriction enzymes and methylases.Nucleic Acids Res38, D234–D236.
4 Thomas CM & Nielsen KM (2005) Mechanisms of, and barriers to, horizontal gene transfer between bacteria.
Nat Rev Microbiol3, 711–721.
5 Lindsay JA & Holden MT (2006) Understanding the rise of the superbug: investigation of the evolution and genomic variation ofStaphylococcus aureus.Funct Integr Genomics6, 186–201.
6 Robicsek A, Jacoby GA & Hooper DC (2006) The worldwide emergence of plasmid-mediated quinolone resistance.Lancet Infect Dis6, 629–640.
7 Wright GD (2007) The antibiotic resistome: the nexus of chemical and genetic diversity.Nat Rev Microbiol5, 175–186.
8 Vedler E, Vahter M & Heinaru A (2004) The completely sequenced plasmid pEST4011 contains a novel IncP1 backbone and a catabolic transposon harboring tfd genes for 2,4-dichlorophenoxyacetic acid degradation.J Bacteriol186, 7161–7174.
9 Bickle TA & Kruger DH (1993) Biology of DNA restriction.Microbiol Rev57, 434–450.
10 Wilkins BM (2002) Plasmid promiscuity: meeting the challenge of DNA immigration control.Environ Microbiol4, 495–500.
11 King G & Murray NE (1995) Restriction alleviation and modification enhancement by the Rac prophage of
Escherichia coliK-12.Mol Microbiol16, 769–777. 12 Webb JL, King G, Ternent D, Titheradge AJB &
Murray NE (1996) Restriction by EcoKI is enhanced by co-operative interactions between target sequences
and is dependent on DEAD box motifs.EMBO J15,
2003–2009.
13 Belogurov AA, Yussifov TN, Kotova VU & Zavilgelsky GB (1985) The novel gene(s) ARD of plasmid pKM101: alleviation of EcoK restriction.Mol Gen Genet198, 509–513.
14 Belogurov AA, Delver EP & Rodzevich OV (1993) Plasmid pKM101 encodes two nonhomologous
antirestriction proteins (ArdA and ArdB) whose expression is controlled by homologous regulatory sequences.J Bacteriol175, 4843–4850.
15 Althorpe NJ, Chilley PM, Thomas AT, Brammar WJ & Wilkins BM (1999) Transient transcriptional activation of the Incl1 plasmid anti-restriction gene (ardA) and SOS inhibition gene (psiB) early in conjugating recipient bacteria.Mol Microbiol31, 133–142. 16 Thomas AT, Brammar WJ & Wilkins BM (2003)
Plasmid R16 ArdA protein preferentially targets restriction activity of the Type I restriction-modification system EcoKI.J Bacteriol185, 2022–2025.
17 Serfiotis-Mitsa D, Roberts GA, Cooper LP, White JH, Nutley M, Cooper A, Blakely GW & Dryden DTF (2008) TheOrf18gene product from conjugative transposon Tn916 is an ArdA antirestriction protein that inhibits Type I DNA restriction-modification systems.J Mol Biol383, 970–981.
18 McMahon SA, Roberts GA, Johnson KA, Cooper LP, Liu H, White JH, Carter LG, Sanghvi B, Oke M,
Walkinshaw MDet al.(2009) Extensive DNA mimicry
by the ArdA anti-restriction protein and its role in the spread of antibiotic resistance.Nucleic Acids Res37, 4887–4897.
19 Walkinshaw MD, Taylor P, Sturrock SS, Atanasiu C, Berge T, Henderson RM, Edwardson JM & Dryden DTF (2002) Structure of Ocr from bacteriophage T7, a protein that mimics B-form DNA.Mol Cell9, 187–194. 20 Dryden DTF (2006) DNA mimicry by proteins and the
control of enzymatic activity on DNA.Trends Biotechnol24, 378–382.
21 Zavilgelsky GB, Letuchaya TA & Rastorguev SM (2006) Antirestriction and antimodification activities of the ArdA protein encoded by the IncI1 transmissive plasmids R-64 and ColIb-P9.Russ J Genet42, 333–338. 22 Nekrasov SV, Agafonova OV, Belogurova NG, Delver
EP & Belogurov AA (2007) Plasmid-encoded antirestriction protein ArdA can discriminate between Type I methyltransferase and complete restriction-modification system.J Mol Biol365, 284–297.
23 Zavilgelsky GB, Kotova VYu & Rastorguev SM (2008) Comparative analysis of antirestriction activity of ArdA (ColIIb-P9) and Ocr (T7) proteins.Biochem (Mosc)73, 1124–1130.
24 Zavilgelsky GB & Rastorguev SM (2009) Antirestriction proteins ArdA and Ocr as efficient inhibitors of Type I restriction-modification enzymes.
Mol Biol (Mosk)43, 264–273.
25 Zavilgelsky GB, Kutova VYu & Rastorguev SM (2011) Antimodification activity of the ArdA and Ocr proteins.Russ J Genet47, 159–167.
27 Waldron DE & Lindsay JA (2006) Sau1: a novel lineage-specific Type I restriction-modification system that blocks horizontal gene transfer intoStaphylococcus aureusand betweenS. aureusisolates of different lineages.J Bacteriol188, 5578–5585.
28 Dryden DTF, Cooper LP & Murray NE (1993) Purification and characterization of the
methyltransferase from the Type I restriction and modification system ofEscherichia coliK12.J Biol Chem268, 13228–13236.
29 Kennaway CK, Obarska-Kosinska A, White JH, Tuszynska I, Cooper LP, Bujnicki JM, Trinick J & Dryden DTF (2009) The structure of M.EcoKI Type I DNA methyltransferase with a DNA mimic
antirestriction protein.Nucleic Acids Res37, 762–770. 30 Cerdeno-Tarraga AM, Patrick S, Crossman LC,
Blakely G, Abratt V, Lennard N, Poxton I, Duerden B, Harris B, Quail MAet al.(2005) Extensive DNA inversions in the B. fragilis genome control variable gene expression.Science307, 1463–1465.
31 Titheradge AJ, King J, Ryu J & Murray NE (2001) Families of restriction enzymes: an analysis prompted by molecular and genetic data for Type ID restriction and modification systems.Nucleic Acids Res,20, 4195–4205.
32 Chin V, Valinluck V, Magaki S & Ryu J (2004) KpnBI is the prototype of a new family (IE) of bacterial Type I restriction-modification system.Nucleic Acids Res,32, e138.
33 Schuck P (2003) On the analysis of protein self-association by sedimentation velocity analytical ultracentrifugation.Anal Biochem320, 104–124. 34 Laue T, Shah B, Ridgeway T & Pelletier S (1992)
Computer-aided interpretation of analytical sedimentation data for proteins. InAnalytical
Ultracentrifugation in Biochemistry and Polymer Science
(Harding SE, Rowe AJ & Horton JC, eds), pp. 90–125. Royal Society of Chemistry, Cambridge.
35 Haschemeyer RH & Haschemeyer AEV (1973) Proteins: a Guide to Study by Physical and Chemical Methods. Wiley-Interscience, New York.
36 Ortega A, Amoros D & Garcıa de la Torre J (2011) Prediction of hydrodynamic and other solution properties of rigid proteins from atomic and residue-level models.Biophys J 101, 892–898.
37 Rai N, Nollmann M, Spotorno B, Tassara G, Byron O & Rocco M (2005) SOMO (SOlution MOdeler): differences between X-ray and NMR-derived bead models suggest a role for side chain flexibility in protein hydrodynamics.Structure13, 723–734.
38 Brookes E, Demeler B & Rocco M (2010) The implementation of SOMO (SOlution MOdeller) in the UltraScan analytical ultracentrifugation data analysis suite: enhanced capabilities allow the reliable hydrodynamic modeling of virtually any kind of biomacromolecule.Eur Biophys J39, 423–435. 39 Amann E, Ochs B & Abel KJ (1988) Tightly regulated
tac promoter vectors useful for the expression of unfused and fused proteins inEscherichia coli.Gene69, 301–315.
40 Roberts GA, Stephanou AS, Kanwar N, Dawson A, Cooper LP, Chen K, Nutley M, Cooper A, Blakely GW & Dryden DTF (2012) Exploring the DNA mimicry of the Ocr protein of phage T7.Nucleic Acids Res40, 8129–8143.
41 Atanasiu C, Su TJ, Sturrock SS & Dryden DTF (2002) Interaction of the Ocr gene 0.3 protein of
bacteriophage T7 with EcoKI restriction/modification enzyme.Nucleic Acids Res30, 3936–3944.
42 Gill SC & von Hippel PH (1989) Calculation of protein extinction coefficients from amino acid sequence data.
Anal Biochem182, 319–326.
43 Pace CN, Shirley BA & Thomson JA (1989) Measuring the conformational stability of a protein InProtein Structure. A Practical Approach(Creighton TE, ed.), pp. 311–330. IRL Press, Oxford.
44 Clarke J & Fersht AR (1993) Engineered disulfide bonds as probes of the folding pathway of barnase: increasing the stability of proteins against the rate of denaturation.Biochemistry32, 4322–4329.
45 Schuck P (2000) Size distribution analysis of macromolecules by sedimentation velocity ultracentrifugation and Lamm equation modeling.
Biophys J 78, 1606–1619.
Supporting information
Additional supporting information may be found in the online version of this article at the publisher’s web site:
Table S1. Sequence of mutagenic oligonucleotide pri-mer pairs.
Fig. S1.Map of pORF18wt.
Fig. S2.Protein purification and folding curves.
Fig. S3.Circular dichroism spectra.
Fig. S4.LC-MS.
Fig. S5.Size exclusion chromatography.