This is a repository copy of Explosion reactivity characterisation of pulverised torrefied spruce wood.
White Rose Research Online URL for this paper: http://eprints.whiterose.ac.uk/105062/
Version: Accepted Version
Proceedings Paper:
Huescar Medina, C, Phylaktou, HN, Andrews, GE et al. (1 more author) (2014) Explosion reactivity characterisation of pulverised torrefied spruce wood. In: UNSPECIFIED Tenth International Symposium on Hazards, Prevention, and Mitigation of Industrial Explosions (X ISHPMIE), 10-14 Jun 2014, Bergen, Norway. . ISBN 978-82-999683-0-0
eprints@whiterose.ac.uk https://eprints.whiterose.ac.uk/
Reuse
Unless indicated otherwise, fulltext items are protected by copyright with all rights reserved. The copyright exception in section 29 of the Copyright, Designs and Patents Act 1988 allows the making of a single copy solely for the purpose of non-commercial research or private study within the limits of fair dealing. The publisher or other rights-holder may allow further reproduction and re-use of this version - refer to the White Rose Research Online record for this item. Where records identify the publisher as the copyright holder, users can verify any specific terms of use on the publisher’s website.
Takedown
If you consider content in White Rose Research Online to be in breach of UK law, please notify us by
Huescar-Medina, C., Sattar, H., Phylaktou, H.N., Andrews, G.E. and Gibbs, B.M., Explosion reactivity characterisation of pulverised torrefied spruce wood. Tenth International Symposium on Hazards, Prevention, and Mitigation of Industrial Explosions (XISHPMIE) Bergen, Norway, 10-14 June 2014.
Also in: J. Loss Prevention in the Process Industries, 2014.
Explosion reactivity characterisation of pulverised torrefied spruce wood
Huescar Medina C., Sattar, H., Phylaktou, H.N., Andrews, G.E. and Gibbs, B.M. Journal of Loss Prevention in the Process Industries 15 Dec 2014
DOI 10.1016/j.jlp.2014.12.009
Explosion reactivity characterisation of pulverised
torrefied spruce
Clara Huéscar Medina, Herodotos N. Phylaktou, Gordon E. Andrews & Bernard M. Gibbs
E-mail: pm09chm@leeds.ac.uk
University of Leeds, Leeds, United Kingdom
Abstract
Wood and other agricultural powders have been recognised as hazardous for a long time. These kinds of materials are also now being used for power generation in 100% biomass plants or mixed with coal as a way of reducing greenhouse gas emissions. However, safety data for biomass is very scarce in the literature, and non-existent for upgraded biomass products such as torrefied biomass, largely due to the challenges that biomass poses for explosion characterisation in the standard methods (1m3 ISO vessel or 20L sphere). The Leeds group has developed and calibrated new systems for the 1m3 ISO vessel that overcome such challenges and thus, this work presents the first data available in the literature for torrefied biomass explosion characteristics, results for untreated Norway spruce wood and Kellingley coal are included for comparison. Also flame speeds and post-explosion residue analysis results are presented. Results showed that torrefied spruce wood was more reactive than Kellingley coal and slightly more reactive than its parent material in terms of Kst, Pmax and flame speed. The differences between coal and biomass samples highlight that it should not be assumed that safety systems for coal can be applied to torrefied or raw wood materials, without suitable modifications.
1. Introduction
Pulverised biomass on its own or co-fired, accounted for nearly 14% of the total renewable electricity generation in the UK in 2012. The total contribution of renewable energy to all energy consumption in the UK was 3.8% in 2011. This comprised 8.7% of electricity, 2.2% of heat and 2.9% of transport fuel coming from renewable sources (DECC 2013). The UK has agreed to the EU wide renewable energy target of 20% of all energy to come from renewables by 2020, in line with the EU 2009 Renewable Energy Directive (EC 2009). The UK's specific target is to achieve 15% of all energy from renewables. The UK's Department of Energy and Climate Change (DECC) has announced that the UK will attempt to meet this target with 30% renewable electricity, 12% renewable heat and 10% renewable transport fuel (DECC 2011). As a result of the government’s plans, the use of biomass for generation of power, heat and transport fuels is forecasted to double or quadruple 2011’s levels by 2020 (from 12 TWh to 30-50 TWh) (DECC 2011). Economic incentives are in place such as the renewable obligation certificates to achieve this. However, in power generation, there are challenges mainly related to retrofitting plants in order to use biomass, a material with different characteristics to fossil fuels that affect the general operation of plants: efficiency, storage, handling, etc. Biomass fuels properties can be upgraded through torrefaction. This is a thermal pre-treatment in which biomass is subjected to temperatures of around 300°C in an inert atmosphere for a certain period of time. The end product is more energy dense, hydrophobic and easy to grind with properties similar to low rank coals. Torrefaction of biomass decreases the transportation and storage costs and also enables co-milling with coal or for coal mills to be used with 100% torrefied biomass, which is attractive in the current scenario where authorities are encouraging coal plants to co-fire or to convert to 100% biomass plants rather than building new 100% biomass plants. The implicit assumption in replacing coal with biomass is that biomass behaves in a similar way to coal and therefore the present combustion and safety (fire and explosion) systems are adequate. Explosibility data on biomass are scarce and non-existent for torrefied biomass and as a result fire and explosion incidents seem to be occurring frequently (Butcher 2011; Holland 2011; Renewables International Magazine 2011; Bock 2013; East Providence Patch 2013).
1.1 Biomass explosion characterisation challenges
Pulverised biomass and torrefied biomass present a few characteristics which pose challenges to the standard methods for determining explosion characteristics using the 1m3 ISO vessel or the 20 L sphere. Wood biomass and some torrefied biomass materials can present very low bulk densities (c.a. 200-300 kg/m3), therefore the standard dust holders cannot hold enough quantities of dust for a complete characterisation of the samples. The addition of another 5L volume dust holder used in parallel with the standard dust holder is mentioned for low bulk density dusts in the standard (BSI 2004). In addition, the fibrous nature of most biomass dusts prevents a correct dispersion of dust from external dust holders into the explosion vessel. Other researchers have previously recognised and tackled these issues, finding new dispersion methods and ensuring matching results with the standard methods (Wilén et al. 1999; Sattar 2013; Sattar et al. 2013).
report or account for the non-injected powder. A greater challenge is posed by the dust found inside the vessel since it is often a mixture of partially burnt and unburnt. Previous work was carried out by the Leeds group to investigate this matter (Sattar et al. 2012), otherwise this issue has rarely been acknowledged in the literature and the focus was only to investigate the difference in particle morphology before and after an explosion (Hertzberg et al. 1982; Wilén et al. 1999; Pilao et al. 2006; Sattar 2013).
Furthermore, an accurate measurement of minimum explosion concentrations (MEC) is unlikely with the standard methods, since it is difficult to accurately know the concentration that took part in the combustion. Previous work by the authors addressed this issue and new techniques have been explored in order to provide an accurate measurement of MEC (Huéscar Medina et al. 2013).
1.2 Reactivity of biomass and torrefied biomass
The work published on biomass explosibility in the literature is inconsistent in respect to the reactivity of biomass relative to coal (Wilén et al. 1999). For torrefied biomass the reactivity of samples has been investigated through low heating rate techniques such as thermogravimetric analysis and subsequent derivation of devolatilisation kinetics. These results have shown that torrefied materials would present higher activation energies (Ea) which increased with torrefaction severity (higher temperature and longer residence times) (Darvell et al. 2010; Broström et al. 2012). Torrefaction decreases the moisture and volatile content and increases ash content, thus, the loss of volatiles and the presence of more ash could reduce the reactivity of torrefied materials at the same time that less moisture content could increase it. Particle size could also affect the relative reactivity of torrefied biomass since torrefied biomass becomes more brittle with increased torrefaction severity and therefore when a raw biomass and a torrefied biomass are pulverised through the same procedure, torrefied material is bound to have a higher proportion of fines than the raw parent material. Previous work by the authors (Huescar Medina et al. 2013) showed that MEC of torrefied samples occurred at lower equivalence ratios (~0.2 ) than for coal (~0.5 ) which indicates higher reactivity of torrefied materials in comparison to coal.
1.3 Objectives
The objective of this work is to present the first results available in the open literature for torrefied biomass using the standard 1m3 ISO vessel for the explosion characterisation of dusts. MEC, Kst and Pmax/Pi have been measured and compared to its raw parent material and to coal explosibility data. Residues after explosions were collected and further analysed to understand how biomass behaves during an explosion and to correct for the concentration that actually exploded.
2. Experiments
2.1 Materials
milling in a Retsch Ultra Centrifugal Grinding mill ZM100, in order to achieve a size
distribution that would allow the samples to flow through the explosion vessel’s dispersion
system (<60 m). All samples were stored in sealed containers.
Difficulties were generally encountered in sourcing materials in sufficient quantities to fully characterise samples for explosibility. In this particular case it was possible to source enough torrefied material; however, it was only possible to establish a trend for the characterisation of the raw sample for comparison.
After every test conducted in the 1m3 vessel, residues were found inside both the pot and the explosion chamber. These residues were collected and weighed in order to determine more accurately the concentration of dust which actually exploded. The concentrations were generally expressed as equivalence ratios rather than as concentrations in gm-3, to compare samples with different elemental compositions. The stoichiometric air to fuel ratio (A/F)stoich was calculated from the theoretical full combustion of the fuel in air based on the elemental analysis (see Table 1). The partially burnt residue inside the explosion chamber was collected and further analysed for elemental and proximate analysis, particle size distribution, morphology, and true density.
2.2 Fuel Characterisation
The samples, before and after explosion, were analysed for its chemical composition through elemental and TGA-proximate analysis using, respectively, a Flash 2000 Thermo Scientific C/H/N/S analyser (O content was determined by subtraction), and a TGA-50 Shimadzu analyser using the temperature program used by (Biagini et al. 2006). The gross calorific value (GCV) of the samples was calculated from the elemental composition using the relation proposed for biomass by (Friedl et al. 2005). The elemental composition was also used to calculate the stoichiometric fuel to air ratios as described in (Huéscar Medina et al. 2013). The bulk density of the samples was determined using a 25 mL graduated cylinder, and a weighing balance. The volume of the graduated cylinder was filled with an increasing mass of sample. Measurements of weight and volume were taken and the bulk density was calculated as the average of 10 mass to volume ratios. In addition the true density was measured using the AccuPyc 1330 Pycnometer.
The morphology of particles was investigated using Scanning Electron Microscopy, and the particle size distribution was determined using a Malvern Mastersizer 2000 instrument.
2.3 Dust explosion characterisation
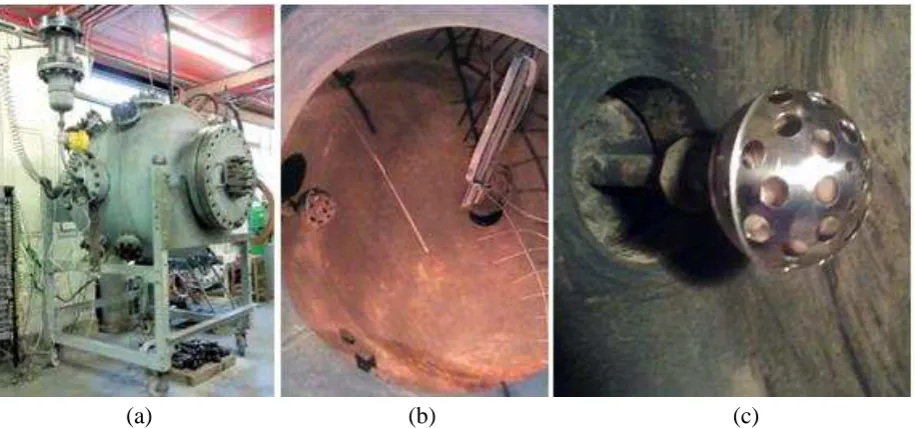
shown in Fig. 1 (c), is only perforated in the front half of the 110 mm diameter sphere, 9 holes of 8 mm diameter and 24 holes of 16 mm were drilled in triangular pitch.
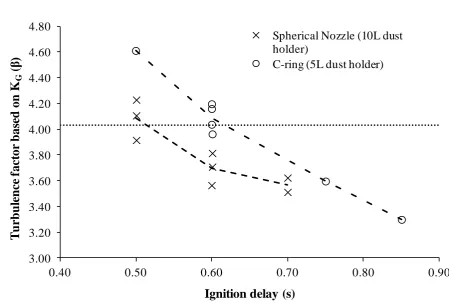
In order to calibrate the new dispersion system, the turbulence factor for the 1m3 vessel at 0.6 s ignition delay was determined by performing gas explosions in laminar and turbulent conditions to derive KG at said conditions. Therefore, using the expression given in Eq. (1):
(1)
The turbulent factor for this vessel was found to be 4.03. The requirement for any new dispersion system was to provide the same turbulent factor as the C-ring at the standard ignition delay (0.6s). The spherical nozzle was found to give the same turbulent factor with an ignition delay of 0.50 s with 10% Methane explosions as shown in Fig.2. This was then validated with cornflour dust/air mixtures showing comparable results for Kst, Pmax and flame speeds (Sattar 2013).
Figure 1: (a) Leeds 1m3 ISO vessel with 10L dust pot, (b) Inner arrangement of the 1m3 vessel, (c) spherical disperser nozzle.
[image:6.595.74.532.364.578.2]Figure 2: Calibration of spherical nozzle (Sattar 2013)
The dust pressurised in the 10L pot was released into the explosion chamber on activation of the electro-pneumatic valve on the interconnecting pipe. The dust cloud dispersed through the new spherical nozzle was ignited with two 5 KJ igniters placed in the centre of the explosion chamber after the recommended ignition delay for the spherical nozzle disperser of 0.5 s. The vessel was fitted with piezoresistive pressure transducers which allowed the determination of maximum explosion pressures and rates of pressure rise, and arrays of type-K thermocouples in horizontal (left and right) and vertical (downward) directions. These thermocouples were used to check that spherical flame propagation was achieved and to determine the time of flame arrival at each thermocouple position which allowed the derivation of flame speeds in all directions. The overall radial flame speed for a given test is the average of the flame speeds in each direction.
3. Results and discussion
3.1 Fuel Characterisation
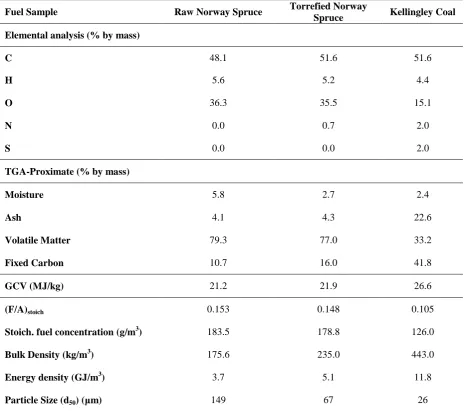
Table 1 shows the characterisation of all samples used. Some of the properties that differentiate biomass, torrefied biomass and coal can be appreciated; whilst the overall carbon content is similar at about 50% for all three fuels, there are significant differences in the fixed carbon content with raw biomass at 11% and 42% for coal. Torrefaction significantly increases the biomass fixed carbon content by almost 50%. These differences suggest that most of the carbon in biomass combustion is released as part of the volatile compounds. Biomass has more than double the volatile content than that of coal – this reduced slightly when biomass is torrefied. The bulk density of biomass is less than half that of coal and the
3.00 3.20 3.40 3.60 3.80 4.00 4.20 4.40 4.60 4.80
0.40 0.50 0.60 0.70 0.80 0.90
T u rb u le n ce f ac tor b as ed on K G ( )
Ignition delay (s)
Spherical Nozzle (10L dust holder)
calorific value is about 20% lower. The energy density data calculated in Table 1 show the biomass powder having just 1/3 the energy density of coal and although torrefaction increases the energy density of biomass by approximately 40% it is still less than half that of coal. These data suggest a significant impact on transport efficiency for the three fuels
The oxygen and volatile content in raw biomass are more than double that of coal and they are only slightly reduced after torrefaction (the level of change after torrefaction would be dependent on the torrefaction conditions).
The particle size analysis data highlight the difficulty in grinding untreated biomass samples. Despite being subjected to an additional grinding stage the particle size was still bigger than for the torrefied sample, which, after torrefaction had become easier to grind. Although all
samples were milled to <60 m, due to the fibrous nature of the biomass samples, thin but
[image:8.595.66.532.346.757.2]long particles could pass through the sieve and therefore the size distribution shows that bigger particles are present.
Table 1: Fuel Characterisation
Fuel Sample Raw Norway Spruce Torrefied Norway
Spruce Kellingley Coal
Elemental analysis (% by mass)
C 48.1 51.6 51.6
H 5.6 5.2 4.4
O 36.3 35.5 15.1
N 0.0 0.7 2.0
S 0.0 0.0 2.0
TGA-Proximate (% by mass)
Moisture 5.8 2.7 2.4
Ash 4.1 4.3 22.6
Volatile Matter 79.3 77.0 33.2
Fixed Carbon 10.7 16.0 41.8
GCV (MJ/kg) 21.2 21.9 26.6
(F/A)stoich 0.153 0.148 0.105
Stoich. fuel concentration (g/m3) 183.5 178.8 126.0
Bulk Density (kg/m3) 175.6 235.0 443.0
Energy density (GJ/m3) 3.7 5.1 11.8
As can be seen, the stoichiometric fuel concentrations are different for each sample, and therefore if mixtures of fuel in air are to be compared, this should be taken into account.
The standard (BSI 2004) requires keeping ¼ of the dust holder empty to achieve proper pressurisation, therefore the maximum quantity of torrefied spruce wood that could be tested ascends to 1763g, which corresponds to a concentration of approximately 1500 g/m3. For the raw wood sample no more than 1160g/m3 could be tested. It was also found that at high dust loadings (1250-1500 g/m3) more than 10% of the initial mass was left in the dust holder after injection.
3.2 Explosion Characteristics and Flame Speeds
Figure 3 shows the variation of Kst and Pmax/Pi for different mixtures of dust and air. The concentrations were corrected for the amount of dust remaining in the dust holder. Therefore, the concentration used in the equivalence ratio calculation was the injected concentration. Kst and the maximum pressure are typically affected by a series of factors; Kst is more affected by particle size or surface area, since it relates to how fast the combustion reaction occurs. On the other hand, maximum pressures are more affected by factors that decrease the flame temperature such as the presence of moisture or ash. Volatile matter is also known to affect Kst since devolatilisation will occur more quickly when size is small. If only particle size was considered for Kst, then the coal samples should be more reactive, however, the volatile matter of the coal samples is much lower, and overall the biomass samples have higher Kst. Also, a difference between coal and biomass samples is that Kst for coal slowly decreases after the maximum value is reached for the most reactive concentration. However, for the torrefied sample, it was not possible to continue testing higher concentrations because the volume of dust exceeded ¾ of the dust pot volume and too much powder was left in the dust holder after the test. For this reason, to be able to assess Kst for higher concentrations of dust it would be advisable to develop a delivery method in which the external dust injection was eliminated, by placing the dust inside the vessel and dispersing it from within. The parent material was tested at three concentrations around the most reactive mixture showing similar values to the torrefied samples, only slightly lower. Also, the most reactive concentrations were found for concentrations much higher than their stoichiometric for the biomass samples, and the high Kst values were found not to decrease much at richer mixtures preventing the determination of a rich flammability limit as has been typically found in the literature for dusts.
All Kst values found for the samples are summarised in Table 2. Since all values are lower than 200 bar m s-1, all the dusts tested are classified as St-1 dusts.
Figure 3: Kst, Pmax/Pi for a range of Norway spruce wood, torrefied Norway spruce wood and Kellingley coal-air mixtures
Figure 4 shows examples of the derivation of flame speeds in a test with raw Norway spruce wood and torrefied Norway spruce respectively. In each test three flame speeds are derived in horizontal right, left, and vertical downward directions. The distance from the spark of each thermocouple in the array is plotted against the actual time at which the flame reaches the thermocouple. A linear trend line can be fitted; the slope of such trend line is the average flame speed in each direction. The average flame speed for a test is the average of three flame speeds. It can be appreciated how the linear trends are parallel, which indicates spherical propagation.
Figure 4: Example of flame speed determination for a single test of Norway spruce and torrefied Norway spruce
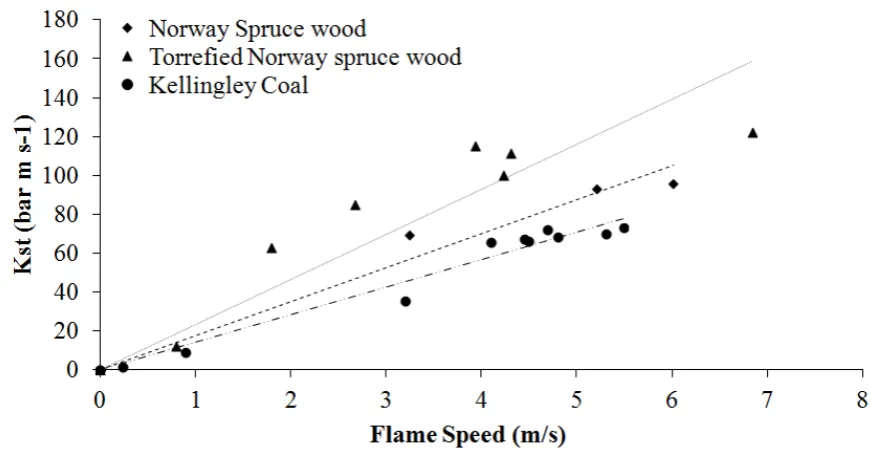
Figure 5: Relationship of Kst and flame speed
Table 2: Summary of explosion characteristics for Kellingley coal, Norway spruce wood and torrefied Norway spruce wood
Sample MEC (g/m3) MEC Kst (bar m s-1) Pmax/Pi Flame Speed (m/s)
Kellingley Coal 115 0.92 73 8.0 5.5
Norway spruce
wood - - 96 9.0 6.0
Torrefied Norway
spruce wood 68 0.38 122 9.1 6.8
Table 2 summarises the explosion characteristics for the samples tested, which shows that torrefied spruce wood was the most reactive sample, with a minimum explosive concentration (MEC) that corresponds to an equivalence ratio of 0.38, which is typical for biomass samples. This is lower than typical hydrocarbon MEC of around 0.5 . However, it should be re-stated that our calculation of the stoichiometry and hence the equivalence ratio is based on the elemental formula of the raw fuel and not of the volatiles that are actually burning.
3.3 Residue Analysis
increase for Kellingley coal and torrefied wood between 6 and 10%, whereas the change is negligible in the case of raw wood.
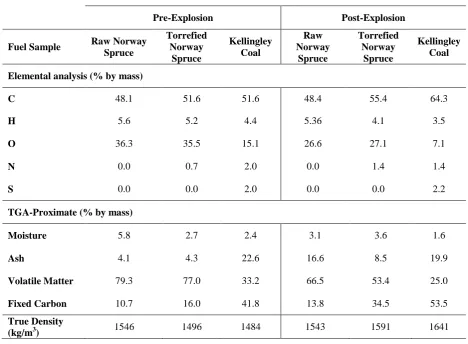
[image:12.595.63.532.163.507.2]3.3.1 Elemental and Proximate analysis
Table 3: Elemental, proximate and true densities before and after explosion
Pre-Explosion Post-Explosion
Fuel Sample Raw Norway
Spruce
Torrefied Norway
Spruce
Kellingley Coal
Raw Norway
Spruce
Torrefied Norway
Spruce
Kellingley Coal
Elemental analysis (% by mass)
C 48.1 51.6 51.6 48.4 55.4 64.3
H 5.6 5.2 4.4 5.36 4.1 3.5
O 36.3 35.5 15.1 26.6 27.1 7.1
N 0.0 0.7 2.0 0.0 1.4 1.4
S 0.0 0.0 2.0 0.0 0.0 2.2
TGA-Proximate (% by mass)
Moisture 5.8 2.7 2.4 3.1 3.6 1.6
Ash 4.1 4.3 22.6 16.6 8.5 19.9
Volatile Matter 79.3 77.0 33.2 66.5 53.4 25.0
Fixed Carbon 10.7 16.0 41.8 13.8 34.5 53.5
True Density
(kg/m3) 1546 1496 1484 1543 1591 1641
3.3.2 Particle Size
Figure 6: Particle size cumulative distribution of Norway spruce wood, torrefied Norway spruce wood and Kellingley coal before and after explosion
3.3.3 SEM
Figure 7: SEM images at x200 magnification of (a) raw Norway spruce wood before an explosion (b) raw Norway spruce wood after explosion of most reactive concentration. (c)Torrefied Norway spruce wood before an explosion. (d) Norway spruce wood after an
explosion of the most reactive concentration.
4. Conclusions
The explosion characteristics of Norway spruce wood torrefied at 260°C for 13 minutes have been measured in a 1m3 ISO vessel and compared to its parent material and a sample of Kellingley coal. The ISO 1m3 explosion vessel was modified, as allowed by the standard, by increasing the dust holder volume to 10L and replacing the standard C-ring for a spherical perforated nozzle mounted in the wall. The ignition delay was decreased to 0.50s to achieve the same turbulence level as with the standard system. It was found that the new system is
suitable for the characterisation of torrefied biomass pulverised under 60 m, however, it
would be possible to test higher concentrations of biomass if an in-vessel dispersion system was developed. Also samples with coarser particle size distributions could be assessed for a more realistic approach to the actual particle sizes used in the industry.
Results have shown that torrefied Norway spruce presents chemical characteristics similar to low rank coals, grindability and calorific value are improved and volatile matter is decreased as well as moisture. Whilst the biomass energy density is significantly increased by torrefaction it remains less than half the energy density of coal.
MEC results for torrefied Norway spruce showed a similar behaviour to what has been typically found for other biomass samples, at equivalence ratios of 0.3. Kellingley coal was
a b
less reactive than torrefied Norway spruce wood, possibly due to its low volatile matter and high ash content. Turbulent flame speeds can be measured in the Leeds ISO 1m3 vessel. The results showed a linear relationship with Kst which indicates that flame speed can be used as a measure of reactivity as well as Kst.
The analysis of the residue from the most reactive mixture explosion of torrefied Norway spruce showed that there was release of volatiles, slight preferential burning of fines and presence of char structures. This behaviour is similar to that of coal. The residue from raw Norway spruce was essentially the same material as before the explosion which points at total consumption of particles during flame propagation. Further work is underway to corroborate and understand these findings using other torrefied materials.
Acknowledgements
The authors are grateful to the Energy Program (Grant EP/H048839/1) for financial support. The Energy Program is a Research Councils UK cross council initiative led by EPSRC and contributed to by ESRC, NERC, BBSRC and STFC.
References
Biagini, E., et al. (2006). "Devolatilization of Biomass Fuels and Biomass Components Studied by TG/FTIR Technique." Industrial & Engineering Chemistry Research 45: 93. Bock, L. (2013). Fire badly damages Fitchburg mill. Telegram. Fitchburg.
Broström, M., et al. (2012). "Influence of torrefaction on the devolatilization and oxidation kinetics of wood." Journal of Analytical and Applied Pyrolysis 96(0): 100-109.
BSI (2004). BS EN 14034-1: Determination of explosion characteristics of dust clouds. Part 1: Determination of maximum pressure Pmax of dust clouds. London, BSI.
Butcher, J. (2011). "Firefighters battle huge biomass fire at Port of Tyne." Retrieved 31 October 2011, from http://www.journallive.co.uk/north-east-news/todays-news/2011/10/31/firefighters-battle-huge-biomass-fire-at-port-of-tyne-61634-29689277/. Darvell, L. I., et al. (2010). "Combustion properties of some power station biomass fuels."
Fuel 89(10): 90.
DECC (2011). UK Renewable Energy Roadmap Department of Energy and Climate Change. DECC (2013). Digest of UK energy statistics (DUKES) Department of Energy and Climate
Change. https://www.gov.uk/government/collections/digest-of-uk-energy-statistics-dukes
East Providence Patch (2013) "Fire fighters at pellet company blaze searching for "hidden fires"."
EC (2009). Directive 2009/28/EC on the promotion of the use of energy from renewable sources. Official Journal of the European Union vol.52.
Friedl, A., et al. (2005). "Prediction of heating values of biomass fuel from elemental composition." Analytica Chimica Acta 544(1-2): 191-198.
Hertzberg, M., et al. (1982). "Domains of flammability and thermal ignitability for pulverized coals and other dusts: Particle size dependences and microscopic residue analyses." Symposium (International) on Combustion 19(1): 1169-1180.
Holland, T. (2011). "Essex fire destroys 21000 tonnes of woodchip destined for Dalkia biomass plant." 11 July 2011, from http://www.mrw.co.uk/news/essex-fire-destroys-21000-tonnes-of-woodchip-destined-for-dalkia-biomass-plant/8617227.article.
Huéscar Medina, C., et al. (2013). "The development of an experimental method for the determination of the minimum explosible concentration of biomass powders." Biomass and Bioenergy 53: 95-104.
International Organization of Standardization (1985). ISO-6184/1 Explosion Protection Systems- Part 1: Determination of Explosion Indices of Combustible Dusts in Air.
Pilao, R., et al. (2006). "Overall characterization of cork dust explosion." Journal of Hazardous Materials 133(1-3): 183-195.
Renewables International Magazine. (2011). "Following explosion, world's largest pellet plant
resumes operation." Retrieved 15 July 2011, from
http://www.renewablesinternational.net/following-explosion-worlds-largest-pellet-plant-resumes-operation/150/515/31440/.
Sattar, H. (2013) Combustion and explosions of biomass. University of Leeds
Sattar, H., et al. (2013) Calibration of a 10L volume dust holding pot for the 1m3 standard vessel, for use in low bulk density biomass explosibility testing 7th International Seminar on Fire and Explosion Hazards, Providence, USA
Sattar, H., et al. (2012) Explosions and flame propagation in nut-shell biomass powders IX ISHPMIE, Cracow, Poland
Sattar, H., et al. (2012) Pulverised biomass explosions: Investigation of the ultra rich mixtures that give peak reactivity IX International Symposium on Hazard, Prevention and Mitigation of Industrial Explosions, Cracow, Poland
Wilén, C., et al. (1999). Safe handling of renewable fuels and fuel mixtures.