R E S E A R C H
Open Access
On the duality between interaction responses
and mutual positions in flocking and schooling
Andrea Perna
1*, Guillaume Grégoire
2and Richard P Mann
3,4Abstract
Recent research in animal behaviour has contributed to determine how alignment, turning responses, and changes of speed mediate flocking and schooling interactions in different animal species. Here, we propose a complementary approach to the analysis of flocking phenomena, based on the idea that animals occupy preferential, anysotropic positions with respect to their neighbours, and devote a large amount of their interaction responses to maintaining their mutual positions. We test our approach by deriving the apparent alignment and attraction responses from simulated trajectories of animals moving side by side, or one in front of the other. We show that the anisotropic positioning of individuals, in combination with noise, is sufficient to reproduce several aspects of the movement responses observed in real animal groups. This anisotropy at the level of interactions should be considered explicitly in future models of flocking and schooling. By making a distinction between interaction responses involved in maintaining a preferred flock configuration, and interaction responses directed at changing it, our work provides a frame to discriminate movement interactions that signal directional conflict from interactions underlying consensual group motion.
Keywords: Collective motion, Schooling, Flocking, Movement analysis
Background
Several animal species exhibit forms of collective motion in which two or more individuals move together coher-ently. Examples include flocks of migrating birds, schools of fish, murmurations of starlings, swarms of locusts, and many others. In general, the same group of animals can produce various types of collective patterns, including disordered aggregations, milling, or schooling depending on both internal states (e.g. hunger level) and external conditions (e.g. in response to a predator).
Much of our current understanding of collective motion of animal groups comes to us from the study of the-oretical models, and in particular of a class of models known as ‘self-propelled particle models’. These models indicate that a small set of ‘rules’ of interaction is suffi-cient to generate group level patterns that resemble, at least visually, those formed by real animal groups. For instance, Reynolds [1] proposed a model that implements
*Correspondence: [email protected]
1Paris Interdisciplinary Energy Research Institute, Paris Diderot University, 10 rue Alice Domon et Léonie Duquet, 75013 Paris, France
Full list of author information is available at the end of the article
only three different rules. The first rule consists in a repul-sionbehaviour, through which each individual turns away from its local neighbours and avoids local crowding and collisions. The second rule is analignment behaviour, or a turning response towards the average heading of local neighbours. The third rule is a turning response towards the position of more distant neighbours; this is an attrac-tion rule, that contributes to maintain the members of the group together. Several alternative models of collec-tive motion have been proposed (see [2] for a review), each implementing a slightly different set of interaction rules. In spite of their differences, almost all the models existing in the literature are able to produce realistic looking pat-terns of collective behaviour, at least within a certain range of parameters.
In order to make meaningful predictions about the col-lective movement patterns of a given animal species, it is important that the interaction rules implemented in the models match those actually used by animals of that par-ticular species. In order to determine how real animals of different species interact together, several research groups have started to collect empirical data on the movement
patterns of real animal groups. Traditionally, this has been done either focusing on the collective level, or on the individual level. The collective-level approach consists in collecting data on the spatio-temporal organization of the group, such as e.g. the mutual positions of close neigh-bours, and testing which theoretical models are compat-ible with the data; the individual-level approach operates instead by selecting a ‘focal individual’ within the group, and recording all the changes of speed and direction of movement of that individual in response to the position and movement of its neighbours [3]. Here, we provide a brief review of this literature, with particular empha-sis on articles that either measure or predict the mutual positions of close neighbours.
As an example of the collective-level approach, Ballerini et al. [4] tracked the 3D positions of starlings flocking together in natural flocks, with the aim of characteris-ing the spatial organization of the group. These authors observed that nearest neighbours consistently occupy the same positions with respect to each other, determining an anisotropic arrangement at the local scale. The anisotropy did not spread to the scale of the entire flock, but dropped quickly to a completely isotropic distribution between the sixth and the seventh nearest neighbour. The fact that the anisotropy cut-off depended on the number of neighbours, but not on the density of the group, was inter-preted as evidence that starlings ‘pay attention’ to a fixed ‘topological’ number of six - seven neighbours, instead of responding to all neighbours within a fixed ‘metric’ distance. The topological nature of interactions in star-lings was later confirmed also by an alternative maximum entropy approach, based on the relative alignments of nearest neighbours, instead of their positions [5]. A sim-ilar collective level approach was adopted by Lukeman et al. [6]. These authors recorded the positions and ori-entations of surf scoters sitting on the water surface. The observed arrangements of neighbours around a focal individual were consistent with models implementing repulsion, alignment, and attraction, but also required the existence of a more direct interaction with one sin-gle neighbour situated in front. Buhl et al. [7] measured the relative positions of swarming locusts, and observed isotropy in the radial distribution of neighbours around a focal individual. This distribution was compatible with both metric and topological models of interactions, but not with a third class of ‘pursuit/escape’ models [8] in which individuals try to reach neighbours ahead of and moving away from them, while they escape from other individuals that approach them from behind. Hemelrijk et al. [9] measured how the overall shape (lengthvs.width) of schools of mullets scales with group size. Their empiri-cal data were consistent with a model in which the oblong shape of some schools, results from individuals slowing down to avoid collisions.
As examples of studies that have adopted the individual-level approach, we can mention Katz et al. [10], who reconstructed the ‘force maps’ that describe the accel-eration and turning of schooling golden shiners, and Herbert-Read et al. [11], who reconstructed the force maps of mosquitofish. These studies indicated that a fun-damental component of how fish of both species interact are changes of speed: the fish consistently increased or decreased their speed to catch neighbours that they had respectively in front or behind; but when a neighbour was too close by, the speed responses were reversed, so speed changes also mediated collision avoidance. Both studies found only weak alignment responses, in com-parison to attraction and repulsion forces. While both mosquitofish and golden shiners formed aligned groups, this was more a consequence of the fish following each other (and eventually becoming aligned) than an explicit alignment response. More recently, Pettit et al. [12] applied a similar approach to the study of flight inter-actions in pigeons. The observed flocking responses of pigeons where different from those found in fish: align-ment responses were explicit and strong, and collision avoidance was mainly mediated by turning, while speed remained relatively constant. These observations could be interpreted in terms of the different needs and constraints associated with flocking, which are different from those experienced by fish during schooling. Explicit alignment responses, for instance, might be necessary to achieve the high cohesion of pigeon flocks, that can fly with-out splitting for several kilometers. Avoiding collisions by turning away from the neighbour, instead of slowing down, might respond to a necessity to maintain a rela-tively constant speed, required to produce a sufficient lift force.
Gautrais et al. [13] used an intermediate approach to build a model of the shoaling behaviour of fish: they first characterized the motion of isolated fish, and progres-sively added interaction terms to the model through visual observations of how fish interact with obstacles and other fish, using quantitative methods to fit the parameters of these interaction rules to the tracked movements of the fish. The model was then tested at the collective level, by collecting statistics of the alignment and distance of real fish. In spite of its nice data driven formulation and good fit to experimental data, the model introduced by these authors does not formulate predictions about the mutual positions of nearest neighbours, and does not quantify these mutual positions in the empirical data; for these reasons it will not be discussed further in the con-text of our simulations which insist precisely on these aspects.
interaction rules that reproduced better the observed con-figuration of a group, it is clear that different interaction rules lead naturally to different local configurations of the group. Consider for instance the case of an animal that avoids collisions by changing speed (like mosquitofish or golden shiners). Its acceleration response will be posi-tive when the neighbour is in front and negaposi-tive when the neighbour is behind, but will invert sign in the repul-sion zone. The only region where there is no acceleration response is on the border between attraction and repul-sion zone. Similarly, if turning does not mediate collirepul-sion avoidance, the turning response will be simply directed towards the neighbour, that is, to the left if the neigh-bour is on the left and to the right if the neighneigh-bour is on the right. There are only two ‘fixed points’, for which both the turning and the acceleration response are zero: one directly in front and the other directly behind the neighbour. Not surprisingly, these positions are those at which both mosquitofish and golden shiners are most likely to have their neighbours [10,11]. Simi-lar arguments can be used to explain that when colli-sion avoidance is mediated through turning away from the neighbour (as in pigeons), a side by side configura-tion is the one which is stable (this is the configuraconfigura-tion that was most frequently observed in pigeons [12]). In other words, different interaction rules lead naturally to different local arrangements of neighbours within the group.
In the present paper, we examine the different impli-cations of this duality between interaction responses and mutual positions in flocks and schools. Unlike in previous studies, where mutual positions result from the interac-tions, here we consider the theoretical situation of animals maintaining stable mutual positions, and we address the question of what ‘apparent’ interaction responses would be observed as a mere consequence of the imposed mutual positions and noise.
Introduction
The movement of a focal individual with respect to a neighbour can be decomposed into an alignment response and an attraction-repulsion response by projecting it onto two different vectors (see Figure 1). Alignment is the component of movement response that has the same bearing as the neighbour. Attraction and repulsion cor-respond to the projection of focal individual’s move-ment on the vector oriented towards its neighbour’s body. In general, these two vectors are not orthogo-nal, except in very specific situations, such as when the focal individual and the neighbour move side by side in the same direction. In the extreme case when the focal individual and the neighbour are one behind the other, the alignment and the attraction/repulsion vectors coincide.
If the focal individual aims at keeping a fixed ‘target position’ relative to its neighbour, for instance on its side, or behind it, we can imagine that it will spend most of the time in the proximity of that position, repeatedly moving away from it under the effect of noise, and actively head-ing back to it. Movements away from the target position, or back to it, can correspond to real animal movements, but can also result from noise associated with recording the position of the focal individual, such as GPS inaccu-racy (in case of GPS tracking), or segmentation variability and pixelization (in case of video tracking).
Figure 1-(a) shows a specific example with one individ-ual, in red, having a preference for being directly behind its neighbour (target position marked by a star). A turn in the direction of the target position will be interpreted as an attraction (or repulsion) response; conversely, an align-ment response would require to keep a straight direction, but this is not compatible with approaching the target. In Figure 1-(b), the relative positions of the focal individual and of its neighbour are the same, but the focal individ-ual aims at reaching a schooling configuration side by side with its neighbour. The corresponding movement would be described in terms of an alignment response (the focal individual remains parallel to its neighbour), but also of attraction (because in this example reaching the target position involves getting closer to the neighbour). Both examples depict the same type of response (an attraction to the target), but we interpret them in terms of different alignment and attraction responses because we consider the other individual and not the target as the ‘point of attraction’.
The actual situation of two individuals moving together in two or three dimensions is more complicated, and involves not only different types of interactions e.g. align-ment and/or attraction/repulsion, but also different types of responses, e.g. through turning, or acceleration, or both. In addition, in a real flocking situation individ-uals are not always aligned with each other and can have different speeds, making it more difficult to predict what interaction rules appear, on average, over a com-mon trajectory. To test what interaction responses might support the movement of particles flocking together at a fixed distance and relative bearing, we simulate parti-cles moving on the same trajectory but subject to small random displacements around these target positions (see Methods). In particular, we focus on two configurations: one in which the two particles fly side by side, and one where the two particles fly one behind the other. Figure 2 illustrates one such generated trajectory for two particles moving side by side.
Results
(a)
(b)
Figure 1Illustration of the interactions.The focal fish (in red) aims at keeping a stable target position relative to its neighbour. In(a)this target position is behind the neighbour, while in(b)it is on the side of the neighbour. The movement in the direction of the target can be interpreted in terms of attraction or repulsion response if it has a projection onto the attraction/repulsion vector pointing in the direction of the neighbour. If the movement response has a component along the direction parallel to the neighbour (the alignment vector), it can also be interpreted as alignment. In general, the attraction/repulsion vector and the alignment vector are not orthogonal to each other, and in the particular case of aligned individuals with target positions in front or behind, the attraction and alignment vectors are not even linearly independent.
configuration is observed in the positions at which the neighbour is frequently observed (Figure 3-(a) and (d)). When the two trajectories are arranged in a front back configuration, the focal individual appears to turn in the direction of its neighbour with no ‘repulsion zone’: inde-pendently of distance there is no zone in which turnings are directed away from the neighbour (Figure 3-(b)). In this case, repulsion is mediated instead by changes of speed, as it is visible in Figure 3-(c), where acceleration is positive for neighbours situated in front and negative for neighbours situated behind, but there is a region in which the polarity of the acceleration response is inverted, when the front-back distance to the neighbour is smaller than 5
arbitrary units (the target distance between neighbouring particles implemented in the trajectories). These patterns of response are inverted for side by side trajectories: in this case, collision avoidance appears to be mediated through turning (Figure 3-(e)), while changes of speed mediate attraction, but not collision avoidance (Figure 3-(f )).
Our plots are similar to those obtained for real animal species, e.g. by Katz et al. [10] and Herbert-Read et al. [11] for fish moving prevalently in a front-back config-uration and by Pettit et al. [12] for pigeons flying side by side. The main difference is that in all studies on real animals, the repulsion zone had a roughly circular form, centered around the focal individual, while in our
(b)
(a)
Figure 2Example of generated trajectories for two particles moving side by side.(a)Complete trajectory of 212steps. The larger dots (visible
when zooming in the figure) indicate the scale for temporal correlationCT(=300 steps) used for generating the trajectories.(b)Zoom on a smaller
[image:4.595.57.541.521.693.2](a)
(d)
(b)
(e)
(c)
[image:5.595.60.544.86.369.2](f)
Figure 3Inferred interaction rules as a function of distance and direction to the neighbour.In all these plots, the focal individual can be imagined to be situated in the centre of the plot, heading towards the top of the page, and the coordinates of each cell in the polar grid correspond to the position of the neighbour.Top rowIndividuals moving in a front-back configuration.Bottom rowIndividuals moving side by side.(a)and (d)Number of counts of the neighbour within each cell of the polar grid. The positions at which the neighbour is most frequently observed match those imposed when generating the trajectories.(b)Turning response. When the individuals move in a front-back configuration, turning always happens in the direction of the neighbour.(c)Acceleration response for individuals moving in a front-back configuration. Close-by neighbours elicit a repulsive response, with an acceleration of the opposite sign.(e)Turning response of individuals moving side by side. Repulsion is mediated through turning away from the neighbour.(f)Acceleration response. For individuals moving side by side, acceleration is always positive when the neighbour is in front and negative when the neighbour is behind.
plots the repulsion zone has the form of a band, par-allel or perpendicular to the direction of movement of the focal individual. This difference is likely due to the fact that in our simulations, the underlying trajectories of the two particles are never exchanged for the entire duration of one “flight”: one individual has its attractor always on the left side of its partner and the other indi-vidual always on the right side (or one indiindi-vidual always in front and the other always behind). Real animals do switch from one to the other side of their neighbour (or from being in front to being behind), which means for instance that an animal situated roughly behind its neigh-bour (ϑ 0 in Figure 3-(e)), and aiming at being on its side, will be nearly equally likely to turn left as to turn right, and on average will exhibit no consistent turning response.
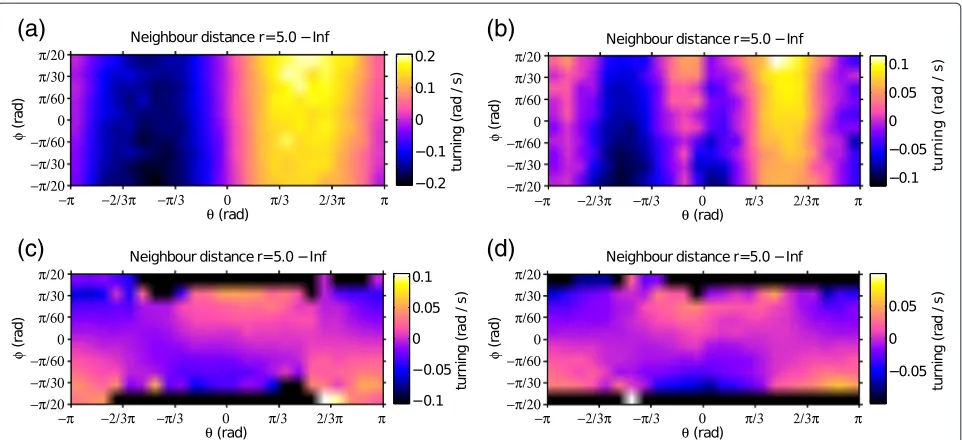
Figure 4 plots the turning angle of the focal individ-ual as a function of the direction of the neighbour (with respect to the moving direction of the focal individual) and relative bearing (difference of alignment). The figure
is limited to the data points for which the focal individ-ual has its neighbour in the attraction zone, i.e. when the mutual distance between the two individuals is larger than the average distance implemented in the trajectories (The Matlab® code that we provide as electronic Additional file 1 has an easy to run interface to plot responses to neighbours both in the attraction and in the repulsion zone, including acceleration responses and responses of individuals having different target positions).
(a)
(b)
[image:6.595.58.539.86.306.2](c)
(d)
Figure 4Relative effect of ‘attraction’ and ‘alignment’.The figures represent the average turning angle of the focal individual in response to the direction (θ) and relative bearing (φ) of the neighbour, limited to situations in which the neighbour is in the attraction zone (at a distancer>5 a.u.). Values ofθclose to zero indicate that the neighbour is in front of the focal individual, with positive values indicating that the neighbour is on the right and negative values indicating that the neighbour is on the left of the focal individual. Positive values along the alignment axisφindicate that the neighbour is oriented to the right, with respect to the focal individual, while the two individuals are aligned for values ofφclose to zero. (a)Condition in which the two particles fly in a front-back configuration.(b)Particles flying side by side;(c)Same condition as(a), but with increased temporal autocorrelation of noise around the target position (CD=100 steps, while it wasCD=20 steps in the previous plots). (d)Same as(b), with increased temporal autocorrelation of noise.
the neighbour is in front and slightly on the left side of the focal individual (θ −π/6), this latter turns to the right, and its response is stronger if the neighbour is also oriented to the right, i.e. in a collision course with the focal individual. It is interesting to observe how the attraction and alignment responses are altered when we increase the temporal autocorrelation of noise. A longer temporal autocorrelation of noise means that if, for exam-ple, an individual is on the left of the trajectory that it is supposed to follow, it will also remain on the left of the trajectory for longer time before returning back to the target position. Under these conditions, the plots of Figure 4-(c) and (d) show a modulation along the align-ment axis (φ). In fact, with correlated noise the particles retain their component of movement parallel to the com-mon trajectory, while their attraction to the target position is comparatively weaker.
It is important to notice that the noise term in our sim-ulations can be interpreted in two different non-exclusive ways. It can correspond to a real movement of animals constantly but imperfectly trying to keep a stable mutual position, but it can also correspond to tracking noise affecting the recorded trajectories of animals that do not move with respect to each other. To illustrate this, imag-ine the situation of two birdsiandjsitting on a boat, such that they both move with respect to an external frame of reference, but the coordinatesXrealij (t) of birdjin the
frame of reference of birdi are fixedXrealij (t) = Const. Because of tracking noise, at any given time t we will record a relative position of the second individual with respect to the first Xrecij (t) = Xrealij + η(t), where the recorded position Xrecij (t) depends on the real position
Xrealij , and η(t)is the displacement introduced by noise. If the noise is not correlated in time, the displacement
η is expected to disappear at previous and subsequent instants of time:Xrecij (t−1)=Xrecij (t+1)=Xrealij . On average over multiple observations, two animals whose recorded position and distance isXrealij +η(t)will revert
to the real mutual positionXrealij and experience a move-ment −η(t) at the subsequent time interval. In such extreme case, the observed interaction responses between neighbouring individuals can completely be described by this ‘regression to the mean’ process, and the ampli-tude of ‘flocking responses’ is in direct proportion to the standard deviation of the noise. Temporal correla-tion in the noise retards this regression to the mean, and appears in the plots as an alignment response, because the autocorrelation preserves the component of move-ment parallel to the common trajectory of the pair, in spite of the fact that the two individuals are in their reciprocal attraction or repulsion zone, i. e. in spite that
A number of recent studies have quantified leadership in collectively moving groups by computing directional cor-relation delays [14]. Directional corcor-relation delays mea-sure the characteristic delay within which one individual becomes aligned with a group neighbour, and it is assumed to indicate leadership behaviour if one individual consistently anticipates the direction taken by other mem-bers of the group. We computed directional correlation delays in our simulated data. When particles move side by side, there is no effect of being on the left or on the right, as we would have expected given the inherent left-right symmetry of the trajectories. When individuals move one behind the other, however, the individual in front appears to change direction first, and to be followed by its part-ner (see Figure 5). Intuitively we can see that when the common trajectory turns in one direction, the individ-ual in front starts immediately turning in that direction, while the individual behind is projected temporarily to the opposite side of the curve. Increasing the temporal auto-correlation of noise does not change this, but it reduces the variability, because when errors on position are corre-lated, the estimation of direction of movement becomes more accurate.
By generating trajectories with three or more individ-uals at a fixed distance from each other, we can test the apparent responses to multiple neighbours. Even if in our simulations the three individuals do not respond to each other, but simply try each to keep a constant dis-tance and orientation relative to the common trajectory, this does not prevent us from studying how apparent
[image:7.595.58.542.528.656.2]responses to multiple neighbours are combined together. Figure 6 plots the observed turning (top row) and accel-eration (bottom row) responses of a focal individual to two neighbours, for the case of three individuals mov-ing in a front-back configuration. For this figure, the focal
individual is randomly chosen between the three possi-ble positions in the group (front, centre, back). The plots on the left in Figure 6 report the average responses of the focal individual as a function of the front-back dis-tance of the first and second neighbour; the plots on the right report the turning and acceleration responses that would be predicted by averaging pairwise interactions, that is, if the response of the focal individual resulted from the average of two independent interactions with indi-vidual neighbours as those presented in the top row of Figure 3 (for comparison with a similar analysis on real fish interactions see Figure three of [10]). The combined responses to two neighbours are similar to those predicted from averaging pairwise interactions, but present larger modulations. This can be explained by considering that the position of all three individuals is affected by noise (or alternatively, that all three individuals can be ran-domly displaced by their target position). Hence, when the position of the focal individual appears to be dis-placed from its target relative to two neighbours, instead of just one, this provides increased evidence that the displacement is to be attributed to the focal individual, and not to the neighbours, and that the focal individual, and not one of the neighbours, is likely to show a com-pensatory response back to the target at the next time step.
Discussion
In our analyses, the relative positioning of individuals, either side by side, or in a front-back configuration is sufficient to reproduce observed differences in the mech-anisms used for collision avoidance, either by changing speed, or through turning. Anisotropic positioning of individuals with respect to their neighbours has been empirically observed in a number of species of collective
Figure 5Directional correlation delay vs. position in the group.Each boxplot represents the distribution of directional correlation delaysτ∗ over simulated trajectories. The box on the left indicates trajectories in which the focal individual was in front; while the box on the right indicates those where the focal individual was behind. In our convention, positive values of the correlation delayτ∗indicate that the focal individual anticipates the changes of direction of its partner. When the individuals fly in a front-back configuration, measures of directional correlation indicate that the individual in front anticipates the turns of its neighbour.LeftIndividuals flying in a front-back configuration, temporal autocorrelation of the noise is short (CD=20 steps); 120 simulated trajectories.RightSame simulation parameters as for the figure on the left, but with longer temporal
Figure 6Observed and predicted responses to multiple neighbours.Top rowObserved (left) and predicted (right) acceleration response in groups of three individuals.Bottom rowObserved (left) and predicted (right) turning responses. Predicted responses are calculated by combining the observed responses in simulations with two individuals (one single neighbour) under the assumption that the combined effect of two neighbours is equal to the average of two independent pairwise responses. White squares in the grids on the left indicate missing values, never occurring in the simulations.
moving animals, from fish [9-11,15] to birds [4,6,12] but it is not explicitly included into most self-propelled particle models of flocking and schooling. Some models involve a blind visual angle: a region of the visual field in which the presence of a neighbour does not induce any move-ment response (e.g. [16,17]), which can be considered as a form of anisotropy. However, these models otherwise consider attraction, alignment and repulsion as depending only on the distance from the neighbour, and not on its direction: interaction responses are organized in concen-tric regions around the focal individual. Outside animal behaviour, self-propelled particle models with anisotropic interaction zones have been studied in the context of collectively moving bacteria and other elongated or differ-ently shaped particles (see e.g. [18,19]). In these systems, the repulsion zone is determined directly by steric occlu-sions, and it can lead to group formations organized in bands (smectic phases) [20]. In order to reproduce empir-ical observations, it seems important that future models of flocking and schooling take explicitly into account the anisotropy of interactions (it is bizarre how the empir-ical work of Ballerini and collaborators [4], one of the first detailed characterisations of anisotropic distribution of neighbours in flocks, triggered a large scientific debate
about the topological - metric nature of interactions, but not about the anisotropy itself ).
neighbours are in their reciprocal attraction or repulsion zones.
The flocking interactions observed in our study repre-sent responses around a fixed point. They describe the continuous adjustments that allow a flock or school to maintain a preferred configuration as the group moves. As such, they are not necessarily informative about when and how navigational decisions are taken: we would observe them even in the extreme case in which individuals have perfect agreement about the route to follow. Our sim-ulations do actually imply such an agreement about a common route, in the sense that both particles follow the common trajectory with similar responses and no conflict. We can speculate that precisely in the presence of navi-gational conflict, the equilibrium of mutual arrangements will be destabilized: interactions with environmental stim-uli interfere with neighbour to neighbour interactions and induce individuals to abandon their mutual relative posi-tions and alignment. This is in part captured by common measures of movement leadership such as the directional correlation delay [14], which implicitly assumes that lead-ers are those individuals that abandon more often their orientation parallel to the neighbour, and followers are those individuals with a higher tendency to restore the aligned group configuration. In our analyses, directional correlation delays correlate with the position in front or on the back of the group. If we do not assume that trajec-tories are pre-imposed, but result from interactions, the individual that moves in front is also the first to draw the common trajectory, and it is reasonable to impute route decisions to this individual.
One of the open problems in research on collective motion is that of determining how individuals combine interactions with multiple neighbours. Here, we have shown that multiple neighbours can carry additional information about the movement of a focal individual not directly because they take part in the interactions, but indirectly because they reduce our uncertainty about the real position of the focal individual. If an animal group maintains a ‘solid-like’ configuration, whereby individu-als keep a constant position relative to their neighbours most of the time, like in our trajectories, the movement of a focal individual can be predicted in terms of its response to a single nearest neighbour, and including information about additional neighbours reduces uncer-tainty, but apart from this does not bring additional infor-mation. This might explain why information theoretical approaches, like the one adopted in [11] indicated that the movement of a focal individual can be predicted to a large amount by looking at only one nearest neigh-bour, and including further neighbours only marginally helped to improve the prediction. It had already been noted [21] that interaction responses cannot be correctly inferred if interactions only take place close to steady-state
positions, as opposed to transient non steady state posi-tions. We are confident that future studies discriminating between interactions around a stable mutual position and transient interactions in which the mutual positions are abandoned will help to further improve our understand-ing of more complex patterns of response to multiple neighbours.
Conclusion
We have illustrated the duality between interaction rules and mutual positions in moving animal groups. The dual-ity can be stated as follows: (1) if the interactions among neighbours are anisotropic, this leads to consistent pat-terns of positioning of an animal relative to its neighbours, and (2) if animals aim at keeping a particular position relative to their neighbours, this can only be achieved through interaction responses with specific anisotropic characteristics.
Our analyses suggest that movement interactions observed and quantified by recent studies on real ani-mal group are largely determined by simple positional adjustments necessary to maintain a preferred local con-figuration of the group, and point to the necessity of discriminating between these interactions around a stable mutual position, and interactions that correspond to real navigational decisions.
Because tracking noise has analogous effects to interac-tions around a stable mutual position, it is important that future empirical studies take explicitly into account the effects of noise based on its amplitude and its temporal correlation patterns.
Methods
Trajectory generation
We generated random trajectories, each having a length
N=212steps. The trajectories are defined by a sequence of step lengths (speed per time step) and a sequence of turnings intercalated between the steps.
The speed values S are numbers extracted from the distribution
S=S0+s 1(
t)
max|1|
(1)
and the turning anglesTare
T =a 2(t)
max|2|
(2)
to both sequences a low-pass temporal frequency filter with equation
(t)=exp
−ω(t)2
2σ2
(3)
whereωare temporal frequencies andσ controls the fil-ter standard deviation. By settingσ = CN
T, with a cut-off period for the temporal correlationsCT = 300 steps we
impose that speed and turning fluctuations typically occur over a period of 300 time steps, or longer. In our simula-tions, we fix arbitrarilyS0= 5 ands=0.2 arbitrary units (a.u.) per time step anda = 0.02 radians per time step. We further assume that 5 time steps in the trajectory cor-respond to one second of time. Our results are intended to illustrate qualitative differences in the observed pat-terns of movement, which remain stable for wide ranges of arbitrary parameters.
The positions of individuals along the trajectory at time
tare determined by first drawing the segment that inter-sects the trajectory attand having a specific orientationθ relative to the segment of trajectory betweentandt+1, and selecting equally spaced points (at distancer=5 a.u. from each other) on this segment. These individual tra-jectories represent the movement of an hypothetical focal individual and its partner (and in some simulations of a third individual) which successfully keep a constant dis-tance and relative position to each other while moving together.
The ‘recorded’ positions of the individuals do not match exactly those generated as above, but are displaced in a random direction at every time step, to simulate track-ing noise, or an imperfect ability to maintain the desired flocking configuration. These displacements are autocor-related in time, so that if an individual is for instance on the left of its target position at time t, it is more likely to be on the left of the target position also at timet+1. There is no cross-correlation between the random dis-placements of the focal individual and those of its neigh-bour. The random displacements are computed as follows. We first generate series ofNrandom numbers, normally distributed with mean 0 and standard deviation 1, then we apply a low-pass filter analogous to the one used in Equation 3, with cut-off frequencyσd = CND, whereCDis
the cut-off correlation period for displacements (the num-ber of time steps after which the displacements become uncorrelated). In our simulationsCD = 20 steps except
when otherwise stated. After the filtering operation, we rescale the numbers to obtain distributions with standard deviationr/2. Two random numbers taken from two such generated series describe the x and y components of the displacement.
The analyses reported in the present manuscript focus on the comparison of two conditions. In the first condi-tion the focal individual has a target posicondi-tion directly in
front or behind its neighbour (θ =0). In the second con-dition, the target position for the focal individual is on the side of its neighbour (θ = π/2). For each condition, we generate 100 random trajectories. The order of individuals along the segment, that is, whether the focal individual is in front or behind its neighbour (respectively left or right whenθ =π/2) is constant for the whole length of one tra-jectory, but changes randomly from one trajectory to the other, with half of the trajectories on average displaying the focal individual on the left and the other half display-ing it on the right. The movement responses observed in all trajectories are merged together for the analyses.
Data analysis
At each time steptwe measure the instantaneous speed of the focal individual
s(t)=
(x(t)−x(t−1))2+(y(t)−y(t−1))2/dt,
wherex(t)andy(t)are thexandycoordinates of the focal individual at timetanddtis the duration of a time step. The direction of movement of the focal individual is
ψ(t)=atan2(y(t)−y(t−1),x(t)−x(t−1)), .
The response of the focal individual to its neighbours is described by its tangential acceleration
a(t)=(s(t)−s(t−1)) /dt
and its speed of direction change
α(t+1)=(ψ(t)−ψ(t−1)) /dt,
where care is taken to compute the correct angular differ-ence, ψ(t)−ψ(t−1), with regard to the periodicity of ψ(t).
The relative position and orientation of a neighbour in the frame of reference of the focal individual are described by their observed mutual distance
dij(t)=
xj(t)−xi(t) 2+
yj(t)−yi(t) 2,
and the direction θ of the neighbour in the frame of reference of the focal fish was
ϑij(t)=atan2yj(t)−yi(t),xj(t)−xi(t) −αi(t).
The directional correlation delayτ∗is the time delayτ that maximizes the correlation of direction between the focal individual and its partner
τij∗=arg max
τ
cosψi(t)−ψj(t+τ)
Additional file
Additional file 1: Compressed folder containing all the Matlab® script files required to repeat the analyses reported in this paper.
Competing interests
The authors declare that they have no competing interests.
Authors’ contributions
AP and RPM designed the research. AP performed the research. GG contributed ideas and tools for the analyses. AP wrote the paper. All authors read and approved the final manuscript.
Acknowledgements
This work was supported by European Union Information and Communication Technologies project ASSISIbf601074. AP was supported by the city of Paris (Research in Paris programme) and the Ile de France region (grant 01RA140024-RIDF-PERNA). The funders had no role in study design, data collection and analysis, decision to publish, or preparation of the manuscript.
Author details
1Paris Interdisciplinary Energy Research Institute, Paris Diderot University, 10 rue Alice Domon et Léonie Duquet, 75013 Paris, France.2Laboratoire Matiere Systemes Complexes, Paris Diderot University, 10 rue Alice Domon et Léonie Duquet, 75013 Paris, France.3Mathematics Department, Uppsala University, Lägerhyddsvägen 1, 75754 Uppsala, Sweden.4Chair of Sociology, in particular of Modeling and Simulations, ETH Zürich, Clausiusstrasse 50, 8092 Zürich, Switzerland.
Received: 7 May 2014 Accepted: 2 October 2014
References
1. Reynolds CW:Flocks, herds and schools: A distributed behavioral model.SIGGRAPH Comput Graph1987,21(4):25–34.
2. Vicsek T, Zafeiris A:Collective motion.Phys Rep2012,517:71–140. 3. Sumpter DJT, Mann RP, Perna A:The modelling cycle for collective
animal behaviour.Interface Focus2012. doi:10.1098/rsfs.2012.0031. http://rsfs.royalsocietypublishing.org/content/early/2012/08/09/rsfs. 2012.0031.full.pdf+html
4. Ballerini M, Cabibbo N, Candelier R, Cavagna A, Cisbani E, Giardina I, Lecomte V, Orlandi A, Parisi G, Procaccini A, Viale M, Zdravkovic V: Interaction ruling animal collective behaviour depends on topological rather than metric distance: Evidence from a field study.
Proc Nat Acad Sci USA2008,105(4):1232–1237. arXiv/0709.1916. 5. Bialek W, Cavagna A, Giardina I, Mora T, Silvestri E, Viale M, Walczak AM:
Statistical mechanics for natural flocks of birds.Proc Nat Acad Sci USA
2012,109(13):4786–4791. doi:10.1073/pnas.1118633109. http://www. pnas.org/content/109/13/4786.full.pdf+html
6. Lukeman R, Li Y-X, Edelstein-Keshet L:Inferring individual rules from collective behavior.Proc Nat Acad Sci USA2010,107(28):12576–12580. doi:10.1073/pnas.1001763107. http://www.pnas.org/content/107/28/ 12576.full.pdf+html
7. Buhl J, Sword GA, Simpson SJ:Using field data to test locust migratory band collective movement models.Interface Focus2012,2(6):757–763. doi:10.1098/rsfs.2012.0024. http://rsfs.royalsocietypublishing.org/ content/2/6/757.full.pdf+html
8. Romanczuk P, Couzin ID, Schimansky-Geier L:Collective motion due to individual escape and pursuit response.Phys Rev Lett2009, 102:010602. doi:10.1103/PhysRevLett.102.010602.
9. Hemelrijk CK, Hildenbrandt H, Reinders J, Stamhuis EJ:Emergence of oblong school shape: Models and empirical data of fish.Ethology
2010,116(11):1099–1112. doi:10.1111/j.1439-0310.2010.01818.x. 10. Katz Y, Tunstrøm K, Ioannou CC, Huepe C, Couzin ID:Inferring the
structure and dynamics of interactions in schooling fish.Proc Nat Acad Sci USA2011,108(46):18720–18725. doi:10.1073/pnas.1107583108. 11. Herbert-Read JE, Perna A, Mann RP, Schaerf TM, Sumpter DJT, Ward AJW: Inferring the rules of interaction of shoaling fish.Proc Nat Acad Sci USA2011,108(46):18726–18731. doi:10.1073/pnas.1109355108.
12. Pettit B, Perna A, Biro D, Sumpter DJT:Interaction rules underlying group decisions in homing pigeons.J R Soc Interface2013,10(89). doi:10.1098/rsif.2013.0529. http://rsif.royalsocietypublishing.org/content/ 10/89/20130529.full.pdf+html
13. Gautrais J, Ginelli F, Fournier R, Blanco S, Soria M, Chaté HH, Theraulaz G: Deciphering interactions in moving animal groups.PLoS Comput Biol
2012,8(9):1002678. doi:10.1371/journal.pcbi.1002678.
14. Nagy M, Akos Z, Biro D, Vicsek T:Hierarchical group dynamics in pigeon flocks.Nature2010,464(7290):890–893. doi:10.1038/nature08891. 15. Partridge BL, Pitcher T, Cullen JM, Wilson J:The three-dimensional
structure of fish schools.Behav Ecol Sociobiol1980,6(4):277–288. 10.1007/BF00292770.
16. Couzin ID, Krause J, James R, Ruxton GD, Franks NR:Collective memory and spatial sorting in animal groups.J Theor Biol2002,218(1):1–11. 17. Strombom D:Collective motion from local attraction.J Theor Biol2011,
283(1):145–151. doi:10.1016/j.jtbi.2011.05.019.
18. Peruani F, Deutsch A, Bär M:Nonequilibrium clustering of self-propelled rods.Phys Rev E2006,74:030904. doi:10.1103/PhysRevE.74.030904.
19. Wensink HH, Kantsler V, Goldstein RE, Dunkel J:Controlling active self-assembly through broken particle-shape symmetry.Phys Rev E
2014,89:010302. doi:10.1103/PhysRevE.89.010302.
20. Wensink HH, Löwen H:Emergent states in dense systems of active rods: from swarming to turbulence.J Phys Condens Matter2012, 24(46):464130.
21. Mann RP:Bayesian inference for identifying interaction rules in moving animal groups.PLoS One2011,6(8):22827.
doi:10.1371/journal.pone.0022827.
doi:10.1186/s40462-014-0022-5
Cite this article as:Pernaet al.:On the duality between interaction responses and mutual positions in flocking and schooling.Movement Ecology20142:22.
Submit your next manuscript to BioMed Central and take full advantage of:
• Convenient online submission
• Thorough peer review
• No space constraints or color figure charges
• Immediate publication on acceptance
• Inclusion in PubMed, CAS, Scopus and Google Scholar
• Research which is freely available for redistribution