White Rose Research Online URL for this paper: http://eprints.whiterose.ac.uk/81785/
Version: Accepted Version
Article:
Bruine de Bruin, W, van der Klaauw, W, Topa, G et al. (3 more authors) (2012) The effect of question wording on consumers' reported inflation expectations. Journal of Economic Psychology, 33 (4). 749 - 757. ISSN 0167-4870
https://doi.org/10.1016/j.joep.2012.02.001
[email protected] https://eprints.whiterose.ac.uk/ Reuse
Unless indicated otherwise, fulltext items are protected by copyright with all rights reserved. The copyright exception in section 29 of the Copyright, Designs and Patents Act 1988 allows the making of a single copy solely for the purpose of non-commercial research or private study within the limits of fair dealing. The publisher or other rights-holder may allow further reproduction and re-use of this version - refer to the White Rose Research Online record for this item. Where records identify the publisher as the copyright holder, users can verify any specific terms of use on the publisher’s website.
Takedown
If you consider content in White Rose Research Online to be in breach of UK law, please notify us by
Running head: Inflation expectations
The effect of question wording
on consumers’ reported inflation expectations
Accepted for publication in Journal of Economic Psychology (2012)
Wändi Bruine de Bruin,a,b,* Wilbert Van der Klaauw,c Giorgio Topa,c Julie S. Downs,a
Baruch Fischhoff,a,b and Olivier Armantier c
a
Carnegie Mellon University, Department of Social and Decision Sciences 5000 Forbes Avenue, Pittsburgh PA 15213
a
Carnegie Mellon University, Department of Engineering and Public Policy
5000 Forbes Avenue, Pittsburgh PA 15213 c
Federal Reserve Bank New York, Research and Statistics Group
33 Liberty Street, New York NY 10045
* Corresponding author. Please direct correspondence to Wändi Bruine de Bruin, Carnegie Mellon University, Department of Social and Decision Sciences, 5000 Forbes Avenue, Porter Hall 208, Pittsburgh PA 15213, [email protected] (email), x1-412-268-3237 (phone), x1-412-268-x1-412-268-3237 (fax). The views expressed are those of the authors and do not necessarily reflect those of the Federal Reserve Bank of New York or the Federal Reserve System.
Abstract
Economists and policy makers increasingly consult national household surveys
asking individuals about their economic circumstances, financial decisions, and
expectations for the future. For decades, the Reuters/Michigan Survey of Consumers and other national surveys have asked about expectations for “prices in general,” with
responses being used by academic economists, policy makers, and central bankers. Although median responses track official inflation estimates, respondents exhibit
considerable disagreement, with some reporting seemingly large overestimations. Here, we demonstrate that changes in the wording of survey questions about inflation
expectations affect the central tendency of responses as well as their dispersion. We randomly assigned respondents to questions asking about “prices in general,” “inflation,”
or “prices you pay.” Respondents’ expectations and perceptions were lower and less
dispersed when questions asked about “inflation” instead of “prices in general” or “prices you pay,” with the latter two formulations eliciting similar response patterns. These
question-wording effects were mediated by how much respondents thought of (extreme) personal price experiences when receiving questions about “prices in general” or “prices you pay.” Compared to questions about “inflation,” questionsabout “prices in general” and “prices you pay” elicited expectations that were more strongly correlated to expected
Key words:
Inflation expectations, Question design, Consumer surveys
Research highlights:
We show that question wording affects responses to inflation surveys.
Inflation surveys often ask people for their expectations for “prices in general.”
We asked questions about “prices in general,” “inflation,” or “prices you pay.”
Questions about “inflation” yielded lower expectations and less disagreement.
Questions about “inflation” also reduced thoughts of large price changes.
1. Introduction
Economists increasingly use national household surveys to elicit individuals’
beliefs about their economic circumstances, as well as related expectations and decisions. Economic surveys can provide information that is useful in terms of predicting
individuals’ future behavior, beyond what can be deduced from observable measures
(Hurd, 2009; Manski, 2004). The usefulness of economic surveys depends in part on how well questions are understood by respondents. Shorter questions and simpler
wording make responding easier and reduce “don’t know” responses (Basili & Scott, 1996; Knäuper et al., 1997; Yan & Tourangeau, 2008). However, seemingly irrelevant
changes in question wording can influence people’s interpretations of a question (Bruine de Bruin, 2011; Schwarz, 1999). For example, people are more willing to endorse a policy to “not allow” a behavior rather than to “forbid” it (Holleman, 1999), and to
estimate different speeds for cars “colliding” or “hitting” each other in a previously watched video-taped accident (Loftus & Palmer, 1974). Hence, it is important to better
understand the potential effect of wording on responses before implementing questions on national economic surveys.
Here, we examine the effect of wording on consumers’ interpretations of and
responses to a widely used question about expectations for future inflation. Inflation expectations are widely believed to affect people’s economic decisions about saving,
inflation expectations, in combination with market-based measures, model-based forecasts and surveys of professionals.
For decades, survey measures of inflation expectations, collected by the Reuters/Michigan Survey of Consumers (henceforth: the Michigan survey), as well as
other national surveys, have formulated these questions in simple terms, asking
respondents for expected changes in “prices in general.” Yet, to date, relatively little is known about how this choice of wording affects how people interpret the question and
generate their responses.1
Median responses to survey questions about inflation expectations generally track
actual inflation, and sometimes outperform professional and model-based forecasts in predicting actual inflation (Ang et al., 2007; Hafer & Hein, 1985; Thomas 1999). Yet, there tends to be considerable disagreement among respondents, with some expecting
seemingly high inflation (Bates & Gabor, 1986; Bruine de Bruin et al., 2010; Bryan & Venkatu, 2001). Because price changes are not uniform across product categories, variations in individuals’ consumption patterns could partially explain variations in their
inflation expectations (Ranyard et al., 2008; Hafer & Hein, 1985). However, previous work also suggests that the disagreement in responses may reflect variations in how
respondents interpret the Michigan Survey question about “prices in general.” That is, some seem to interpret that question as asking about prices they personally pay, while
others recognize it as asking about the U.S. inflation rate (Bruine de Bruin et al., 2010), a concept with which members of the general public have some familiarity (Leiser and Drori, 2005; Svenson & Nilson, 1986; Williamson & Wearing, 1996).
1 Jungermann et al. (2007) did examine the effect of response modes on reported price changes for specific
Moreover, responses to the Michigan Survey’s “prices in general” question vary depending on what respondents think of when generating their answers .Respondents
who think relatively more about their personal price experiences than about the U.S. inflation rate report significantly higher expectations (Bruine de Bruin et al., 2010),
because experiences with large price changes (such as for gas and transportation) are most likely to come to mind (Bruine de Bruin, van der Klaauw, & Topa, 2011). These results are in line with research finding that extreme events are more memorable
(Morewedge, Gilbert, & Wilson, 2005), and that price increases are often noticed more than price decreases (Jungermann, Brachinger, Belting, Grinberg, & Zacharias, 2007;
Kahneman & Tversky, 1979). If questions that directly ask about expected “inflation” focus respondents less on their personal price experiences, they should evoke lower responses than questions that ask about expectations for “prices in general.”
In the present research, we test this hypothesis by randomly assigning respondents to answering questions about “prices in general,” “inflation,” or “prices you pay.” We
examine how these variations in question wording affect reported expectations, thoughts about personal price experiences, the relationship of reported expectations to salient changes in specific prices, as well as ratings of question clarity and ease of responding.
2. Materials and Methods 2.1. Sample
We conducted an Internet survey with RAND’s American Life Panel (ALP). Its members were recruited from 2007 respondents to the Michigan Survey, who were
access were offered a Web TV. A total of 815 ALP members completed our survey questions. Of those,2 54.2% of respondents reported being female, 87.7% being white,
66.0% being married or living with a partner, 61.7% having completed education beyond high school, and 55.4% receiving at least $75k in household income. Median age was 48
years old (M=47.7, SD=14.3).
2.2. Procedure
Our web-based survey was available between May 29, 2008, and November 5, 2008, with 45.7% of respondents completing it by May 31, 2008, and 89.1% by June 30,
2008.Following the Michigan Survey protocol, respondents first answered questions about their financial situation and perceived business conditions. Next, respondents were asked to report their expectations for “prices in general,” “inflation,” or “prices you pay”
for the next 12 months, and for the next 5 to 10 years (Section 2.2.1). After answering the second question, they indicated how difficult it was to generate their answer, how clear
the question was, and how they interpreted it (Section 2.2.2). Subsequently, they reported past-year perceptions of “prices in general”,“inflation,” or “prices you pay” (Section 2.2.1) and again indicated the question’s difficulty, clarity, and interpretation (Section
2.2.2). Respondents also answered demographic questions (Section 2.2.3). Respondents received $20 for answering the entire survey, which included the questions analyzed here,
2
and took on average 35 minutes to complete. Those who skipped questions received prompts encouraging them to respond.
2.2.1. Question wording. Respondents were randomly assigned to answer questions about (a) “prices in general” (n=281), (b) “inflation” (n=257), or (c) “prices you pay” (n=277). The assigned wording was used for three consecutive questions,
asking about expectations for the year ahead, expectations for the next 5 to 10 years, and perceptions of the past year.
First, respondents who received questions about “prices in general” followed the Michigan Survey’s protocol. Following the protocol outlined in Table 1, respondents
were first asked for their expectations of the year ahead. Respondent indicated whether they thought prices would “go up, go down, or stay the same” (q1a), with a follow-up question asking respondents who said “stay the same” asking whether they meant “will
go up at the same rate” or “will not go up” (q1b). Those who expected prices to go up or
to go down were asked for the percent change, expressed as a point estimate or a range
(q2a). Those who responded with a range were prompted for a point estimate (q2b).3 Those who gave point estimates over 5% were given the opportunity to revise their response (q2c-d). Subsequently, respondents gave their longer-term expectations (e.g., “Do you think prices in general will be higher, about the same, or lower, 5 to 10 years
from now?”) and their past-year perceptions (e.g., “During the past 12 months, do you
think that prices in general went up, or went down, or stayed about the same?”). The structure of follow-up questions was similar to the one used for the year-ahead
expectations (Table 1). However, as in the Michigan Survey, the opportunity to revise
responses (Q2c in Table 1) was different for long-term expectations: “Would that be
[x%] per year, or the total for prices over the next 5 to 10 years?” All of our respondents received this opportunity, even though the Michigan Survey offers it only to respondents
who report point estimates over 5%.
Second, respondents who received questions about “inflation” also considered
three time horizons (e.g., the next 12 months, the next 5 to 10 years, and the past 12 months). For each time horizon, the “inflation” question used the very same logical structure as the “prices in general” question (Table 1). The first question about the year
ahead started with “Over the next 12 months, do you think that there will be inflation, deflation (the opposite of inflation), or neither?” with a follow-up question asking about
the magnitude of expected inflation or deflation.
Third, respondents who received questions about the “prices you pay” considered the same three time horizons, (e.g, the next 12 months, the next 5 to 10 years, and the
past 12 months). These questions were based on the Michigan question, replacing “prices in general” with “the prices of things you usually spend money on” (Table 1).
2.2.2. Question clarity and ease of responding. Ratings of question clarity and ease of responding were provided twice, after answering the question about expectations for the next 5 to 10 years, and after answering the question about past-year perceptions.
Each time, participants rated the question they received (about “prices in general,”
“inflation,” or “prices you pay”), answering “how clear was the question in terms of what
it was asking about?” on a scale ranging from 1 (=very unclear) to 7 (=very clear), and “how hard was it to come up with an answer to this question”, on a scale ranging from 1
(=very easy) to 7 (=very hard). The latter ratings were reverse-coded in our analyses so
2.2.3. Question interpretation. Respondents reported their question
interpretations twice, after answering the question about expectations for the next 5 to 10
years, and after answering the question about past-year perceptions. For example, they were asked “When you received the question about ‘prices in general during the next 5 to 10 years,’ what did you think it was asking for the most? Please check the one option that
best describes what you thought the question was asking for.” Respondents could select from ten response options, including three focal ones: (a) “the prices of things you usually spend money on,” (b) “the U.S. inflation rate,” and (c) “how to cover expenses in the next year.” They also rated “how much you thought of each of these things, when
trying to come up with an answer,” on a scale from 1 (=not at all) to 7 (=very much).
Following our previous work (Bruine de Bruin et al., 2010), our analyses only focus on the latter ratings of the three focal interpretations.
2.2.4. Expectations for specific prices. Respondents first indicated the specific prices they paid for the most. They were asked “From the following list of seven items,
please check the top three items in your yearly spending budget” with response options
including (a) housing costs, which includes mortgage or rent, maintenance, and utilities,
(b) food, which includes groceries, dining out, and beverages, (c) clothing, (d)
transportation, which includes gas, public transportation fares, and car maintenance, (e) health care, (f) recreation and entertainment, (g) education and child care. We then asked
respondents to report their year-ahead expectations for the prices of food, housing costs, and the largest item in their yearly spending budget other than food or housing. These
2.2.5. Respondent characteristics. During their initial enrollment into RAND’s American Life Panel, respondents had already reported their gender, highest level of
education, and the total combined income for all members of their family (living in their household) over the past 12 months, defined as including “money from jobs, net income
from business farm or rent, pensions, dividends, interest, social security payments, and any other money income received by members of their family who are 15 years of age or older,” selecting from 14 categories ranging from “less than $5,000” to “$75,000 or more.” Prior to our survey, they had also already answered questions that measured their
financial literacy, including their understanding of concepts related to inflation (Bruine de
Bruin et al., 2010).
3. Results
3.1. Effects of question wording on reported expectations and perceptions
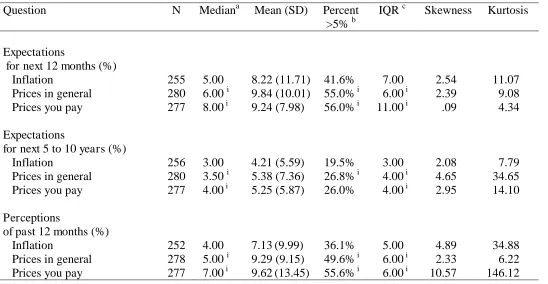
Table 2 shows descriptive statistics for responses to questions about “inflation,” “prices in general,” and “prices you pay,” as reported for the three time horizons (the next
12 months, the next 5 to 10 years, and the past 12 months). Distributions showed
positive skewness, indicating that means were higher than medians, and positive kurtosis,
suggesting relatively long tails. Given these departures from normality, we used the Mann-Whitney (M-W) test, a nonparametric alternative to the t-test (Siegel and
Castellan, 1988) to examine question-wording effects on reported expectations. We also used chi-square tests to examine question-wording effects on whether or not responses were over 5%.4
4 Following previous work (Bruine de Bruin et al., 2010; 2011), we used 5% as a threshold for seemingly
First, reported expectations were significantly higher for questions about “prices in general” than for questions about “inflation” for the next 12 months, whether analyzing
the continuous variable (M-W z=-3.42, p<.001) or the dichotomous variable indicating whether responses were over 5% ( 2=9.64, p<.01). The same pattern held for the next 5 to
10 years (M-W z=-2.12, p<.05; 2=3.94, p<.05), and for past-year perceptions (M-W z=-4.46, p<.001; 2=9.86, p<.05). Second, questions about “prices you pay” elicited
significantly higher responses than those about “inflation,” for the next 12 months (M-W
z=-3.87, p<.001; 2=11.00, p<.001) for the next 5 to 10 years (M-W z=-3.19, p<.001; 2
=2.80, p<.10), and in past-year perceptions (M-W z=-5.52, p<.001; 2=20.15, p<.001).
Third, we did not find differences between responses to questions about “prices in general”and “prices you pay” (all p>.10).5
Further inspection found that question wording also affected how much
respondents disagreed, as seen in interquartile ranges (IQRs)6 of their responses, with larger IQRs for questions about “prices in general”and “prices you pay” than for
questions about “inflation.” To test for differences in dispersion, we used the Fligner-Killeen F test, which compares ranked absolute deviations from sample medians observed for each question wording (Fligner & Killeen, 1976). First, we found more
dispersion with the “prices in general” questions than with the “inflation” questions across all time horizons: the next 12 months (F(1,533)=7.39, p<.01), the next 5 to 10
expectations over 5% an opportunity to revise their answer, suggesting that such responses are seen as suspect (Curtin 1996), (2) the CPI has not been above 5% since 1990 (Bryan and Venkatu, 2001) and (3) median inflation expectations have not been above 5% since the mid-1980s (Bryan and Venkatu, 2001).
5
A repeated-measures multivariate analysis of variance (MANOVA) on reported expectations across the three time horizons found no systematic interaction of question wording and whether respondents had low (vs. high) financial literacy (p>.10), as measured through the questions presented in Bruine de Bruin et al. (2010), suggesting that question-wording effects were similar for respondents varying in financial literacy levels.
6IQRs are commonly used to evaluate disagreement in respondents’ inflation expectations, because they
years (F(1,534)=4.60, p<.05), and the past 12 months, (F(1,528)=16.13, p<.001). Second, we found more dispersion for “prices you pay” than for “inflation” across all time
horizons: the next 12 months (F(1, 530)=7.63, p<.01), the next 5 to 10 years (F(1, 531)=7.85, p<.01), and the past 12 months (F(1, 527)=22.37, p<.001). Third, there were
no significant differences in the dispersion between responses to questions about “prices in general” versus “prices you pay” (p>.10).
3.2. Effects of question wording on question interpretation
Table 3 shows how much respondents indicated thinking of “prices of things you usually spend money on,” “how to cover expenses” and “the U.S. inflation rate,” when
answering questions about “inflation,” “prices in general” or “pricesyou pay.”
Bonferroni tests examined the effect of question wording on how much respondents
thought of these topics (Table 3). For both time horizons, questions about “inflation” elicited more thinking of “the U.S. inflation rate” and less thinking of “prices of things
you usually spend money on,” compared to questions about “prices in general” and
“prices you pay.” Additionally, questions about “prices you pay” focused respondents
even more on “prices of things you usually spend money on” than did questions about “prices in general.” How much respondents thought about “how to cover expenses” did
not differ significantly between the three questions.
Hence, question wording affected how much respondents thought of “the U.S. inflation rate” versus “prices of things you usually spend money on.” Sobel tests
examined whether each of these two question interpretations mediated question-wording
model that included both question interpretations (Baron & Kenny, 1986; Preacher & Hayes, 2008). 7 How much respondents thought about “the prices of things you usually spend money on” significantly mediated question-wording effects on reported past-year
perceptions (Sobel z=2.58, p<.05; Bootstrapping 95% CI .21-.80), and marginally for
expectations for the next 5 to 10 years (Sobel z=1.80, p=.07; Bootstrapping 95% CI=.01-.40). For the dichotomous responses (split at 5%), bootstrapping tests found significant mediation by thoughts of “the prices of things you usually spend money on” for the effect
of question wording on expectations over the next 5 to 10 years (95% CI=.02-.19) and for the past year (95% CI=.05-.20). How much respondents thought about the “U.S.
inflation rate” did not mediate the reported question-wording effects (p<.10).
3.3. Effects of question wording on the relationship between overall price expectations
and expectations for specific prices.
Across all respondents, expectations for percent change in prices were much
higher for gas (Mdn=10.00, M=14.87, SD=16.01) than for food (Mdn=5.00, M=9.27, SD=35.71; Wilcoxon z=-13.88, p<.001) or for housing (Mdn=1.00, M=1.84, SD=8.60;
7
Mediation was demonstrated in the following three steps, conducted on the continuous variable (Baron &
Kenny, 1986; Preacher & Hayes, 2008). First, questions asking about “prices in general” or “prices you pay” (rather than “inflation”) yielded significantly higher responses (B=1.10, se=.48, t(811)=2.29, p<.05
for the next 5 to 10 years; B=2.32, se=.84, t=2.77, p<.01 for the past year). Second, these question wordings also increased how much respondents thought of “prices of things you usually spend money on” (B=-.50, se=.14, t(808)=-3.67, p<.001 for the next 5 to 10 years; B=.50, se=.10, t=5.03, p<.001 for the past year), while at the same time decreasing how much respondents thought of the “U.S. inflation rate” (B=.52, se=.10, t(808)=5.06, p<.05 for the next 5 to 10 years; B=-.85, se=.15, t=-5.81, p<.001). Third, adding how much respondents reported thinking of these two topics to a regression model predicting responses from question wording reduced the magnitude of question wording-effects (B=.83 se=.49 t(807)=1.69, p<.10 for the next 5 to 10 years; B=2.00, se=.86, t=2.31, p<.05 for the past year), due to significantly higher
responses being given by respondents who thought more of the “prices of things you usually spend money on” (B=.32, se=.16, t(807)=1.92, p=.05 for the next 5 to 10 years; B=.89, se=.30, t=2.99, p<.01 for the past
year), with thinking of “the U.S. inflation rate” making little to no additional difference (B=-.21, se=.12, t(807)=-1.71, p<.10 for the next 5 to 10 years; B=.14, se=.20, t=.69, p>.10 for the past year). Mediation
Wilcoxon z=-18.92, p<.001), as shown by the Wilcoxon test, which is a non-parametric version of the paired-samples t-test.8 These year-ahead expectations for food, housing,
and gas did not significantly differ between question-wording conditions (p>.05). During the 12 months leading up to our survey, gas prices had indeed exhibited especially high
increases (8.1%), as compared to food prices (5.0%) and housing costs (3.3%), or the overall CPI of 4.2% (Bureau of Labor Statistics, 2008).
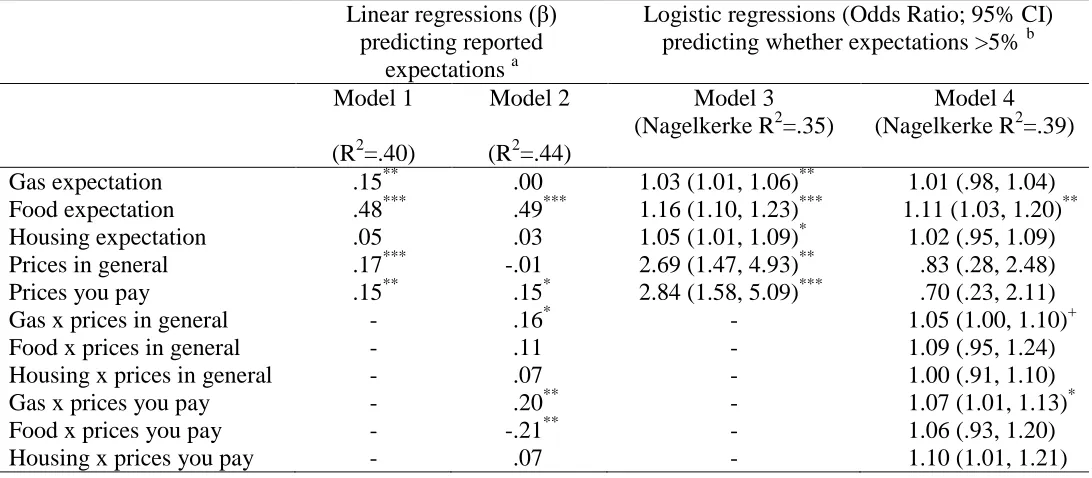
The left side of Table 4 shows linear regressions predicting the continuous
variable of expectations for overall prices from expectations for specific prices (i.e., gas, food, and housing) and from question wording (i.e., “prices in general” and “prices you pay” vs. “inflation). The right side of Table 4 shows logistic regressions predicting
whether or not overall price expectations were over 5% from the same variables. Model 1 shows that overall price expectations were significantly higher among respondents who
had higher expectations for gas and food prices, and who answered questions about “prices in general” or “prices you pay” rather thanabout “inflation.” Model 3 shows
similar results with a logistic regression predicting whether overall price expectations were over 5%, and expectations for housing costs having an additional positive relationship with overall price expectations.
Models 2 and 4 add interaction effects, with one interaction reaching significance in both models, suggesting that responses to questions about “prices in general” and “prices you pay” were more strongly related to expectations for gas prices than were responses to questions about “inflation.” This pattern was supported by separate linear
8The most commonly mentioned items in the top three of respondents’ spending budget were food
regressions for each question wording, showing that gas expectations have a significant positive relationship with overall expectations of “prices in general” ( =.20, p<.01) and
of “prices you pay” ( =.31, p<.001), but not of “inflation”( =.03, p>.10). Separate logistic regressions for each question wording also showed that higher expectations for
gas prices increased the likelihood of reporting expectations over 5% for “prices in general” (Odds Ratio=1.06, 95% CI=1.02 – 1.12, p<.01) and for “prices you pay” (Odds
Ratio=1.08, 95% CI=1.03 - 1.13, p<.01) but not for “inflation” (Odds Ratio=1.01, 95%
CI=.98 - 1.03, p>.10).
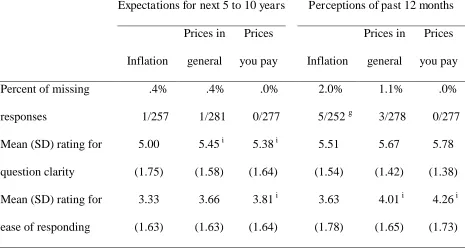
3.4. Effects of question wording on percent of missing responses, rated question clarity and rated ease of responding.
As seen in Table 5, there were very few missing responses, perhaps due to our
respondents receiving prompts to answer each question they tried to skip. Table 5 also shows ratings of clarity and ease of responding. When comparing these variables across
question pairs, only one systematic difference emerged in each time horizon (next 5 to 10 years; past 12 months). A post-hoc Bonferroni test found that respondents rated
questions about “prices you pay” as somewhat easier to answer than questions about “inflation.”
4. Discussion
as well as more disagreement than did questions about “inflation.” These patterns emerged for expectations about the year ahead and the next 5 to 10 years, as well as
perceptions for the past year. Questions about “prices in general” and “prices you pay” evoked similarly high responses due to their similar interpretations.
Slight changes in question wording can affect how respondents interpret a question and generate their answer. Questions about “prices in general” and “prices you pay” focused respondents more on personal price experiences than did questions about
“inflation.” Such thoughts about personal price experiences tend to be biased towards
extremes, such as large changes in gas prices, leading respondents to overestimate overall
inflation (Bruine de Bruin et al., 2011; Jungermann et al., 2007). Indeed, questions about “inflation” were less likely to focus respondents on gas prices, which had been exhibiting
especially large increases at the time of the survey (Bureau of Labor Statistics, 2007;
2008).
Our survey was fielded at a time of relatively high overall inflation, when specific
increasing prices may be especially salient. We have replicated the reported wording effects at other points in time and with questions about different time horizons,
suggesting that responses to questions about expectations of “prices in general” tend to be higher than responses to questions about “inflation.”9 Effects of question wording may
nevertheless be stronger at times of relatively high actual inflation, when price changes
are most variable, and some specific prices show steeper and perhaps more salient increases. At those times, questions about “prices in general” and “prices you pay,” which draw more attention to increasing prices, may elicit especially high responses.
9 To improve readability, these results have been removed from this paper. For more information, please
Moreover, if the specific prices that exhibit large increases vary over time (e.g., in one year gas prices may increase more, in another year housing costs may increase more),
then responses to questions about “prices in general” and “prices you pay” will be driven by prices of different goods at different times. As a result, responses to these questions
will be less comparable over time than responses to questions about “inflation.” Respondents’ focus on larger price increases may be exacerbated by the media,
which tend to pay more attention to bad economic news, affecting public perceptions
even after controlling for actual economic conditions (Goidel & Langley, 1995).
Respondents may additionally have paid more attention to changes in gas prices because
they pay for them relatively frequently (Brachinger, 2008; Flug & Stix, 2005; Jungerman et al., 2007), an explanation not explicitly explored in this study.
Although questions about “inflation” may evoke more reasonable responses, they
may be somewhat more difficult to answer. That difficulty did not result in higher non-response rates, perhaps because our web-based survey provided systematic prompts to
discourage respondents from skipping questions. Face-to-face or telephone interviews may lead to a higher rate of missing responses (Fricker et al., 2005; Link & Mokdad, 2005), especially with harder questions about “inflation.”
Overall, these results support asking directly about “inflation”, rather than about “prices in general” (as in the Michigan Survey), or about “prices you pay” (a plausible
alternative.) However, different formulations may be useful for different purposes. Questions about “inflation” appear to yield responses that are less sensitive to specific
prices, and may be more useful for macroeconomic models. However, if one wants to
question about “prices” may be better. Moreover, different question formulations may
capture expectations that are relevant to different consumer behaviors. It is possible that
expectations for “inflation” are more central to people’s investment decisions, whereas expectations for “prices you pay” and associated thoughts about extreme changes in
specific prices affect their purchasing decisions. Questions about “prices in general” seemed to evoke some of both perspectives, hence may be less desirable than either alternative, by virtue of producing muddled responses.
Designers of economic surveys may prefer to elicit expectations for both “inflation” and “prices,” examining their changes over time, as well as their role in
consumers’ decision making. Asking both versions may be beneficial to survey
designers who have already been asking about expectations for “prices” over the years.
They will likely prefer to keep that wording to allow them to compare present responses
to those given in the past.
In conclusion, our findings demonstrate that seemingly irrelevant changes in
wording can elicit variations in how economic survey questions are interpreted. In the study presented here, we followed procedures that are common in survey design research, asking respondents to indicate how they interpreted survey questions, with response
options being taken from think-aloud interviews in which interviewees thought out loud while answering the questions. Such procedures may help economists to gain a better
5. References
Armantier, O., Bruine de Bruin, W., Topa, G., van der Klaauw, W. and B. Zafar. 2011.
Inflation Expectations and Behavior: Do Survey Respondents Act on their Beliefs? Federal Reserve Bank of New York.
Basili, J.N., & Scott, B.S. (1996). Response latency as a signal to question problems in survey research. Public Opinion Quarterly, 60, 390-99.
Bates, J.M., & Gabor, A. (1986). Price perception in creeping inflation: Report on an
enquiry. Journal of Economic Psychology, 7, 269-290.
Brachinger, H.W. (2008). A new index of perceived inflation: Assumptions, method, and
application to Germany. Journal of Economic Psychology, 29, 433-457.
Bruine de Bruin, W. (2011). Framing effects in survey design: How respondents make sense of the questions we ask. In Keren, G. Ed.. Perspectives on framing. London,
UK: Taylor & Francis. pp. 303-324.
Bruine de Bruin, W., van der Klaauw, W., & Topa, G. (2011). Expectations of inflation:
The biasing effect of thoughts about specific prices. Journal of Economic Psychology, 32, 834-845.
Bruine de Bruin W., Manski, C.F., Topa, G., & van der Klaauw, W. (2011). Measuring
consumer uncertainty about inflation. Journal of Applied Econometrics, 26, 454-478. Bruine de Bruin, W., van der Klaauw, W., Downs, J.S., Fischhoff, B., Topa, G., &
Armantier, O. (2010). Expectations of inflation: The role of financial literacy and demographic variables. Journal of Consumer Affairs, 44, 381-402.
Bureau of Labor Statistics. (2008). News. Consumer Price Index: May 2008. Bureau of
Christandl, F., Fetchenhauer, D., & Hoelzl, E. (2011). Price perception and confirmation bias in the context of a VAT increase. Journal of Economic Psychology, 32, 131-141.
Fligner, M.A., & Killeen, T.J. (1976). Distribution-free two-sample tests for scale. Journal of the American Statistical Association, 71, 210-213.
Fluch, M., & Stix, H. (2005). Perceived inflation in Austria – Extent, explanations, effects. Monetary Policy and The Economy, Q3, 22-47.
Fricker, S., Galesic, M., Tourangeau, R., & Yan, T. (2005). An experimental comparison
of Web and telephone surveys. Public Opinion Quarterly, 69, 370–392.
Goidel, R.K., & Langley, R.E. (1995). Media coverage of the economy and aggregate
economic evaluations: Uncovering indirect media effects. Political Research Quarterly, 48, 313-328.
Hafer, R.W., & Hein, S.E. (1985). On the accuracy of time-series, interest rate, and
survey forecasts of inflation. The Journal of Business, 58, 377-398.
Holleman, B. (1999). Wording effects in survey research using meta-analysis to explain
the forbid/allow asymmetry. Journal of Quantitative Linguistics, 6, 29-40. Hurd, M.D. (2009). Subjective probabilities in household surveys. Annual Review of
Economics, 1, 543-562.
Jungermann, H., Brachinger, H.W., Belting, J., Grinberg, K., & Zacharias, E. (2007). The Euro changeover and the factors influencing perceived inflation. Journal of
Consumer Policy, 405-419.
Knäuper, B., Belli, R.F., Hill, D.H., & Herzog, A.R. (1997). Question Difficulty and Respondents’ Cognitive Ability: The Effect on Data Quality. Journal of Official
Leiser, D., & Driori, S. (2005). Naïve understanding of inflation. The Journal of Socio-Economics, 34, 179-198.
Link, M.W., & Mokdad, A.H. (2005). Effects of survey mode on self-reports of adult alcohol consumption: a comparison of mail, Web and telephone approaches. Journal
of Studies on Alcohol, 66, 239–245.
Loftus, E.F., & J.C. Palmer. (1974). Reconstruction of automobile destruction: An example of the interaction between language and memory. Journal of Verbal
Learning and Verbal Behavior, 5, 585-589.
Manski, C.F. (2004). Measuring expectations. Econometrica, 72, 1329-1376.
Ranyard, R., Del Missier, F., Bonini, N., Duxbury, D., & Summers, B. (2008).
Perceptions and expectations of price changes and inflation: A review and conceptual framework. Journal of Economic Psychology, 29, 378-400.
Siegel, S., & N.J. Castellan. (1988). Nonparametric statistics for the behavioral sciences. Second edition. Boston, MA: McGraw-Hill.
Svenson, O., & Nilsson, G. (1986). Mental economics: Subjective representations of factors related to expected inflation. Journal of Economic Psychology, 7, 327-349. Thomas, L.B., jr. (1999). Survey measures of expected U.S. inflation. Journal of
Economic Perspectives, 13, 125-144.
Williamson, M.R., & Wearing, A.J. (1996). Lay people’s cognitive models of the
economy. Journal of Economic Psychology, 17, 3-38.
Yan, T., & Toureangaeau, R. (2008). Fast times and easy questions: The effects of age, experience, and question complexity on web survey response times. Applied
Table 1: Adapted Michigan Survey protocol for the question about year-ahead expectations for “prices in general.”
Q1a During the next 12 months, do you think that prices in general will go up, or go down, or stay where they are now?
___ Go up
___ Stay the same ___ Go down
[If Q1a response is ”Stay the same”]
Q1b Do you mean that prices will go up at the same rate as now, or that prices in general will not go up during the next 12 months?
___ Will go up at same rate ___ Will not go up
[If Q1a response is ”Go up” or Q2a response is ”will go up at same rate,” ask Q2 about prices going up. If Q1a response is “Go down” ask Q2 about prices going down]
Q2a By about what percent do you expect prices to go [up/down] on the average, during the next 12 months? Below, please give your best guess OR your best guess for a range.
My best guess is ___ percent OR
My best guess for a range is between ___ percent and ___ percent [If Q2a response is a range]
Q2b Thank you for giving a range. Could you also give a best guess? ___ [If Q2a or Q2b best guess ‘x’ is >5%]
Q2c Let me make sure I have that correct. You said that you expect prices to go [up/down] during the next 12 months by [x] percent. Is that correct? ___ Yes
___ No
[If Q2c response is”Yes”]
Table 2. Descriptive statistics by question wording and time horizon.
Question N Mediana Mean (SD) Percent
>5% b
IQR c Skewness Kurtosis
Expectations
for next 12 months (%)
Inflation 255 5.00 8.22 (11.71) 41.6% 7.00 2.54 11.07
Prices in general 280 6.00 i 9.84 (10.01) 55.0% i 6.00 i 2.39 9.08
Prices you pay 277 8.00 i 9.24 (7.98) 56.0% i 11.00 i .09 4.34
Expectations
for next 5 to 10 years (%)
Inflation 256 3.00 4.21 (5.59) 19.5% 3.00 2.08 7.79
Prices in general 280 3.50 i 5.38 (7.36) 26.8% i 4.00 i 4.65 34.65
Prices you pay 277 4.00 i 5.25 (5.87) 26.0% 4.00 i 2.95 14.10
Perceptions
of past 12 months (%)
Inflation 252 4.00 7.13(9.99) 36.1% 5.00 4.89 34.88
Prices in general 278 5.00 i 9.29 (9.15) 49.6% i 6.00 i 2.33 6.22
Prices you pay 277 7.00 i 9.62(13.45) 55.6% i 6.00 i 10.57 146.12 a
Mann-Whitney tests were used to examine question-wording effects on responses (p<.05) b
Chi-square tests were used to examine question-wording effects on whether or not responses were >5% (p<.05) c
Table 3: Mean (SD) ratings of how much respondents thought of focal topics, by question wording and time horizon.
Expectations for next 5 to 10 years Perceptions of past 12 months
Focal topic Inflation
Prices in general
Prices
you pay Inflation
Prices in general
Prices you pay U.S. inflation rate 5.07 gy
(1.84)
4.67 (1.75)
4.45 (1.86)
4.95 gy (2.00)
4.31 (1.90)
3.94 (1.88) Prices of things you
usually spend money on
5.51 (1.53)
5.87 i (1.32)
6.18 ig (1.20)
5.76 (1.55)
6.05 i (1.31)
6.43 ig (.97) Covering expenses 4.41
(2.05) 4.22 (2.18) 4.10 (2.17) 4.31 (2.16) 4.23 (2.18) 4.27 (2.29)
Table 4: Regressions predicting general year-ahead price expectations from expectations for specific prices.
Linear regressions ( ) predicting reported
expectations a
Logistic regressions (Odds Ratio; 95% CI) predicting whether expectations >5% b
Model 1 (R2=.40)
Model 2 (R2=.44)
Model 3 (Nagelkerke R2=.35)
Model 4 (Nagelkerke R2=.39)
Gas expectation .15** .00 1.03 (1.01, 1.06)** 1.01 (.98, 1.04)
Food expectation .48*** .49*** 1.16 (1.10, 1.23)*** 1.11 (1.03, 1.20)**
Housing expectation .05 .03 1.05 (1.01, 1.09)* 1.02 (.95, 1.09)
Prices in general .17*** -.01 2.69 (1.47, 4.93)** .83 (.28, 2.48)
Prices you pay .15** .15* 2.84 (1.58, 5.09)*** .70 (.23, 2.11)
Gas x prices in general - .16* - 1.05 (1.00, 1.10)+
Food x prices in general - .11 - 1.09 (.95, 1.24)
Housing x prices in general - .07 - 1.00 (.91, 1.10)
Gas x prices you pay - .20** - 1.07 (1.01, 1.13)*
Food x prices you pay - -.21** - 1.06 (.93, 1.20)
Housing x prices you pay - .07 - 1.10 (1.01, 1.21)
a
Continuous variable; a Dichotomous variable
Table 5: Percent of missing responses, rated question clarity, and rated ease of responding by question wording and time horizon.
Expectations for next 5 to 10 years Perceptions of past 12 months
Inflation
Prices in
general
Prices
you pay Inflation
Prices in
general
Prices
you pay
Percent of missing responses .4% 1/257 .4% 1/281 .0% 0/277 2.0% 5/252 g
1.1% 3/278
.0% 0/277
Mean (SD) rating for question clarity
5.00 (1.75)
5.45 i (1.58)
5.38 i (1.64) 5.51 (1.54) 5.67 (1.42) 5.78 (1.38) Mean (SD) rating for
ease of responding
3.33
(1.63)
3.66
(1.63)
3.81 i
(1.64)
3.63
(1.78)
4.01 i
(1.65)
4.26 i
(1.73)
Note: Cross-tabs (p<.05) compared the percent of missing responses for each question pair. Missing responses for year-ahead expectations as reported in Survey 2 were .8% (2/257) for inflation, .4% (1/281) for prices in general, and .0% (0/277) for prices you pay, showing no