U N
IVER
SITAS WARWICEN
SIS
Monitoring, Analysis and Optimisation of I/O in
Parallel Applications
by
Steven Alexander Wright
A thesis submitted to The University of Warwick
in partial fulfilment of the requirements
for admission to the degree of
Doctor of Philosophy
Department of Computer Science
The University of Warwick
High performance computing (HPC) is changing the way science is performed
in the 21st Century; experiments that once took enormous amounts of time,
were dangerous and often produced inaccurate results can now be performed
and refined in a fraction of the time in a simulation environment. Current
gen-eration supercomputers are running in excess of 1016 floating point operations
per second, and the push towards exascale will see this increase by two orders
of magnitude. To achieve this level of performance it is thought that
applica-tions may have to scale to potentially billions of simultaneous threads, pushing
hardware to its limits and severely impacting failure rates.
To reduce the cost of these failures, many applications use checkpointing
to periodically save their state to persistent storage, such that, in the event
of a failure, computation can be restarted without significant data loss. As
computational power has grown by approximately 2⇥ every 18 24 months,
persistent storage has lagged behind; checkpointing is fast becoming a bottleneck
to performance.
Several software and hardware solutions have been presented to solve the
current I/O problem being experienced in the HPC community and this thesis
examines some of these. Specifically, this thesis presents a tool designed for
analysing and optimising the I/O behaviour of scientific applications, as well as a
tool designed to allow the rapid analysis of one software solution to the problem
of parallel I/O, namely the parallel log-structured file system (PLFS). This
thesis ends with an analysis of a modern Lustre file system under contention from
multiple applications and multiple compute nodes running the same problem
through PLFS. The results and analysis presented outline a framework through
Ian Haig Henderson
Since walking into the Department of Computer Science for the first time in
October 2006, I have been fortunate enough to meet, work with and enjoy the
company of many special people. First and foremost, I would like to thank my
supervisor, Professor Stephen Jarvis, for all his help and hard work over the past
4 years and for allowing me the opportunity to undertake a Ph. D. I would also
like to thank him for providing me with funding and a post-doctoral position in
the department.
Secondly, I would like to thank the two best office-mates I’m ever likely to
have, Dr. Simon Hammond and Dr. John Pennycook. I have been in a lull
since each of them moved on to pastures new. I consider my time sharing an
office with each of them to be both the most productive (with Si) and most
entertaining (with John) time in my Warwick career, and I miss their daily
company dearly.
Thirdly, I acknowledge my current office-mates, Robert Bird and Richard
Bunt. Both provide nice light entertainment and interesting discussions to break
up the day and make my working environment a more pleasant place to spend
my time. Additionally, I thank the other members of the High Performance and
Scientific Computing group, past and present – David Beckingsale, Dr. Adam
Chester, Peter Coetzee, James Davis, Timothy Law, Andy Mallinson, Dr. Gihan
Mudalige, Dr. Oliver Perks and Stephen Roberts – for their lunchtime company
and occasional pointless discussions.
Finally, within the University, I would like to thank the group of individuals
that have helped me through both my undergraduate and postgraduate studies
– Dr. Abhir Bhalerao, Jane Clarke, Dr. Matt Ismail, Dr. Arshad Jhumka, Dr.
Matthew Leeke, Dr. Christine Leigh, Prof. Chang-Tsun Li, Rod Moore, Dr.
Outside of University, thanks go to the organisations that have contributed
resources and expertise to much of the material in this thesis: the team at the
Lawrence Livermore National Laboratory for allowing access to the Sierra and
Cab supercomputers; the team at Daresbury Laboratory for granting time on
their IBM BlueGene/P; and finally, to both Meghan Wingate-McLelland, at
Xyratex, and John Bent, at EMC2, for contributing their time and expertise to
my investigations into the parallel log-structured file system.
Special thanks is reserved for my closest friend for four years of
undergrad-uate studies and current snowboarding partner, Chris Stra↵on. I only wish our
snowboarding excursions were both longer and more frequent; they’re currently
the week of the year I look forward to the most.
And last, but certainly not least, thanks go to my family – Mum, Dad,
Gemma and Paula; my beloved Gran and Grandad; my aunties and uncles; and
my nieces and nephews – Chloe, Sophie, Megan, Lauren, Charlie, Holly-Mae,
Liam, Tyler, Aimee and Isabelle – who often make me laugh uncontrollably and
cost me so much money each Christmas time. And finally huge thanks go to
my girlfriend, Jessie, for putting up with me throughout my Ph. D. and making
This thesis is submitted to the University of Warwick in support of the author’s
application for the degree of Doctor of Philosophy. It has been composed by the
author and has not been submitted in any previous application for any degree.
The work presented (including data generated and data analysis) was carried
out by the author except in the cases outlined below:
• Performance data in Chapters 4 and 5 for the Sierra supercomputer were
collected by Dr. Simon Hammond.
Parts of this thesis have been previously published by the author in the following
publications:
[141] S. A. Wright, S. D. Hammond, S. J. Pennycook, R. F. Bird, J. A.
Herd-man, I. Miller, A. Vadgama, A. H. Bhalerao, and S. A. Jarvis. Parallel
File System Analysis Through Application I/O Tracing. The Computer
Journal, 56(2):141–155, February 2013
[142] S. A. Wright, S. D. Hammond, S. J. Pennycook, and S. A. Jarvis.
Light-weight Parallel I/O Analysis at Scale.Lecture Notes in Computer Science
(LNCS), 6977:235–249, October 2011
[143] S. A. Wright, S. D. Hammond, S. J. Pennycook, I. Miller, J. A.
Herd-man, and S. A. Jarvis. LDPLFS: Improving I/O Performance without
Application Modification. InProceedings of the 26th IEEE International
Parallel & Distributed Processing Symposium Workshops & PhD Forum
(IPDPSW’12), pages 1352–1359, Shanghai, China, 2012. IEEE Computer
Society, Washington, DC
[144] S. A. Wright, S. J. Pennycook, S. D. Hammond, and S. A. Jarvis. RIOT
[145] S. A. Wright, S. J. Pennycook, and S. A. Jarvis. Towards the Automated
Generation of Hard Disk Models Through Physical Geometry Discovery.
InProceedings of the 3rd International Workshop on Performance
Model-ing, Benchmarking and Simulation of High Performance Computing
Sys-tems (PMBS’12), pages 1–8, Salt Lake City, UT, November 2012. ACM,
New York, NY
In addition, research conducted during the period of registration has also led
to the following publications which, while not directly focused on parallel I/O,
have nevertheless shaped the research presented in this thesis:
[12] R. F. Bird, S. J. Pennycook, S. A. Wright, and S. A. Jarvis. Towards
a Portable and Future-proof Particle-in-Cell Plasma Physics Code. In
Proceedings of the 1st International Workshop on OpenCL (IWOCL’13),
Atlanta, GA, May 2013. Georgia Institute of Technology, GA
[13] R. F. Bird, S. A. Wright, D. A. Beckingsale, and S. A. Jarvis. Performance
Modelling of Magnetohydrodynamics Codes. Lecture Notes in Computer
Science (LNCS), 7587:197–209, July 2013
[98] S. J. Pennycook, S. D. Hammond, G. R. Mudalige, S. A. Wright, and S. A.
Jarvis. On the Acceleration of Wavefront Applications using Distributed
Many-Core Architectures. The Computer Journal, 55(2):138–153,
Febru-ary 2012
[99] S. J. Pennycook, S. D. Hammond, S. A. Wright, J. A. Herdman, I. Miller,
and S. A. Jarvis. An Investigation of the Performance Portability
of OpenCL. Journal of Parallel and Distributed Computing (JPDC),
The research presented in this thesis was made possible by the support of the
following benefactors and sources:
• The University of Warwick, United Kingdom:
Engineering and Physical Sciences Research Council Doctoral Training
Accounts Studentship (2010–2014)
• Royal Society:
Industry Fellowship Scheme (IF090020/AM)
• UK Atomic Weapons Establishment:
“The Production of Predictive Models for Future Computing
Requirements” (CDK0660)
“AWE Technical Outreach Programme” (CDK0724)
ADIO Abstract Device Interface for Parallel I/O
ANL Argonne National Laboratory
API Application Programmable Interface
ATA Advanced Technology Attachment
B/W Bandwidth
BG/P IBM BlueGene/P
CPU Central Processing Unit
DFS Distributed File System
EMC2 EMC Corporation
FLOP/s Floating-Point Operations per Second
FUSE File system in User Space
GB 10243 Bytes
GFLOP/s 109 FLOP/s
GPFS IBM General Parallel File System
HDD Hard Disk Drive
HDF-5 Hierarchical Data Format, Version 5
HPC High-Performance Computing
I/O Input/Output
KB 1024 Bytes
LANL Los Alamos National Laboratory
LBNL Lawrence Berkeley National Laboratory
LDPLFS ldLoadable PLFS
LLNL Lawrence Livermore National Laboratory
MB 10242 Bytes
MDS Metadata Server
MPI Message Passing Interface
NASA National Aeronautics and Space Administration
NFS Network File System
NPB NASA Parallel Benchmarks
OCF Open Compute Facility
OSS Object Storage Server
OST Object Storage Target
PFLOP/s 1015 FLOP/s
PLFS Parallel Log-Structured File System
PMPI Profiling Message Passing Interface
POSIX Portable Operating System Interface
PVFS Parallel Virtual File System
QDR Quad Data Rate
RAID Redundant Array of Inexpensive/Independent Disks
RIOT RIOT I/O Toolkit
RPM Revolutions per Minute
SAS Serial Attached SCSI
SATA Serial-ATA
SSD Solid State Drive
STFC Science & Technology Facilities Council
TB 10244 Bytes
TFLOP/s 1012 FLOP/S
UFS UNIX File System
Abstract ii
Dedication iii
Acknowledgements iv
Declarations vi
Sponsorship and Grants viii
Abbreviations ix
List of Figures xvii
List of Tables xxi
1 Introduction 1
1.1 Motivation . . . 2
1.2 Thesis Contributions . . . 2
1.3 Thesis Overview . . . 4
2 Performance Analysis and Engineering 7 2.1 Parallel Computation . . . 8
2.2 I/O in Parallel Computing . . . 10
2.2.1 Issues in Parallel I/O . . . 10
2.2.2 Parallel File Systems . . . 12
2.2.3 Parallel I/O Middleware . . . 15
2.3 Performance Engineering Methodologies . . . 17
2.3.1 Benchmarking . . . 18
2.4 Summary . . . 24
3 Hardware and Software Overview 26 3.1 Hard Disk Drive . . . 26
3.1.1 Disk Drive Mechanics . . . 26
3.1.2 Data Layout . . . 27
3.1.3 Disk Controller . . . 30
3.1.4 Redundant Array of Independent Disks . . . 31
3.2 File Systems . . . 33
3.2.1 The Extended File System . . . 33
3.2.2 The Sun Network File System . . . 36
3.3 Distributed File Systems . . . 37
3.3.1 The Lustre File System . . . 39
3.3.2 IBM’s General Parallel File System . . . 40
3.3.3 The Parallel Log-structured File System . . . 41
3.4 Computing Platforms . . . 42
3.5 Input/Output Benchmarking Applications . . . 45
3.6 Summary . . . 47
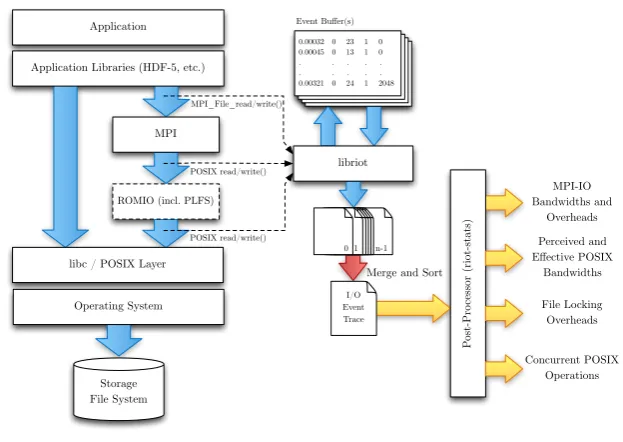
4 I/O Tracing and Application Optimisation 49 4.1 The RIOT I/O Toolkit . . . 50
4.1.1 Feasibility Study . . . 53
4.2 File System Analysis . . . 55
4.2.1 Distributed File Systems – Lustre and GPFS . . . 56
4.3 Middleware Analysis and Optimisation . . . 61
4.4 Summary . . . 65
5 Analysis and Rapid Deployment of the Parallel Log-Structured
5.2.1 Performance Analysis . . . 74
5.3 Summary . . . 81
6 Parallel File System Performance Under Contention 82 6.1 E↵ective Use of Uncontended Parallel File Systems . . . 83
6.2 Quantifying the Performance of Contended File Systems . . . 85
6.3 Performance Comparison: Lustre vs. PLFS . . . 90
6.4 Summary . . . 93
7 Discussion and Conclusions 96 7.1 Limitations . . . 98
7.2 Future Work . . . 100
7.3 The Road to Exascale . . . 101
Bibliography 105
Appendices 127
A RIOT Feasibility Study – Additional Results 127
B Numeric Data for Perceived and E↵ective Bandwidth 130
C FLASH-IO Analysis and Optimisation Data 133
D LDPLFS Source Code Examples 135
E LDPLFS Numeric Data 137
F Optimality Search Numeric Data 141
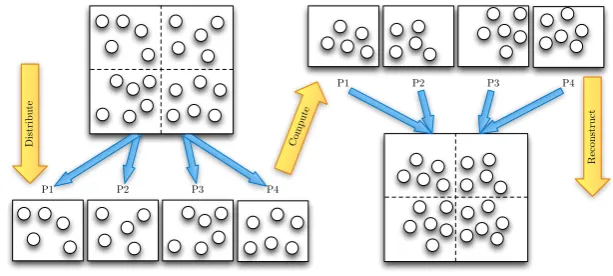
2.1 An example of the parallelisation of a simple particle simulation
between four processors. . . 9
2.2 The three basic approaches to I/O in parallel applications. . . 11
2.3 An example of two nodes (four ranks per node) writing to a file
system with collective bu↵ering o↵and on. . . 16
3.1 Basic internal structure of a hard disk drive. . . 27
3.2 Data layout on a disk with no zoning and three zones of increasing
density. . . 28
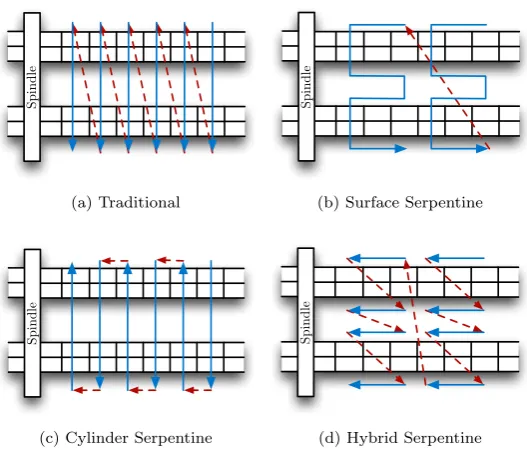
3.3 Four examples of serpentine sector mapping. . . 29
3.4 An example of four requests fulfilled in-order without NCQ and
out of order with NCQ. . . 32
3.5 Two common RAID data distribution schemes. . . 33
3.6 Structure of an ext2 inode block. . . 34
3.7 An example Lustre configuration with four OSSs and a fail-over
MGS and MDS. . . 38
3.8 An example of a GPFS setup with four OSSs connected via a high
performance switch to three targets and separate management
and metadata targets. . . 40
3.9 An application’s view of a file and the underlying PLFS container
structure. . . 41
platforms at varying core counts, with three di↵erent
configura-tions: No RIOT tracing, POSIX RIOT tracing and complete
RIOT tracing. . . 55
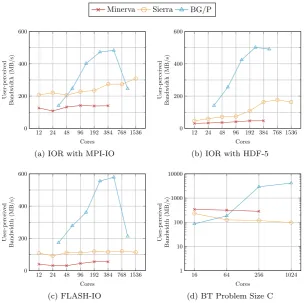
4.3 User-perceived bandwidth for applications on the three test
sys-tems. . . 57
4.4 E↵ective POSIX and MPI bandwidth for IOR through MPI-IO. . 59
4.5 E↵ective POSIX and MPI bandwidth for IOR through HDF-5. . 59
4.6 E↵ective POSIX and MPI bandwidth for FLASH-IO. . . 60
4.7 E↵ective POSIX and MPI bandwidth for BT Problem C, as
mea-sured by RIOT. . . 60
4.8 Percentage of time spent in POSIX functions for FLASH-IO on
three platforms. . . 62
4.9 Composition of a single, collective MPI write operation on MPI
ranks 0 and 1 of a two core run of FLASH-IO, called from the
HDF-5 middleware library in its default configuration. . . 63
4.10 Composition of a single, collective MPI write operation on MPI
ranks 0 and 1 of a two core run of FLASH-IO, called from the
HDF-5 middleware library after data-sieving has been disabled. . 63
4.11 Perceived bandwidth for the FLASH-IO benchmark in its original
configuration (Original), with data-sieving disabled (No DS), and
with collective bu↵ering enabledand data-sieving disabled (CB
and No DS) on Minerva and Sierra, as measured by RIOT. . . . 65
5.1 Concurrentwrite() operations for BT class C on 256 cores on
Minerva and Sierra. . . 71
5.2 The control flow of LDPLFS in an applications execution. . . 73
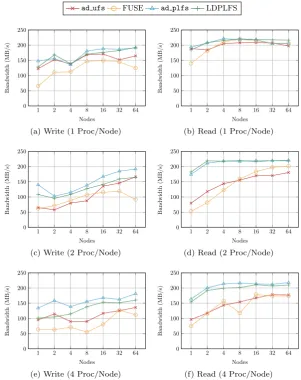
5.3 Benchmarked MPI-IO bandwidths on FUSE, thead plfsdriver,
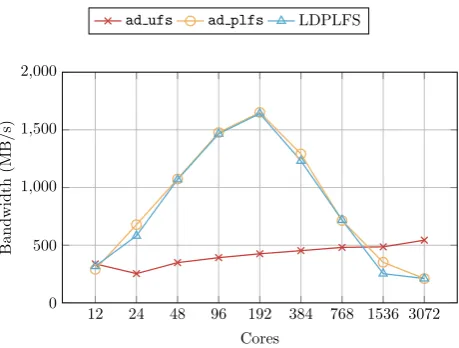
5.5 FLASH-IO benchmarked MPI-IO bandwidths using MPI-IO, as
well as PLFS through ROMIO and LDPLFS. . . 80
6.1 Write bandwidth achieved over 1,024 cores by varying just the
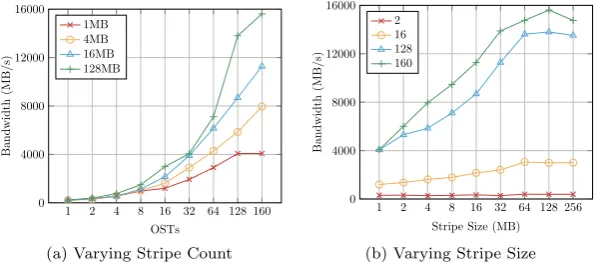
stripe count and just the stripe size. . . 84
6.2 Write bandwidth achieved over 1,024 cores by varying both the
stripe count and the stripe size. . . 85
6.3 The performance per-task of thelscratchc file system under
con-tention, with the ideal upper and lower bounds. . . 88
6.4 Performance of each of 4 tasks over 5 repetitions where all tasks
are contending the file system. . . 89
6.5 Graphical representation of the data in Table 6.3, showing
opti-mal performance at 160 stripes per file, but very minor
perfor-mance degradation at just 32 stripes per file. . . 90
6.6 Achieved write bandwidth achieved for IOR through an optimised
Lustre configuration and through the PLFS MPI-IO driver. . . . 91
6.7 The number of OST collisions for IOR running through PLFS
with 512 cores. . . 92
7.1 The memory hierarchy with potentially two additional layers for
improved I/O performance on supercomputers. . . 102
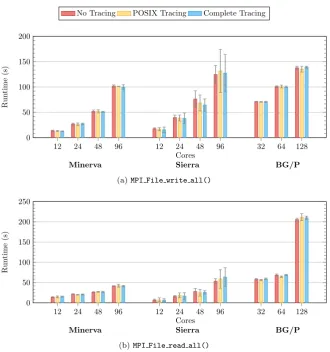
A.1 Total runtime of RIOT overhead analysis software for the
func-tions MPI File write() and MPI File read(), on three
plat-forms, with three di↵erent configurations: No RIOT tracing,
three platforms, with three di↵erent configurations: No RIOT
3.1 Hardware specification of the Minerva, Sierra and Cab
supercom-puters. . . 42
3.2 Configuration for the GPFS installation connected to Minerva. . 42
3.3 Configuration for the lscratchc Lustre File System installed at
LLNL in 2011 (for the experiments in Chapter 5) and 2013 (for
the experiments in Chapter 6). . . 43
3.4 Hardware configuration for the IBM BlueGene/P system at the
Daresbury Laboratory. . . 45
3.5 Configuration for the GPFS installation connected Daresbury
Laboratory’s BlueGene/P, where data is first written to Fibre
Channel connected disks because being staged to slower SATA
disks. . . 45
5.1 Perceived and E↵ective Bandwidth (MB/s) for BT class C through
MPI-IO and PLFS, as well as the speed-up generated by PLFS. . 70
5.2 Time in seconds for UNIX commands to complete using PLFS
through LDPLFS, and without PLFS. . . 76
6.1 IOR configuration options for experiments. . . 83
6.2 The average number of OSTs in use and their average load based
on the number of concurrent I/O intensive jobs. . . 87
6.3 Average and total bandwidth achieved across four tasks for a
varying stripe size request, along with values for the average
num-ber of tasks competing for 1, 2, 3 and 4 OSTs respectively. . . 89
6.4 OST usage and average load for the Stampede I/O setup
A.1 Incidence of MPI File * function calls in 9 application suites,
benchmarks and I/O libraries. . . 128
A.2 Average time (s) to perform one hundred 4 MB operations:
with-out RIOT, with only POSIX tracing and with complete MPI and
POSIX RIOT tracing. The change in time is shown between full
RIOT tracing and no RIOT tracing. . . 129
B.1 Perceived MPI, e↵ective MPI and e↵ective POSIX bandwidths
for IOR through HDF-5 on Minerva, Sierra and BG/P. . . 130
B.2 Perceived MPI, e↵ective MPI and e↵ective POSIX bandwidths
for IOR through MPI-IO on Minerva, Sierra and BG/P. . . 131
B.3 Perceived MPI, e↵ective MPI and e↵ective POSIX bandwidths
for FLASH-IO through HDF-5 on Minerva, Sierra and BG/P. . . 131
B.4 Perceived MPI, e↵ective MPI and e↵ective POSIX bandwidths
for BT class C on Minerva, Sierra and BG/P. . . 132
B.5 Perceived MPI, e↵ective MPI and e↵ective POSIX bandwidths
for BT class D on Minerva and Sierra. . . 132
C.1 MPI and POSIX function statistics for FLASH-IO on Minerva. . 133
C.2 MPI and POSIX function statistics for FLASH-IO on Sierra 12
to 96 cores. . . 133
C.3 MPI and POSIX function statistics for FLASH-IO on Sierra 192
to 1536 cores. . . 133
C.4 MPI and POSIX function statistics for FLASH-IO on BG/P. . . 134
C.5 FLASH-IO performance on Minerva and Sierra with collective
MPI-IO driver on Minerva, using 1 core per node. . . 137
E.2 Read and write performance of PLFS through FUSE, thead plfs
MPI-IO driver and LDPLFS compared to the standard ad ufs
MPI-IO driver on Minerva, using 2 cores per node. . . 138
E.3 Read and write performance of PLFS through FUSE, thead plfs
MPI-IO driver and LDPLFS compared to the standard ad ufs
MPI-IO driver on Minerva, using 4 cores per node. . . 139
E.4 Write performance in BT class C for PLFS through thead plfs
MPI-IO driver and LDPLFS compared to the standard ad ufs
MPI-IO driver on Sierra. . . 140
E.5 Write performance in BT class D for PLFS through thead plfs
MPI-IO driver and LDPLFS compared to the standard ad ufs
MPI-IO driver on Sierra. . . 140
E.6 Write performance in FLASH-IO for PLFS through thead plfs
MPI-IO driver and LDPLFS compared to the standard ad ufs
MPI-IO driver on Sierra. . . 140
F.1 Numerical data for Figure 6.2, displaying bandwidth achieved by
IOR on 1,024 cores, while varying Lustre stripe size and stripe
count. . . 141
F.2 Numerical data for Figure 6.3, displaying bandwidth per task
under contention, along with the idealised values. . . 141
G.1 Stripe collision statistics for PLFS backend directory running
with 16 cores. . . 142
G.2 Stripe collision statistics for PLFS backend directory running
with 32 cores. . . 142
G.3 Stripe collision statistics for PLFS backend directory running
G.5 Stripe collision statistics for PLFS backend directory running
with 256 cores. . . 143
G.6 Stripe collision statistics for PLFS backend directory running
with 512 cores. . . 143
G.7 Stripe collision statistics for PLFS backend directory running
with 1,024 cores. . . 144
G.8 Stripe collision statistics for PLFS backend directory running
with 2,048 cores. . . 144
G.9 Numeric data for Figure 6.6, showing the performance of IOR
Introduction
Since the birth of the modern computer, in the early 20th Century, there has
been a dramatic shift in how science is performed; where previously countless
experiments were performed with varying results and levels of accuracy, now
simulations are performed ahead of time, reducing – and in some cases
elimi-nating – the number of experiments that need to be performed. To handle the
burden of simulating and predicting the outcome of these experiments,
comput-ers have become evermore complex and powerful; the most powerful
supercom-puter at the time of writing can perform 33 quadrillion (33⇥1015) floating point
operations every second [87], and there is a hope that within the next decade
this will be increased to 1 quintillion (1018) operations per second [25, 40].
Achieving this level of performance relies on an enormous amount of
par-allelism – the world’s fastest supercomputer in November 2013, Tianhe-2,
con-sists of 3,120,000 distinct processing elements operating in parallel [87]. The
sheer size of the problems being calculated on machines such as this means
that loading data from disk often becomes a burden at scale. Furthermore, the
number of components in use in these machines has a serious e↵ect on their
reliability, with most production supercomputers experiencing frequent node
failures [58, 116, 149]. To combat this, resilience mechanisms are required that
often involve writing large amounts of data to persistent storage, such that in the
event of a failure, the application can be restarted from a checkpoint, avoiding
the need to relaunch the computation from the very beginning.
Unfortunately, the persistent storage available on large parallel systems has
not kept pace with the development of microprocessors; checkpointing is
Fiala et al. show that at 100,000 nodes, only 35% of runtime is spent performing
computation, with the remaining time spent checkpointing and recovering from
failures [46]. As the era of exascale computing approaches, this performance
gap is widening further still.
1.1
Motivation
The increasing divergence between compute and I/O performance is making
analysing and improving the state of current generation storage systems of
ut-most importance. Improvements to I/O systems will not only benefit
current-day applications but will also help inform the direction that storage must take
if exascale computing is to become practically useful. This thesis demonstrates
methods for analysing the performance of I/O intensive applications and shows
that by making small changes to how parallel libraries are currently used
perfor-mance can be improved; furthermore, with the correct combination of software
libraries and configuration options, performance can be increased by an order
of magnitude on present day systems.
This thesis also contains an investigation into one potential solution to poor
parallel file system performance. The parallel-log structured file system (PLFS)
is reported to be providing huge improvements in write performance [11,103] and
this thesis investigates these claims; specifically it is shown that while many of
the techniques used in PLFS may prove important on future systems, on many
current day systems, PLFS induces a performance penalty at scale.
1.2
Thesis Contributions
The research presented in this thesis makes the following contributions:
• The development and deployment of an I/O tracing library (RIOT) is
de-scribed in detail. RIOT is a dynamically loadable library that intercepts
later analysis. This is demonstrated using industry-standard benchmarks
to show how their performance di↵ers between three distinct
supercomput-ers with a variety of I/O backplanes. RIOT allows application developsupercomput-ers
to visualise how data is written to the file system and identify potential
opportunities for optimisation. In particular, through the analysis of an
HDF-5 based code, it is shown that by changing some of the low-level
configuration options in MPI-IO, a performance improvement of at least
2⇥can be achieved;
• Using RIOT, the performance of PLFS is analysed on two commodity
clus-ters. The analysis presented in this thesis not only explains why PLFS
produces large speed-ups for general users on large file systems but also
suggests that there exists a tipping point where PLFS may harm parallel
I/O performance beyond a certain number of cores. The burden of
in-stalling and using PLFS is also addressed in this thesis, where a simpler,
more convenient method of using PLFS is developed. This pre-loadable
library, known as LDPLFS, allows application developers and end users
to assess the applicability of PLFS to their codes before investing further
time and e↵ort into using PLFS natively;
• Building upon previous work [10, 76, 148], the performance of the
Lustre-optimised MPI-IO driver is analysed. On the systems operated by the
Lawrence Livermore National Laboratory (LLNL), used throughout this
thesis, a Lustre-optimised driver (ad lustre) is not available by default,
and this is also true of other studies, whereby a potential optimisation is
compared against a Lustre file system using the unoptimised UNIX file
system MPI-IO driver (ad ufs) [11]. In this thesis, a customised MPI
library is built in order to measure the impact of the specialised driver –
demonstrating a potential 49⇥boost in performance. This thesis extends
previous works, demonstrating that although the optimal performance is
not be optimal for a system with many I/O intensive applications
com-peting for a shared resource. A number of metrics are presented to aid
procurement decisions and explain potential performance deficiencies that
may occur;
• The metrics presented to explain the e↵ect of job contention on parallel
file systems are adapted and used to explain the performance defects in
PLFS at scale, demonstrating that at 4,096 cores each storage target is
being contented by 17 tasks in the average case, with some targets
expe-riencing as many as 35 collisions. The equations presented in this thesis
will allow scientists to make decisions about whether PLFS will benefit a
given application if the scale at which it will be run and the number of file
system targets available is known beforehand. At large scale, Lustre with
an optimal set of configuration options outperforms PLFS by 5.5⇥, and
induces much less contention on the whole file system, thus benefitting
the shared file system as a whole.
1.3
Thesis Overview
The remainder of the thesis is structured as follows:
Chapter 2contains an overview of current work in the field of high performance
computing. Specifically, it describes work related to improving I/O and file
system performance, with a focus on the methods that can be used to increase
the performance of data intensive applications. This chapter also contains a
literature review of current work in the fields of performance benchmarking,
system profiling and performance modelling, both analytical and
simulation-based.
Chapter 3presents a brief explanation of the hardware and software
environ-ments used in this thesis. The chapter begins with a brief introduction to how
themselves, up to the distributed file systems that bring all the components
to-gether. Chapter 3 concludes with an overview of the applications and systems
used throughout this thesis.
Chapter 4describes the development and use of RIOT, an I/O tracing toolkit
designed to analyse the usage patterns in parallel MPI-based applications. The
overheads associated with using RIOT are studied, showing that the
perfor-mance impact is negligible, motivating its use in this thesis. RIOT is used to
assess the performance of both IBM’s General Parallel File System (GPFS) and
the Lustre file system which are commonplace on leading contemporary
super-computers. GPFS on an IBM BlueGene/P is shown to significantly outperform
GPFS and Lustre on commodity clusters due to the use of an optimised
MPI-IO driver, specialised aggregator nodes and a tiered storage architecture. The
performance of applications dependent on the HDF-5 data formatting library is
shown to be suboptimal on two of the clusters used throughout this thesis and,
through analysis with RIOT, its performance is improved using a more optimal
set of MPI hints.
Chapter 5 contains an analysis of PLFS, a virtual file system developed at
the Los Alamos National Laboratory (LANL), showing that at mid-scale PLFS
achieves a significant performance improvement over the system’s “stock” MPI
library. The reasons for this performance improvement are analysed using
RIOT, showing that the use of multiple file streams increases the parallelism
available to applications. Due to the burden of installing PLFS on shared
re-sources, a rapid deployment option is developed called LDPLFS – a preloadable
library that can be used not only with MPI-based applications but also with the
standard UNIX tools, where the PLFS FUSE mount is not available. LDPLFS
is deployed on two supercomputers, showing that its performance matches that
of PLFS through the MPI-IO driver.
Chapter 6analyses previous works in improving performance on Lustre file
configuration produces a 49⇥performance increase in isolation, the performance
increase is nearer 10 12⇥on a system shared with multiple I/O intensive
appli-cation. Further, it is shown that using fewer resources has a negligible impact on
performance, while freeing up a significant amount of resources. In Chapter 5,
performance degradation was observed in PLFS at scale; this chapter analyses
why this slowdown occurs. Finally, this chapter presents a number of metrics
for assessing the impact of job contention on parallel file systems, and the use
of PLFS. These equations could be used to inform purchasing and configuration
decisions.
Chapter 7concludes the thesis, and discusses the implications of this research
on future I/O systems. The limitations of the research contained therein are
Performance Analysis and Engineering
Improving computational performance has been a long standing goal of many
scientists and mathematicians for thousands of years, even before the advent
of the modern computer. Devising more efficient algorithms to solve
computa-tional problems can reduce the time taken to reach a solution by many orders
of magnitude, meaning calculations relating to natural phenomena can be
per-formed in seconds rather than weeks or months.
The earliest known examples of algorithm optimisation come from
Babylo-nian mathematics [72]. Tablets dating back to around 3000 B.C.E. show that
the Babylonians had algorithms that today read very much like early computer
programs. These algorithms allowed the Babylonians to efficiently and
accu-rately calculate the results of divisions and square roots, amongst other things.
A more modern example of algorithm optimisation was used during the
Manhattan Project at the Los Alamos National Laboratory (LANL). Richard
Feynman devised a method for distributing the calculations for the energy
re-leased by di↵erent designs of the implosion bomb [64]. Through Feynman’s use
of pipelining, his team of human computers were able to produce the results
to 9 calculations in only 3 months, where 3 calculations had previously taken 9
months to produce – representing a 9⇥speed-up. Distributed computation in
this manner is one form of what is now commonly calledparallel computation.
This chapter summarises: (i) some of the basic concepts and terminology
used in parallel computation and high performance computing literature; (ii)
some of the principles used to analyse, reason about, and predict computing
performance; and finally, (iii) recent advances in performance engineering, with
2.1
Parallel Computation
The first general-purpose computer was the Electronic Numerical Integrator and
Computer (ENIAC), built in 1939. The machine was capable of performing
be-tween 300 and 500 floating point operations per second (FLOP/s). Due to the
prevalence and importance of floating point operations in modern day science
applications, the FLOP rate is the standard way in which modern
supercom-puter performance is assessed.
The era of themodern supercomputer began in the 1960s with the release of
the CDC 6600. Designed by Seymour Cray for the Control Data Corporation
(CDC), the CDC 6600 was the first mainframe computer to separate many of the
components, typically found in CPUs of the era, into separate processing units.
This resulted in the CPU being able to use a reduced instruction set, simplifying
its design, and also allowing operations usually performed by the CPU (such
as memory accesses and I/O) to instead be handled by dedicated peripheral
processors in parallel. Consequently, the CDC 6600 was approximately three
times faster than its predecessor, the IBM 7030, and the machine held the record
for the world’s fastest computer from 1964 to 1969, performing approximately
1 million floating point operations per second (1 MFLOP/s).
In the 50 years since the CDC 6600, supercomputers have become
increas-ingly more complex. The use of advanced features such as instruction pipelining,
branch prediction and SIMD (single-instruction, multiple-data) instruction sets,
has led to modern CPUs achieving up to 10 GFLOP/s of computational power
per core. A typical CPU now consists of multiple cores (as many as 16 cores
on some AMD Opteron CPUs, and many more on some GPUs and specialised
processors) and a single CPU can provide as much as four orders of magnitude
more performance than the CDC 6600’s processor.
As a result of the ever-increasing power of supercomputers, a broad range of
applications are now executed on them. Some algorithms are inherently serial,
grow-P1 P2 P3 P4
P1 P2 P3 P4
Compute
Distribute
[image:30.595.141.448.126.264.2]Reconstruct
Figure 2.1: An example of the parallelisation of a simple particle simulation between four processors.
ing size of today’s supercomputers also means that many more of these types
of application can be executed simultaneously. The increasing core density in
modern CPUs is benefitting application that use shared-memory, such as those
written using OpenMPI directives [31]. However, this thesis focuses largely on
applications using thedata-parallel paradigm, where an application divides its
data across many processors, all working towards a common goal. These
appli-cations may use a partitioned global address space (PGAS) model, where the
memory is logically partitioned and shared between cooperating processes, or
use a message passing model, where messages are explicitly exchanged between
cooperating processes.
This thesis focuses on applications using message passing, as they (i)
repre-sent a large proportion of the work performed on modern day supercomputers;
(ii) make the most use of parallel file systems; and (iii) will benefit most from
any optimisations to parallel I/O.
Figure 2.1 represents the division of a particle simulation across four
cessors. Typically a problem space is divided evenly between cooperating
pro-cessors, the local problems are solved, and then a communication phase takes
place to exchange border information. The computation of the next time step
can then commence. After a defined number of time steps, the problem space
Because of the significant decrease in runtime when applications are
paral-lelised in this way, supercomputers are now used to investigate a wide variety
of problems in both academia and industry. High performance computing is
used across a wide variety of domains such as cancer research, weapons design
and automotive aerodynamics, as well as investigating astrophysical phenomena
such as star formation.
2.2
I/O in Parallel Computing
As supercomputers have grown in compute power, so too have they grown in
complexity, size and component count. With the push towards exascale
com-puting (estimated by 2022 at the time of writing [33]), the explosion in machine
size will result in an increase in component failures. To calculate the speed
of theSequoia supercomputer, the computational benchmark (LINPACK [81])
required multiple execution attempts due to the difficulty of keeping every
com-pute node running for the required 23 hour computation, and this problem is
expected to get worse at exascale.
To combat reliability issues, long running scientific simulations now use
checkpointing to reduce the impact of a node failure. Periodically, during a
time consuming calculation, the system’s state is written out to persistent
stor-age so that in the event of a crash, the application can be restarted and
com-putation can be resumed with a minimal loss of data. Furthermore, frequent
checkpointing facilitates another important scientific endeavour – visualisation.
With a stored state recorded at set points in computation, scientists can load
these checkpoints into a visualisation tool and observe the state of a simulation
at various time steps.
2.2.1
Issues in Parallel I/O
Writing checkpoints or visualisation data from a serial application may be
P1 P2 P3 P4
File Output
(a)N-to-N
P1 P2 P3 P4
File Output
(b)N-to-root
F1 P1
F2 P2
F3 P3
F4 P4
File Output
(c)N-to-1
Figure 2.2: The three basic approaches to I/O in parallel applications.
process can be difficult. This has resulted in a number of solutions with various
advantages and disadvantages. Figure 2.2 shows three approaches to outputting
data in parallel, where (a) all ranks write their own data file; (b) all ranks send
their data to one “writer” process; and finally, (c) all ranks write their data to
the same file in parallel1.
While the fastest performance is usually achieved using the approach shown
in Figure 2.2(a), this is also the most difficult to manage. If the application
is always executed in the same fashion (using exactly the same number of
pro-cesses) this is the most efficient approach. However, should the problem be run
on a di↵ering number of cores (e.g. initially executed on N cores, writing N
files, before reloading data from N files, but on M cores), reloading the data
becomes computationally expensive and complicated as each process must read
sections from multiple di↵erent files.
Figure 2.2(b) shows the case where the root process becomes a dedicated
writer, writing all of the data to a single file, and redistributing the data in the
event of a problem reload. This is the easiest writing fashion to manage but is
also the slowest. While the computation is taking advantage of the increased
parallelism, the I/O becomes a serialisation point.
The approach taken by most simulation applications is demonstrated in
Figure 2.2(c). This approach strikes a good balance between speed and
man-1Figure 2.2(c) represents a simplified case where each rank is only writing out values from
ageability. This is also the approach most parallel file systems are designed for,
and many communication libraries provide convenient APIs for handling data
in this manner.
2.2.2
Parallel File Systems
A hard disk drive (HDD) is essentially a serial device; one piece of data can
be sent over the connector at any given time. The inner workings of a single
HDD and how this has been improved over time will be discussed in Chapter 3,
but when multiple parallel threads or simultaneously running applications are
using a single storage system, the total performance of the disk will decrease
due to the overhead associated with resource contention. On large parallel
supercomputers, not only is a single HDD not nearly large enough to handle the
required data workloads, but the performance would also decrease to the point
of the HDD being practically unusable. To produce a greater quality of service
(QoS) across a shared platform, large I/O installations are necessary, using
thousands of disks connected in parallel using technologies such as Redundant
Array of Independent Disks (RAID) [97] and distributed file systems (DFS).
Distributed File Systems
The I/O backplane of high-performance clusters is generally provided by a DFS.
The two most widely used file systems today are IBM’s General Parallel File
System (GPFS) [115] and the Lustre file system [117], both of which will be
discussed in more detail in Chapter 3.
Most DFSs in use today provide parallelism by o↵ering simultaneous access
to a large number of file servers within a common namespace – files are divided
into blocks and distributed across multiple storage backends. An application
running in parallel may then access di↵erent parts of a given file without the
interactions colliding with each other, as each block may be stored on a di↵erent
server.
Lus-tre file system, a dedicated server is used to maintain the directory Lus-tree and
properties of each file, while in GPFS the metadata is distributed across the file
servers, complicating some operations but potentially providing higher
perfor-mance metadata queries.
One precursor to both Lustre and GPFS was the Parallel Virtual File System
(PVFS) developed primarily at the Argonne National Laboratory (ANL) [22].
PVFS used the same object-based design [85] that is now common in almost all
DFSs and, like Lustre, used a single metadata server to manage the directory
tree. However, over time PVFS (and its successor PVFS2) has adopted
dis-tributed metadata to decrease the burden on a single sever. Likewise, the Ceph
file system strikes a balance between Lustre and GPFS by distributing metadata
across multiple servers. In Ceph, directory subtrees are mapped to particular
servers using a hashing function, though larger directories are mapped across
many servers to provide higher performance metadata operations [137].
Hedges et al. suggest that GPFS outperforms Lustre for almost all tasks,
except some metadata tasks, where Lustre uses caching to improve performance
while GPFS performs a disk flush and read [63]. Furthermore, Logan et al.
suggest smaller stripe sizes on a Lustre system lead to better performance [79].
The findings in this thesis and other literature demonstrates that much of the
di↵erences in performance can be explained by di↵ering hardware and software
configurations [9, 10, 142]. This thesis also suggests that larger stripe sizes may
be beneficial on some Lustre file systems at scale.
Although most DFSs provide a POSIX-compliant interface (allowing
stan-dard UNIX tools like cp, ls, etc. to be used), the best performance is often
achieved using their own APIs.
Virtual File Systems
In addition to DFSs, a variety of virtual file systems have been developed to
improve performance. One approach shown to produce large increases in write
per-forming write operations, the data is written sequentially to persistent storage
regardless of intended file o↵sets. Writing in this manner reduces the number
of expensive seek operations required on I/O systems backed by spinning disks.
In order to maintain file coherence, an index is built alongside the data so that
it can be reordered when being read. In most cases this o↵ers a large increase
in write performance, which benefits checkpointing, but does so at the expense
of poor read performance.
In the Zest implementation of a log-structured file system, the data is written
in this manner (via the fastest available path) to a temporary staging area that
has no read-back capability [94]. This serves as a transition layer, caching data
that is later copied to a fully featured file system at a non-critical time.
As well as writing sequentially to the disk, file partitioning has also been
shown to produce significant I/O improvements. Wang et al. use an I/O profiling
tool to guide the transparent partitioning of files written and read by a set of
benchmarks [135, 136]. Through segmenting the output into several files spread
across multiple disks, the number of available file streams is increased, reducing
file contention on the storage backplane. Furthermore, file locking incurs a much
smaller overhead as each process has access to its own unique file.
The parallel log-structured file system (PLFS) from LANL combines file
partitioning and a log-structure to improve I/O bandwidth [11]. In an approach
that is transparent to an application, a file access from N processes to 1 file is
transformed into an access ofN processes toN files. The authors demonstrate
speed-ups of between 10⇥and 100⇥for write performance. Due to the increased
number of file streams, they also report an increased read bandwidth when the
data is read back on the same number of nodes used to write the file [103].
With PLFS representing a single file as a directory of files, where each MPI
rank creates 2 files (an index file and a data file), there can be an enormous load
created on the underlying file system’s metadata server. Jun He et al.
demon-strate this, suggesting methods for reducing this burden and thus accelerating
While log-structured file systems usually produce a decrease in read
per-formance, the use of file partitioning in PLFS improves read performance to
a much greater extent on large I/O systems [103]. PLFS is described in more
depth in Chapter 3 and its performance is analysed in Chapter 5.
2.2.3
Parallel I/O Middleware
Writing data in parallel can be a complicated process for programmers;
ensur-ing the output doesn’t su↵er from race conditions may require explicit o↵set
calculations or file locking semantics. To simplify this process, there are a range
of parallel libraries that abstract this complex behaviour away from the
appli-cation.
Just as the Message Passing Interface (MPI) has become thede facto
stan-dard library used to abstract data communication from parallel applications, so
too has MPI-IO become the preferred method for abstracting parallel I/O [86].
The ROMIO implementation [127] – used by OpenMPI [49], MPICH2 [56] and
various other vendor-based MPI solutions [2, 15] – o↵ers a series of potential
optimisations, closing the performance gap between N-to-N and N-to-1 file
operations.
Within MPI-IO itself there are two features applicable to improving the
per-formance of all parallel file systems. Firstly, collective bu↵ering (demonstrated
in Figure 2.3) has been shown to yield a significant speed-up, initially on
appli-cations writing relatively small amounts of data [92, 126] and more recently on
densely packed nodes [142]. These improvements come in the first instance due
to larger “bu↵ered” writes that make better use of the available bandwidth and
in the second instance due to the aggregation of data to fewer ranks per node,
reducing on-node file system contention.
Secondly,data-sievinghas been shown to be extremely beneficial when using
file views to manage interleaved writes within MPI-IO [126]. In order to achieve
better utilisation of the file system, a large block of data is read into memory
File System
(a) Collective Bu↵ering O↵
File System
(b) Collective Bu↵ering On
Figure 2.3: An example of two nodes (four ranks per node) writing to a file
system with collective bu↵ering o↵and on.
back to the disk in a single block. This decreases the number of seek and write
operations that need to be performed at the expense of locking a larger portion
of the file and therefore may benefit sparse writes, where small portions of data
may need to be updated [26].
The MPI-IO specification outlines ADIO, an abstract interface for
provid-ing custom file system drivers to improve the performance of parallel file
sys-tems [125]. On the IBM BlueGene/L (and subsequent generations), a custom
driver is provided for GPFS (ad bgl) [2]. As these drivers are aware of the file
system’s APIs, they do not rely on unoptimised POSIX-compliant alternatives.
As is demonstrated later in this thesis, performance can be boosted significantly
through using file system specific drivers.
For the Lustre file system, thead lustredriver is provided in the standard
ROMIO distribution [35, 36]. Using the driver allows an application developer
to specify additional options to customise the file layout at runtime, potentially
increasing the parallelism available [9, 10, 100, 101].
In addition to drivers within the MPI-IO framework tthere are middleware
designed to standardise the I/O in scientific applications. NetCDF [106] and
Parallel NetCDF [75] exist for this purpose, with Parallel NetCDF making use
of the MPI-IO library to provide parallel and improved performance.
More commonly, the hierarchical data format (HDF-5) is used to write data
to disk for checkpointing or analysis purposes [73]. The library can be compiled
and can operate with the MPI library to allow parallel access to a common data
file; in this way the library can make use of optimisations in MPI to increase
performance [66, 146]. Additionally, PLFS has been demonstrated to improve
the performance of HDF-5 based applications by Mehta et al., dividing a single
HDF-5 output file into a data layout that is more optimal for the underlying
file system [84].
In this thesis, two applications that make use of HDF-5 are analysed,
demon-strating the shortcomings that may exist in the library’s default configuration,
while presenting opportunities for optimising performance.
2.3
Performance Engineering Methodologies
In high performance computing parlance,performance engineeringis the
collec-tion of processes by which an applicacollec-tion’s or computing system’s performance
is measured, predicted and optimised. With supercomputers typically costing
anywhere between£1.4 million (approximate cost of Minerva, the University of
Warwick operated supercomputer used throughout this thesis) and £750
mil-lion (approximate cost of K-computer, the 10 PFLOP/s supercomputer installed
at the RIKEN Advanced Institute for Computation Science in Kobe, Japan),
understanding the potential performance and utility of these machines ahead
of procurement is becoming significantly more important [60]. In addition to
making sense of the performance of a parallel machine, it is also important to
understand the performance of the applications that are expected to run on
these systems.
assess the current performance of their applications in order to understand why
they perform as they do. With this data, optimisations can be made, alongside
predictions about how hardware or software changes may a↵ect the performance
of their applications [32, 98].
2.3.1
Benchmarking
The most common way to assess a new computing architecture or parallel file
system is through the use of benchmarking. There exist multiple benchmarks
specifically designed for the assessment of supercomputers and many of these
benchmark suites form the basis of various performance rankings [6, 28, 39, 81].
For example, the LINPACK benchmark is a linear solver code that produces
a performance number (in FLOP/s) that is used to rank the most commonly
cited list of the fastest supercomputers, namely the TOP500 list [87].
For the purpose of procurement, running LINPACK on a small test
ma-chine and extrapolating the performance forward can produce an
approxima-tion of the parallel performance of a much larger, similarly architected machine
(since LINPACK scales almost linearly [39]). Additionally, benchmarks such as
STREAM [83] and SKaMPI [68] exist to assess the performance of memory and
communication subsystems.
The aforementioned benchmarks all target particular facets of parallel
ma-chines that are particularly important to performing computation. For
data-driven workloads, there are a number of benchmarks specifically designed to
assess the performance of the parallel file systems attached to these systems.
Notable tools in this area include the IOR [121] and IOBench [139] parallel
benchmarking applications. While these tools provide a good indication of
po-tential performance, much like LINPACK, they are rarely indicative of the true
behaviour of production codes. For this reason, a number of mini-application
benchmarks have been created that extract file read/write behaviour from larger
codes to ensure a more accurate representation of an application’s I/O
NAS Parallel Benchmark (NPB) Suite [7, 8] and the FLASH-IO [47, 109, 155]
benchmark from the University of Chicago – both of which are employed later
in this thesis.
2.3.2
System Monitoring and Profiling
While benchmarks may provide a measure of file system performance, their use
in diagnosing problem areas or identifying optimisation opportunities within
large codes is limited. For this activity, monitoring or profiling tools are required
to either sample the system’s state or record the system calls of parallel codes
in real-time.
Thegprof tool is often used in code optimisation to identify particular
func-tions that consume a large about of an application’s runtime [55]. For parallel
applications this task is complicated, as the program is spread across a wide
number of processes; a parallel profiler is therefore required for these
applica-tions. For Intel architectures, the VTune application can inform an engineer how
the CPU is being used, how the cache is being used and much more [69]. Oracle
Solaris Studio (formally, Sun Studio) consists of high performance compilers in
addition to a collection of performance analysis tools [27].
For parallel applications, there are a range of tools specifically designed to
monitor and record data relating to inter-process communications. Notable tools
in this area include the Integrated Performance Monitoring (IPM) suite [48]
from the Lawrence Berkley National Laboratory (LBNL), Vampir [90] from
TU Dresden, Scalasca [50] from the J¨ulich Supercomputing Centre, Tau [122]
from the University of Oregon and the MPI profiling interface (PMPI) [38].
Each of these profiling tools record interactions with the MPI library, and thus
produce large amounts data useful for identifying communication patterns and
performance bottlenecks in parallel applications. Further, both Scalasca and
Tau can generate additional data relating to performance using function
call-stack traversal and hardware performance counters.
a single workstation and record a wide range of statistics ranging from the I/O
busy time to the CPU utilisation [74]. iotop is able to provide statistics
rel-evant to a particular application, but this data is not specific to a particular
file system mount point. iostatcan provide more detail that can be targeted
to a particular file system, but does not provide application-specific
informa-tion. These two tools are targeted at single workstations, but there are many
distributed alternatives, including Collectl [118] and Ganglia [82].
Collectl and Ganglia both operate using a daemon process running on each
compute node and therefore require some administrative privileges to install
and operate correctly. Data about the system’s state is sampled and stored in
a database; the frequency of sampling therefore dictates the overhead incurred
on each node. The I/O statistics generated by the tools focus only on low-level
POSIX system calls and the load on the I/O backend and therefore the data will
include system calls made by other running services and applications. For more
specific information regarding the I/O performance of parallel science codes
many large multi-science HPC laboratories (e.g. ANL, LBNL) have developed
alternative tools.
Using function interpositioning, where a library is transparently inserted into
the library stack to overload common functions, tools such as Darshan [21] and
IPM [48] intercept the POSIX and MPI file operations. Darshan has been
de-signed to record file accesses over a prolonged period of time, ensuring that each
interaction with the file system is captured during the course of a mixed
work-load. The aim of the Darshan project is to monitor I/O activity for a substantial
amount of time on a production BG/P machine in order to guide developers and
administrators in tuning the I/O backplanes used by large machines [21].
Similarly, IPM uses an interposition layer to catch all calls between the
ap-plication and the file system [48]. This trace data is then analysed in order to
highlight any performance deficiencies that exist in the application or
middle-ware. Based on this analysis, the authors are able to optimise two applications,
ScalaTrace [93] and its I/O-based equivalent ScalaIOTrace [134] have
simi-larly been used to record and analyse the communication and I/O behaviours
of science codes. Using the MPI traces collected by ScalaTrace, the authors
have demonstrated the ability to auto-generate skeleton applications in order to
obfuscate potentially sensitive code for the purpose of benchmarking di↵ering
communication strategies and interconnects [34]. Their success in producing
applications representative of the communication behaviours of science codes
suggests that a similar methodology could be used for building I/O benchmarks.
2.3.3
Analytical Modelling
Performance modelling and simulation have been previously used to predict the
compute performance of various science codes at varying scales on hypothetical
supercomputers. Analytical models (predominantly based on the LogP [30] and
LogGP [3] models) have been heavily used to analyse the scaling behaviour of
hydrodynamic [32] and wavefront codes [60, 89], as well as many other classes
of applications [13, 16, 51, 71].
Modelling the performance of a single-disk file system may be simple for
certain configurations, where all writes are of a fixed size, large enough such
that caching e↵ects do not skew performance. More complex configurations or
usage patterns complicate matters, with issues such as head switches and head
seeks changing the performance characteristics.
Ruemmler and Wilkes present an analytical model for head seeks, in which
small seeks are handled di↵erently to larger seeks (where the head has the
op-portunity to reach its maximum speed and therefore coast for a period) [111].
Further, they demonstrate a simulator using analytical models for various
as-pects of a physical hard disk drive, but use some simulation-based modelling
to produce a complete disk model [111]. Shriver et al. produce a complete
an-alytical behaviour model for a hard disk drive, taking into account a simple
readahead cache as well as request reordering [123]. Probabilistic functions are
a model that is within 5% of the observed data for some workload traces, but
de-creases in accuracy for large multi-user systems with many parallel applications
reading from and writing to the file system.
Work has also been conducted into building an analytical model of a parallel
file system. Zhao et al. present a performance model for the Lustre file system,
demonstrating an average model error of between 17% and 28%, thus illustrating
the difficulty of modelling complex parallel I/O systems with a large number of
components [152].
While analytical models can produce near instant answers to some
per-formance modelling problems, when faced with heavy machine or file system
contention, analytical models fail to produce accurate answers [98]; for these
problems, simulation is often required.
2.3.4
Simulation-based Modelling
Two simulation platforms have been developed recently at Sandia National
Lab-oratories (SNL) and the University of Warwick. The Structural Simulation
Toolkit (SST), from SNL, provides a framework for both macro-level and
micro-level simulation of parallel science applications, simulating codes at an abstract
level (predicting MPI behaviours and approximate function timings), as well
as at a micro-instruction level [107]. Similarly, the Warwick Performance
Pre-diction (WARPP) toolkit simulates parallel science codes at macro-level, and
includes simulation parameters to introduce network contention (through the
use of a Gaussian distribution of background network load) [59, 61].
While WARPP only attempts to simulate computation and communication
behaviour, SST can also predict I/O performance using an optional plugin to
simulate a single hard disk (using DiskSim [14]). However, the module is not
included by default and is currently not capable of simulating an entire parallel
file system. Simulation of an HDD using DiskSim relies on the target disk being
benchmarked using the DIXtrac application, which determines the values for
layout, its seek profile and various disk cache timing parameters; however, much
of this feature extraction relies on features of the SCSI interface that are not
applicable to modern HDDs. For newer disks, with more complex data layouts,
geometry extraction relies on some benchmarking and guesswork.
Specifically, Gim et al. use an angular prediction algorithm, along with a host
of other metrics to determine many of these parameters [52,54]. From their data,
they can predict the data layout of the disk. Where DIXtrac currently takes up
to 24 hours to fully characterise a disk, Gim et al. demonstrate similar accuracy
(on newer disks) within an hour [54].
Additional work into disk simulation has been done by both IBM and
Hewlett-Packard (HP) Laboratories. Hsu et al. use a trace driven simulation to analyse
the performance gains of various I/O optimisations and disk improvements [67].
They assess the benefits of read caching, prefetching and write bu↵ering,
demon-strating their benefits to improving I/O performance. Likewise, Ruemmler and
Wilkes assess the impact of disk caching using a simulation, demonstrating a
large error in predictions for small operations when the cache is not modelled,
highlighting the importance of disk cache modelling [111].
Early disk caches (typically less than 2 MB in size) would partition their
available storage into equally sized blocks to allow multiple simultaneous read
operations to use the cache. Modern hard disks do not have this same
restric-tion, instead partitioning the cache according to some heuristic. Suh et al.
demonstrate, using a simulator, that the disk’s cache hit-ratio can be improved
by using an online algorithm to dynamically partition the cache [124]. Similarly,
Zhu et al. demonstrate the benefit of both read and write caching on sequential
workloads, but conclude that there is very little benefit when there are more
concurrent workloads than cache segments [154].
Thekkath et al. develop a “sca↵old” interface in order to allow them to
use a real file system module to simulate performance [129]. Their sca↵olding
simulator mimics many of the operations that would otherwise be performed by
towards a disk model.
Simulating parallel file systems is much more difficult, instead requiring the
simulation of both a shared metadata target, as well as multiple data targets.
Molina-Estolano et al. have developed IMPIOUS [88], a trace-driven parallel file
system simulator that attempts to mimic a storage system using PanFS [91].
Although their absolute results are out by an order of magnitude, the trend-line
of their results is similar to the true performance.
The CODES storage system simulator has been developed by Liu et al. to
predict the performance of a large PVFS2 installation at ANL [77]. They use
their model to predict the benefit of burst-bu↵er solid state drives (SSD) within
their installation, concluding that performance may be greatly improved if burst
bu↵er disks were deployed more widely [78].
Finally, Carns et al. use a simulator of PVFS2 in order to demonstrate
the inefficiencies in server-to-server communication, used to maintain file
con-sistency [23]. They modify the algorithms used by PVFS2 and demonstrate
speed-ups in file creation, file removal and file stat operations.
2.4
Summary
Parallel computers are forever changing, and achieving optimal performance
is becoming increasingly difficult as the technology evolves. From its humble
beginnings in the laboratories at LANL – using human computers to distribute
complex equations – to the current generation billion dollar parallel behemoths,
supercomputing has changed how science is performed. In this chapter a survey
of current research in HPC has been presented.
Of particular interest, the work performed by Carns et al. [21] and Furlinger
et al. [48] inspires much of the work in Chapter 4. Both Darshan and IPM
perform similar tasks to the tool described in this thesis, however much less
focus is put on associating the MPI library function calls with the underlying
The work of Bent et al. [11] in developing PLFS demonstrates the current
divergence between how applications perform I/O and how file systems expect
I/O to be performed. In Chapter 5, the performance gains reported in the
PLFS literature [11,62,84,103] are investigated, demonstrating that there is still
progress to be made in achieving the best performance on current-generation
parallel file systems.
Finally this thesis analyses the work of Behzad et al. [10], Lind [76] and
You et al. [148] to show that current generation file systems are often better
than reported, though this thesis demonstrates that performance often su↵ers
under contention. The work in this thesis also ties the issues associated with
file system contention back to PLFS, demonstrating that PLFS has a similar