Determine the Antigenic Evolution of Influenza A H3N2 Viruses in
U.S. Swine
Nicola S. Lewis,aTavis K. Anderson,b*Pravina Kitikoon,b*Eugene Skepner,aDavid F. Burke,aAmy L. Vincentb Department of Zoology, University of Cambridge, Cambridge, United Kingdoma
; Virus and Prion Research Unit, National Animal Disease Center, USDA-ARS, Ames, Iowa, USAb
ABSTRACT
Swine influenza A virus is an endemic and economically important pathogen in pigs, with the potential to infect other host spe-cies. The hemagglutinin (HA) protein is the primary target of protective immune responses and the major component in swine influenza A vaccines. However, as a result of antigenic drift, vaccine strains must be regularly updated to reflect currently circu-lating strains. Characterizing the cross-reactivity between strains in pigs and seasonal influenza virus strains in humans is also important in assessing the relative risk of interspecies transmission of viruses from one host population to the other. Hemagglu-tination inhibition (HI) assay data for swine and human H3N2 viruses were used with antigenic cartography to quantify the an-tigenic differences among H3N2 viruses isolated from pigs in the United States from 1998 to 2013 and the relative cross-reactiv-ity between these viruses and current human seasonal influenza A virus strains. Two primary antigenic clusters were found circulating in the pig population, but with enough diversity within and between the clusters to suggest updates in vaccine strains are needed. We identified single amino acid substitutions that are likely responsible for antigenic differences between the two primary antigenic clusters and between each antigenic cluster and outliers. The antigenic distance between current seasonal in-fluenza virus H3 strains in humans and those endemic in swine suggests that population immunity may not prevent the intro-duction of human viruses into pigs, and possibly vice versa, reinforcing the need to monitor and prepare for potential incur-sions.
IMPORTANCE
Influenza A virus (IAV) is an important pathogen in pigs and humans. The hemagglutinin (HA) protein is the primary target of protective immune responses and the major target of vaccines. However, vaccine strains must be updated to reflect current strains. Characterizing the differences between seasonal IAV in humans and swine IAV is important in assessing the relative risk of interspecies transmission of viruses. We found two primary antigenic clusters of H3N2 in the U.S. pig population, with enough diversity to suggest updates in swine vaccine strains are needed. We identified changes in the HA protein that are likely responsible for these differences and that may be useful in predicting when vaccines need to be updated. The difference between human H3N2 viruses and those in swine is enough that population immunity is unlikely to prevent new introductions of human IAV into pigs or vice versa, reinforcing the need to monitor and prepare for potential introductions.
I
nfluenza A viruses (IAV) have negative-sense RNA genomesconsisting of 8 segments. To date, IAV subtypes have been com-prised of combinations of 17 hemagglutinin (HA) and 11
neur-aminidase (NA) surface glycoproteins (1–7). Waterfowl are the
natural reservoir of most IAV subtypes, and in these species, in-fections are generally nonpathogenic. In certain instances, these viruses can cause substantial morbidity and mortality following
transmission to other species (8–10). However, only the H1N1,
H1N2, and H3N2 subtypes are endemic in swine populations
globally (11), and virulence is variable depending on properties of
the virus, the environment, and particularly the host and popula-tion immunity.
Swine influenza was first recognized as a respiratory disease that coincided with the human Spanish flu pandemic in 1918. The classical swine A(H1N1) viruses were derived from the 1918 hu-man pandemic virus and remained endemic in the swine popula-tion with little evidence of antigenic drift for approximately 80 years. In 1998, a novel virus emerged in North American pigs containing what has become known as the triple-reassortant in-ternal gene (TRIG) cassette, with genetic components from
clas-sical swine H1N1 (NP, M, and NS), human seasonal H3N2 influ-enza (PB1, HA, and NA), and North American avian influinflu-enza (PB2 and PA) viruses. The HA genes from the triple-reassortant H3N2 were the contributions of 3 separate phylogenetically dis-tinct human seasonal virus introductions, termed clusters I, II,
and III (12), with the cluster III H3 evolving into a separate cluster
IV (13). These TRIG viruses subsequently reassorted with the
clas-Received20 December 2013Accepted5 February 2014
Published ahead of print12 February 2014
Editor:A. García-Sastre
Address correspondence to Amy L. Vincent, amy.vincent@ars.usda.gov. * Present address: Tavis K. Anderson, Department of Biology, Georgia Southern University, Statesboro, Georgia, USA; Pravina Kitikoon, Merck Animal Health, De Soto, Kansas, USA.
Supplemental material for this article may be found athttp://dx.doi.org/10.1128 /JVI.03805-13.
Copyright © 2014, American Society for Microbiology. All Rights Reserved.
doi:10.1128/JVI.03805-13
on November 7, 2019 by guest
http://jvi.asm.org/
sical H1N1 swine viruses, resulting in distinct H1N1 or H1N2
subtype lineages (14–16). The H1N1 and H1N2 subtypes then
evolved in pigs to form the contemporary␣,, and␥clusters (17).
Then, in 2005, H1N1 and H1N2 influenza viruses with the HA and/or NA derived from seasonal human influenza A viruses cir-culating in 2002 emerged in pigs and spread across the United States in swine herds. Currently, H1N1, H1N2, and H3N2
sub-types of IAV are endemic in pigs in North America (12,18). The
marked genetic heterogeneity of HAs circulating in North Amer-ican pigs have potential antigenic consequences in terms of diag-nostic test efficacy, use of vaccine as a means of control, and as-sessing the relative risk of further introductions of human seasonal influenza viruses into the pig population.
Introduction of endemic swine IAV into humans continues to occur, most recently with the notable pandemic H1N1 virus (H1N1pdm09) that emerged in the human population in North
America in 2009 (19). However, in the summers of 2011 to 2013 there
were multiple infections with an H3N2 variant (H3N2v) in people attending agricultural fairs in a number of states in the United States
(20,21), with nearly 350 cases of H3N2v infection now detected in
humans (http://www.cdc.gov/flu/swineflu/variant-cases-us.htm). A
factor in the increased frequency of H3N2v detections is the relative lack of human population immunity against variants of IAV that have continued to circulate independently in swine, with the ever present potential for these variants to evolve antigenically, perhaps away from their respective human seasonal precursor viruses and the strains used in contemporary human seasonal vaccines. A substantial pro-portion of adolescents and young adults have been shown to have cross-reactive antibodies against H3N2v; however, children and
older adults lacked such protective antibodies (22,23). The current
human seasonal vaccines containing H3N2 do not appear to protect
against H3N2v (22,24). Since the vast majority of cases of H3N2v
infection have been in children with close contact and long periods of exposure at agricultural fairs, all of these factors point to a unique set of circumstances that collectively increased the odds for H3N2v
in-fection in these spillover events (25). The unique circumstances do
not diminish the epidemic or pandemic risk of H3N2v to humans if these viruses gain the ability to be efficiently transmitted from human to human, allowing the virus further opportunity to mutate and adapt to the human host. Thus, swine IAV not only cost the swine
industry in terms of animal health and production (8), but also pose
a potential risk to human health. Insights into patterns of swine IAV genetic and antigenic diversity are critical to identify risks to human and swine populations for interspecies transmission and to provide criteria for updating influenza diagnostics and vaccine composition. To accurately assess the risk to pigs from introduction of hu-man seasonal IAV and vice versa requires an understanding of the population dynamics, evolution, and biologic function of circu-lating swine IAV. Quantitative analyses of key factors that contrib-ute to zoonotic risk, namely, the relative antigenic cross-reactivity of currently circulating human and swine IAV strains, will allow improved methods of control by optimizing vaccination in swine. Here, we quantified the antigenic and genetic evolution of swine H3N2 influenza A viruses circulating in pigs from 1998 to 2013 across the United States with a focus on contemporary strains, and we related the cross-reactivity of these viruses to currently circu-lating human seasonal H3 influenza viruses used as vaccine strains, demonstrating substantial antigenic differences between contemporary swine H3N2 viruses circulating in the United States and those included in human vaccines. Integrating the antigenic
data with HA1 domain sequences, we examined the genetic basis for antigenic differences among circulating swine H3N2 isolates and identified amino acid substitutions that may lead to immune escape and vaccine failure in pigs.
MATERIALS AND METHODS
Viruses.Forty-two swine and human influenza A H3N2 viruses were selected as hemagglutinin inhibition (HI) test antigens and/or antigens for swine H3N2 antiserum production (Table 1). The swine H3N2 viruses (n⫽33) represented 12 U.S. states and major swine production regions and included 1 cluster I H3 from 1998 and 1 cluster II H3 from 1999 as historical references and 31 cluster IV isolates from 2006 to 2013 for our contemporary analysis. Viruses isolated from 1998 to 2009 (n⫽6) from outbreaks of respiratory disease in pigs from diagnostic cases were ob-tained from the University of Minnesota Veterinary Diagnostic Labora-tory (UMN-VDL) (kindly provided by Marie Culhane). The remaining 2010 to 2013 viruses were obtained from the U.S. Department of Agricul-ture (USDA) National Animal Health Laboratory Network (NAHLN) voluntary swine IAV surveillance system repository held at the National Veterinary Service Laboratories (kindly provided by Sabrina Swenson). Viruses were selected based on the H3 gene phylogeny, representing the maximum number of swine-producing states, and representing each of the clusters IV and IV-A to -F. The cluster designations were based upon phylogenetic support (nodes with supportive bootstrap values of⬎70) that also met genetic-distance criteria of⬎5% from other clusters. Avail-able virus isolates meeting these criteria with acceptAvail-able growth properties were then randomly selected for study. Human seasonal H3N2 viruses isolated from 1995 to 2011 (n⫽8) and incorporated into the 1996 to 2013 human influenza vaccines for the Northern Hemisphere were obtained from St. Jude Children’s Research Hospital (kindly provided by Richard Webby). One nonseasonal human virus, A/Indiana/08/2011, was pro-vided from the Centers for Disease Control and Prevention (CDC) (kindly provided by the late Alexander Klimov). This virus was isolated from a human case infected with swine IAV reported in July 2011 and is classified as an H3N2 variant virus. Viruses were propagated in Madin-Darby canine kidney (MDCK) cells, MDCK-London (MDCK-L) (Influ-enza Reagent Resource, VA, USA) cells, or embryonated eggs. Harvested cell culture supernatant or allantoic fluid was clarified by centrifugation, and virus was concentrated by ultracentrifugation over a 20% sucrose cushion. Virus pellets were resuspended overnight at 4°C in sterile phos-phate-buffered saline at pH 7.4 and stored at⫺80°C.
Swine antiserum production.Three-week-old cross-bred pigs free of IAV and antibody, porcine reproductive and respiratory syndrome virus, porcine circovirus 2, andMycoplasma hyopneumoniaewere obtained. For each virus, two pigs were immunized with 128 to 256 hemagglutinin units (HAU) of UV-inactivated IAV combined with 20% commercial adjuvant (Emulsigen D; MVP Laboratories, NE, USA) by the intramuscular route. Two or three doses of UV-inactivated vaccines were given approximately 2 to 3 weeks apart. The pigs were bled weekly postvaccination to test for HI titers against homologous virus. When HI titers to homologous virus reached at least 1:160, the pigs were humanely euthanized with pentobar-bital sodium (Fatal Plus; Vortech Pharmaceuticals, MI, USA) for blood collection. Sera were collected and stored at⫺20°C.
Virus antigenic characterization.HI assays using postvaccination pig antisera were performed to compare the antigenic properties of swine and human IAV. Prior to HI testing, sera were treated with receptor-destroy-ing enzyme (Sigma-Aldrich, MO, USA), heat inactivated at 56°C for 30 min, and adsorbed with 50% turkey red blood cells (RBC) to remove nonspecific inhibitors of hemagglutination. HI assays were performed by testing reference antisera raised against 18 swine and 9 human influenza A H3N2 viruses with 42 H3N2 viruses according to standard techniques. Serial 2-fold dilutions starting at 1:10 were tested for the ability to inhibit the agglutination of 0.5% turkey RBC with 4 HAU of swine and human H3N2 viruses. All HI assays were performed in duplicate.Table 1lists the viruses and reference antisera.
on November 7, 2019 by guest
http://jvi.asm.org/
Antigenic cartography.The quantitative analyses of the antigenic prop-erties of swine and human influenza A H3N2 viruses were performed using antigenic cartography as previously described for human H3 and swine influ-enza A H3 and H1 viruses (26–29). Antigenic clusters were defined using a Ward hierarchical-clustering approach—as K means clustering was biased by the large number of antigenic outliers in the data set— using Euclidean dis-tances among strains in the antigenic map implemented in R version 3.0.2 (30). To quantify the relative distances from vaccines to currently circulating viruses, we measured the antigenic distance from representative cluster I and cluster IV swine vaccine strains and the human strain, A/Victoria/361/2011, to all other swine influenza A H3N2 viruses and plotted them against the year of isolation using R version 3.0.2 (30).
Model of the structure of swine influenza A hemagglutinin.A model of the structure of the HA of A/swine/Illinois/A01241469/2012 was built by using Choral (31) and Andante (32) based upon the crystal structure of
H3N2 HA of the A/Aichi/1/68 (Protein Data Bank [PDB] code2VIU) and subsequently visualized with PyMOL (33).
[image:3.585.39.544.76.544.2]Phylogenetic and sequence analyses.Contemporary H3N2 IAV HA and NA sequences representing clade designations described previously (34) were compiled with sequences used in the HI assay (see Table S1 in the supplemental material). Amino acid alignments of the HA1 domain and NA were generated using default settings in MUSCLE v.3.8.31 (35) with subsequent manual correction in Mesquite (36). For each alignment, we inferred the best-known maximum-likelihood (ML) tree using RAxML v7.3.4 (37) by initiating 500 independent tree searches from ran-dom-start trees generated under parsimony methods implemented with the best-fit model of evolution determined in ProtTest v.3.2 (38) (data available upon request). Thereafter, we executed 1,000 nonparametric bootstraps, and the support values obtained were drawn on the best-scoring tree.
TABLE 1Viruses used to raise reference antisera in swine (underlined) and test antigens in the HI assay
Virus H3 cluster Virus propagation H3 accession no.
Swine
A/swine/Texas/4199-2/1998 H3-I MDCK CY095675
A/swine/Colorado/23619/1999 H3-II MDCK AF268128
A/swine/Minnesota/01146/2006 H3-IV MDCK CY099035
A/swine/Iowa/01700/2007 H3-IV MDCK CY099027
A/swine/Minnesota/02782/2009 H3-IV MDCK CY099103
A/swine/Illinois/02907/2009 H3-IV MDCK KF739390
A/swine/Pennsylvania/A01076777/2010 H3-IV MDCK JF263535
A/swine/New York/A01104005/2011 H3-IV (A) MDCK JN940422
A/swine/Indiana/A00968373/2012 H3-IV (A) MDCK JX534982
A/swine/Illinois/A01241469/2012 H3-IV (A) MDCK JX422497
A/swine/Michigan/A01259000/2012 H3-IV (A) MDCK-L JX442056
A/swine/Wyoming/A01444562/2013 H3-IV (A) MDCK KC562197
A/swine/North_Carolina/A01432566/2013 H3-IV (A) MDCK KC841842
A/swine/Minnesota/A01300213/2012 H3-IV (B) MDCK JX657030
A/swine/Minnesota/A01125993/2012 H3-IV (B) MDCK JX422257
A/swine/Minnesota/A01327922/2012 H3-IV (B) MDCK JX422521
A/swine/Iowa/A01300195/2012 H3-IV (B) MDCK JX657018
A/swine/Minnesota/A01432544/2013 H3-IV (B) MDCK KC841830
A/swine/Minnesota/A01280592/2013 H3-IV (B) MDCK KC589443
A/swine/Indiana/A01202866/2011 H3-IV (C) MDCK JX092535
A/swine/Michigan/A01432375/2013 H3-IV (C) MDCK KC534987
A/swine/Illinois/A01201606/2011 H3-IV (D) MDCK CY107066
A/swine/Iowa/A01202613/2011 H3-IV (D) MDCK-L JX092307
A/swine/Iowa/A01202889/2011 H3-IV (D) MDCK-L JX092542
A/swine/Iowa/A01203196/2012 H3-IV (D) MDCK-L JQ739697
A/swine/Michigan/A01203498/2012 H3-IV (D) MDCK JX163265
A/swine/Iowa/A01049750/2011 H3-IV (F) MDCK JN652493
A/swine/Texas/A01049914/2011 H3-IV (F) MDCK JN652507
A/swine/Illinois/A01241066/2012 H3-IV (F) MDCK JX422557
A/swine/Iowa/A01203121/2012 H3-IV (F) MDCK-L JX092555
A/swine/Nebraska/A01241171/2012 H3-IV (F) MDCK-L JX422575
A/swine/Nebraska/A01271549/2012 H3-IV (F) MDCK KC222305
A/swine/Iowa/A01432500/2013 H3-IV (F) MDCK KC755694
Human
A/Wuhan/359/1995 Vaccine strain (1996–1998) MDCK-L AY661190
A/Sydney/5/1997 Vaccine strain (1998–2000) MDCK-L CY039079
A/Moscow/10/1999 Vaccine strain (2000–2004) MDCK-L AY531035
A/Fujian/411/2002 Vaccine strain (2004–2005) MDCK-L EF541397
A/Wisconsin/67/2005 Vaccine strain (2006–2008) MDCK-L CY034116
A/Brisbane/10/2007 Vaccine strain (2008–2010) Egg CY039087
A/Perth/16/2009 Vaccine strain (2010–2012) Egg GQ293081
A/Victoria/361/2011 Vaccine strain (2012–2013) Egg KC306165
A/Indiana/08/2011 H3N2v: H3-IV(A) MDCK JN638733
on November 7, 2019 by guest
http://jvi.asm.org/
To estimate the average rate of nucleotide substitution in the HA1 domain, we constructed a second data set incorporating all U.S. swine IAV H3N2 HA1 sequences from 1997 to the present. Nucleotide sequences were downloaded from the Influenza Virus Resource (39) on 2 July 2013 (see Table S2 and Fig. S1 in the supplemental material). A maximum-likelihood tree was inferred using RAxML (v7.4.2) (37) on the CIPRES Science Gateway (40), employing a general time reversible (GTR) model of nucleotide substitution with⌫-distributed rate variation among sites. The starting tree was generated under parsimony methods, with the best-scoring tree and statistical support values obtained with the rapid boot-strap algorithm (1,000 replications). Subsequently, we extracted the pa-tristic distance from A/Wuhan/359/95 in the ML tree to each isolate in the cluster IV H3N2 swine IAV clade using the program R v.3.0.2 with the APE (41) and GEIGER (42) packages. Linear models of genetic distance (response vector) and time (linear predictor for response) were fitted using the program R v.3.0.2 (30).
HA1 domain deduced amino acid sequence alignments were used to calculate the number of amino acid substitutions between pairs of isolates. We made genetic maps using a method similar to that used for antigenic maps, except that the target distances were the numbers of amino acid substitutions between the amino acid sequences for each antigen in the antigenic map (26).
Analyses of antigenic evolution.Not all substitutions are responsible for antigenic changes in the HA. An X-to-Y amino acid substitution at location L is considered a “cluster difference” substitution between clus-ters A and B if all (or all but one) isolates in cluster A have amino acid X at location L and all (or all but one) isolates in cluster B have amino acid Y at location L (26,43). We used this classification and the HA1 domain amino acid alignments mentioned above to determine which amino acids likely defined the differences among swine influenza A H3N2 virus antigenic clusters and outlying variants and compared these results to the antigenic effects of the cluster difference substitutions observed for H3N2 influenza A viruses in humans (43).
RESULTS
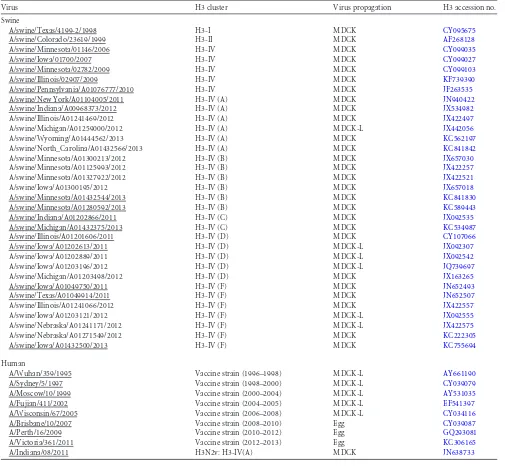
Swine H3N2 viruses are antigenically diverse.Cross-HI titers were tabulated (see Table S3 in the supplemental material) and used for antigenic-cartography analyses. One strain, A/swine/ Minnesota/01146/2006, showed the broadest cross-reactivity against the swine H3N2 antisera tested and may serve as a suitable contemporary reference strain. However, among the swine and human influenza A H3N2 viruses, HI cross-reactivity was highly variable, and these antigenic relationships are shown in the
three-dimensional (3D) antigenic map inFig. 1A, with each antigen
colored according to the antigenic cluster to which it belonged. The swine viruses circulating between 2006 and 2013 formed two major antigenic groups, the cyan and the red antigenic clusters. Other, more antigenically diverse strains arising between 2010 and 2013 were also observed, classified as outliers in the cluster analyses, and identified with unique color coding. A/Wuhan/359/1995 and the cluster I prototype swine influenza A H3N2 virus are shown in light blue, and A/Sydney/5/1997, A/Moscow/10/1999, and the cluster II prototype swine influenza A H3N2 viruses are shown in light pink. The light-gray spheres are human H3N2 isolates from 2002 to 2011, and the large gray sphere is A/Victoria/361/2011.
Genetic evolution of U.S. swine H3 between 1995 and 2013.
The ML phylogenetic tree (Fig. 2A) shows that the genetic
evolu-tion of the swine influenza A (H3N2) viruses consisted of 5 con-temporary clades that evolved from cluster IV. In agreement with the criteria previously suggested, a 5 to 7% average pairwise
nu-cleotide distance threshold (18) continued to define the new
pu-tative clusters of contemporary swine H3 virus. Thus, clusters A, B, C, E, and F were identified as newly formed genetic clusters, as
evidenced by the pairwise criteria, as well as onward transmission
into 2013 and continued genetic evolution.Figure 2Cshows the
genetic map made from pairwise differences among strains and again demonstrates the HA clade evolution of currently circulat-ing strains.
There was a lack of concordance between the topology of the
HA and NA gene phylogenies (Fig. 2Aand3). The NA phylogeny
reveals that the majority of our contemporary isolates have an N2 gene derived from a 2002 human origin N2 lineage. However, there were no H3 cluster predilections for the possession of the 1998 or 2002 lineage N2 genes, with the exception of cluster IV-F. This is demonstrated by isolates classified with specific cluster IV lineages using the HA gene but scattered incongruously through-out the NA gene lineage.
To evaluate the amount of variation accrued over time in the swine H3 genes, the distance from A/Wuhan/359/95 to each
iso-late in cluster IV was plotted as a function of time (Fig. 4). The
regression line had a slope of 0.006 (xintercept⫽ ⫺11.58⫾0.27
standard error [SE]; adjustedR2⫽0.75;P⬍0.0001); the slope
gives the rate of evolution of nucleotide substitutions per year. There was an apparent increase in diversity since the emergence and reassortment of the H1N1pdm09 viruses in the U.S. swine population in 2009; however, limited sampling prior to 2009 may have biased our inference. The solid regression line for the 3 years
prior to 2009 had a slope of 0.003 (xintercept⫽ ⫺7.84⫾1.31 SE;
adjustedR2⫽0.30;P⬍0.0001), whereas the dashed regression
line for 2010 to present had a slope of 0.005 (x intercept ⫽
⫺10.40⫾0.68 SE; adjustedR2⫽0.31:P⬍0.0001). Though the
regression lines had significantly different intercepts (analysis of
covariance [ANCOVA];P⬍0.0001), the difference in rates of
evolutionary change was suggestive but not statistically significant
(ANCOVA;P⫽0.12). Retrospective sampling of viruses isolated
prior to 2009 or alternate phylogenetic techniques are required to tease apart these dynamics.
Predictability of antigenic cluster by phylogenetic cluster.
Since vaccine strain selection or the choice of currently available vaccine for swine in the United States relies primarily on the ge-netic similarity at the nucleotide level between vaccine strains and the outbreak strain, we investigated whether the antigenic pheno-type could be predicted from the genetic cluster of a particular
isolate. When we colored the ML phylogenetic tree (Fig. 2B) and
genetic map (Fig. 2D) according to the antigenic cluster to which
each strain belonged, we found that the antigenic cluster was not predicted from the phylogenetic clade alone or pairwise compar-ison of amino acid sequences, particularly for isolates in clusters IV-A, -B, -D, and -F. For example, red antigenic cluster isolates were located genetically in the newly formed clusters IV-A, -B, and -D. Cyan antigenic cluster isolates were located genetically in clade IV and clade IV-F. The isolate A/swine/Pennsylvania/A01076777/ 2010 was a genetic outlier not clustered in one of the newly emerged phylogenetic branches, yet it mapped antigenically with the red cluster.
Genetic basis for antigenic differences among currently cir-culating swine influenza A (H3) viruses.To investigate the mo-lecular basis of the antigenic clusters, we aligned the amino acid sequences used in this study (see Fig. S2 in the supplemental material), grouped and color coded them based on the anti-genic cluster, and marked them with the cluster-defining amino acid substitutions relative to the earliest cluster I H3 cluster in pigs from a Wuhan 95-like human seasonal influenza
on November 7, 2019 by guest
http://jvi.asm.org/
A H3 virus introduction. A subsequent seasonal human influ-enza A H3 virus introduction into pigs from a Sydney 97-like virus led to the swine cluster II viruses and differs from the Wuhan-like cluster I strains at amino acid positions 156 and 158 for all antigens.
Focusing on the currently circulating strains in North Ameri-can pigs, we found 2 main antigenic clusters and 10 different an-tigenic variants mapping a significant anan-tigenic distance away
from the two primary clusters (the red cluster inFig. 1Band the
cyan cluster inFig. 1C). The cyan cluster consisted of strains
iso-lated from 2004 to 2012 and contains strains from the same ge-netic cluster as the putative cluster IV swine vaccine strain. The red cluster consisted of strains isolated from 2010 to 2013 and in-cluded the H3N2v strain A/Indiana/08/2011 representing the
hu-man agricultural fair outbreaks of 2011 and 2012 (Fig. 1B). The
two spheres colored gold represent the isolate A/swine/Minneso-ta/A01125993/2012, which differed from the red cluster at posi-tions 145 and 159 (2 A/swine/Minnesota/A01125993/2012 iso-lates with different passage histories were analyzed here, and thus,
the data were not combined). One or both of these 2 amino acid substitutions (N145K and Y159N) likely resulted in the 6-antigen-ic-unit distance from the red cluster. The strain colored in light green, isolated in 2013 (A/swine/Wyoming/A01444562/2013), differed
from the red cluster only at position 145 and was⬃5 antigenic units
away from the red cluster. The strain colored blue, A/swine/Michi-gan/A01203498/2012, differed from the majority of the red cluster
strains at positions 145 and 155 and was positioned⬃5 antigenic
units away. A/swine/North_Carolina/A01432566/2013 (dark green) differed from the red cluster at positions 145, 156, and 189 and was 7.5 antigenic units away. The two strains colored purple (A/swine/ Nebraska/A01271549/2012 and A/swine/Iowa/A01432500/2013) differed from the red cluster at two amino acid positions (N145K and K189R/S) and were 8 and 9.4 antigenic units away. They differed
from each other only at position 189 and are⬃1 antigenic unit apart.
Thus, 189R was likely antigenically equivalent to 189S with little effect on antigenicity in this background. A/swine/Nebraska/A01241171/ 2012 (dark pink) differed from the red cluster at positions 145 and
189 and was also⬃9 antigenic units away.
FIG 13D antigenic maps of swine influenza A(H3N2) and human influenza A(H3N2) viruses from 1998 to 2013 and positions of key amino acids on the three-dimensional trimeric model of the hemagglutinin protein. (A) The relative positions of isolates (colored spheres) and antisera (open gray cubes) were computed so that the distances between isolates and antisera in the map correspond with the least error to measurements in the HI assay (26). The swine isolate color represents the antigenic cluster to which each isolate belongs, and the gray spheres represent recent human influenza A(H3N2) viruses. The large gray sphere is A/Victoria/361/2011. The scale bar represents 1 unit of antigenic distance, corresponding to a 2-fold dilution of antiserum in the HI assay. (B and C) Antigenic maps with only swine influenza A(H3N2) viruses showing the antigenic effects of the amino acid substitutions for each antigenic variant that was not located within the red (B) or the cyan (C) antigenic clusters. The arrows radiate from the consensus in each cluster to the outlying antigen, and the numeric values show the number of antigenic units (AU) separating the outlier from the antigens representing the consensus. (D) A trimeric structure of A/swine/Illinois/ A01241469/2012 (red antigenic cluster) was generated to demonstrate the location of the antigenic cluster-differentiating amino acid positions. The receptor-binding site is colored in tan. An␣2,6 glycan (LSTc) is shown as sticks docked in the binding site. The six amino acid positions associated with antigenic outliers are colored red. The images were produced using PyMOL (33).
on November 7, 2019 by guest
http://jvi.asm.org/
[image:5.585.112.475.62.383.2]The cyan cluster differed from the red cluster at amino acid posi-tions 155 and 189. The strains colored brown (A/swine/Indiana/ A01202866/2011 and A/swine/Michigan/A01432375/2013), repre-sentative of strains that were isolated from both pigs and turkeys,
differed from the cyan cluster at amino acid positions 155, 156, 158, 159, and 189 and were 4.4 to 4.9 antigenic units away. The orange strain (A/swine/Iowa/A01203196/2012) differed from the cyan clus-ter at positions 145, 156, and 189 and was 4.4 antigenic units away
FIG 2Maximum-likelihood phylogenies (A and B) and genetic maps (C and D) of representative H3N2 swine influenza A virus isolates using HA1 domain amino acid sequences. The numbers above or below branches in the phylogenetic trees indicate bootstrap support (%) estimated from 1,000 resamplings of the sequence data; bootstrap values ofⱕ50% are not shown. H3N2 HA sublineages are indicated on the right (clusters I, II, II, and IV-A/B/C/D/E/F). Taxon names indicate viral isolates, followed by GenBank or GISAID EpiFlu accession identifiers in parentheses. The branches are colored by genetic cluster (A) and antigenic cluster (B); the branches in light gray were not part of the antigenic study. The scale bars in the phylogenies indicate the numbers of amino acid substitutions per site. The genetic maps were based on pairwise differences among strains, and the spheres representing virus strains are colored by genetic cluster (C) or antigenic cluster (D). The scale bars in the genetic maps correspond to 5 amino acid substitutions.
on November 7, 2019 by guest
http://jvi.asm.org/
[image:6.585.57.538.68.592.2](Fig. 1C). Thus, despite ongoing genetic evolution at the nucleotide and amino acid levels across the entire length of the HA, as few as one or two amino acid substitutions in the HA1 domain were sufficient to change the antigenic properties of the swine influenza A(H3N2) vi-ruses to move them between the red and cyan clusters or to define a
new antigenic cluster or outlier. The amino acids that distinguished
clusters when mapped onto the HA trimer (Fig. 1D) were found to be
close to the receptor-binding site.
Antigenic distance from swine influenza A virus vaccine strains.To consider the effect this observed antigenic diversity
FIG 3Maximum-likelihood phylogeny of NA gene amino acid sequences from viruses in the antigenic study and representative H3N2 swine influenza A isolates. The branches are colored by HA genetic cluster; the branches in light gray were not part of the study. The numbers above or below branches in the phylogenetic trees indicate bootstrap support (%) estimated from 1,000 resamplings of the sequence data; bootstrap values ofⱕ50% are not shown. H3N2 NA sublineages are indicated on the right (1998 versus 2002). Taxon names indicate viral isolates, followed by GenBank or GISAID EpiFlu accession identifiers in parentheses. The scale bar in the phylogeny indicates amino acid substitutions.
on November 7, 2019 by guest
http://jvi.asm.org/
might have on vaccine strain efficacy, we measured the antigenic distances from genetic representatives of putative vaccine strains (the actual strain identities are proprietary information) to cur-rently circulating swine H3N2 viruses. Current vaccine strains in
fully licensed swine IAV products are either genetic cluster I (Fig.
2A, orange viruses) or cluster IV (Fig. 2A, red viruses). The most
recent vaccine representative from cluster IV was isolated in 2005. When we measured the antigenic distances from a serum raised to
either a cluster I (Fig. 5A) or a cluster IV (Fig. 5B) strain to other
currently circulating influenza A H3N2 virus strains in pigs, we found that all currently circulating strains were greater than 2 antigenic units from the cluster I vaccine serum, and most strains were over 4 antigenic units away. Within the panel of cluster IV viruses, we found that some strains were within 2 antigenic units of the putative vaccine serum, but the majority of isolates were greater than 3 antigenic units from the vaccine strain. Therefore, vaccination with clade I or clade IV vaccine strains are unlikely to
prevent virus infection and/or shedding (44). We also found that
the distances from the two putative swine vaccine sera to human seasonal H3N2 strains were over 4 antigenic units in viruses iso-lated since 1995, and a seasonal strain isoiso-lated from humans in 2011 (A/Victoria/361/2011) was 6 antigenic units from the cluster IV serum and 8 antigenic units from the cluster I serum. Such antigenic distances suggest that future incursions of a current hu-man seasonal H3N2 strain into pigs are unlikely to be mitigated by immunity from either the cluster I or cluster IV vaccines currently in use in pigs.
Antigenic distance to human seasonal vaccine strains.We also quantified the antigenic distances between currently circulat-ing swine strains and A/Victoria/361/2011, the most recent
hu-man seasonal vaccine strain representative (Fig. 5C). We found
that all currently circulating swine strains were over 4 antigenic
FIG 4Patristic distance from A/Wuhan/359/95 in the maximum-likelihood phylogenetic tree presented in Fig. S1 in the supplemental material to each isolate in the cluster IV H3N2 swine influenza A virus clade plotted as a func-tion of time. The solid line represents the regression for the 3 years prior to 2009, with a slope of 0.003 (xintercept⫽ ⫺7.84⫾1.31 SE; adjustedR2⫽0.30:
P⬍0.0001), whereas the dashed line represents the regression for the isolates from 2010 to the present, with a slope of 0.005 (xintercept⫽ ⫺10.40⫾0.68 SE; adjustedR2⫽0.31:Pvalue⬍0.0001).
FIG 5Antigenic distances from putative cluster I (A) and cluster IV (B) swine vaccine sera and antigenic distances from the human seasonal vaccine strain A/Victoria/361/2011 swine sera (C) to circulating strains in pigs by year.
on November 7, 2019 by guest
http://jvi.asm.org/
[image:8.585.43.286.62.271.2] [image:8.585.307.534.62.683.2]units away from the most recent representative human H3N2 strain and some as many as 8 antigenic units away; thus, future incursions of current swine strains into humans may not be mit-igated by immunity to the current human seasonal vaccines.
DISCUSSION
Here, we quantified the antigenic diversity among currently cir-culating swine and human H3 influenza A viruses using HI assay data and antigenic cartography. The swine H3N2 viruses demon-strated antigenic diversity in the cross-HI assays. In the antigenic maps, we saw a clustered antigenic evolution similar to that shown
for the H1 viruses (␣,,␥,␦-1, and␦-2) (28), with marked
anti-genic distances within and between two antianti-genic clusters, dem-onstrating the substantial antigenic diversity in the milieu of ge-netically evolving H3N2 viruses circulating in U.S. pigs. Although a previous study utilizing different methodology with a ferret an-tiserum panel against 8 swine H3N2 viruses identified two anti-genic clusters of swine H3N2 from 2006 to 2012, primarily from
one U.S. state (20), our study with a serum panel of 18 swine
H3N2 viruses covering 12 states and major hog-producing re-gions and generated in the natural host demonstrated greater overall antigenic diversity and a greater number of outliers. In addition, our study included representatives from each of the newly emerging phylogenetically defined clusters, contributing significantly to the amount of antigenic diversity we observed.
The genetic evolution of both the HA and the NA of H3N2 viruses in pigs was visualized in the ML phylogenetic trees and was
consistent with previous analyses (18,34). However, we observed
that there was a relative mismatch between the phylogenetic to-pologies of HA and NA, where the NA gene segment was not necessarily consistent with the HA gene segment. The exception was the 2012 and 2013 H3N2v and the clade IV-F viruses, where there was good correlation between the relative tree topologies of HA and NA. This suggests that coevolution between HA and NA pairs may not have an important role in contemporary H3N2 virus fitness and that the inconsistent tree topologies likely arose from frequent reassortment or other ecological or immunological
pressures (45).
The rate of change in ML distances of the HA gene in U.S. swine H3N2 of 0.006 per year was similar to an estimate of 0.0047 from previously published work on the evolution of swine H3N2 viruses in European pigs and 0.006 in human seasonal H3N2 from
1982 to 2002, reported in the same study (27). However, the
over-all genetic evolutionary rate in U.S. swine H3N2 from 1997 to 2013 was weighted by the increased evolution from 2010 to 2013, following the introduction of and subsequent reassortment with H1N1pdm09. The mutation rates of circulating H3 HA genes also appear to differ between animal hosts. For example, the rate of change of ML distances of H3 subtype viruses in horses was 0.002, less than half the rate observed in pigs. This is likely due to a number of factors, including virus, individual host, and popula-tion factors.
The rapid genetic evolution seen with our swine H3 data prompted our investigation into quantifying the impact on anti-genic diversity in contemporary U.S. swine H3N2. We found clus-tered antigenic evolution of H3N2 viruses in pigs from the United States similar to that previously quantified in European pigs. In Europe, H3N2 viruses continued to circulate and evolve in pigs following the H3 pandemic of 1968 in humans and subsequent introduction into the pig population. Despite similar rates of
ge-netic change, European swine H3N2 viruses evolved 6 times more slowly antigenically than human influenza H3N2 viruses over a
similar period (27). Although H3N2 viruses were introduced into
North American pigs around 1997 and have continued to circu-late, new antigenic variants arose that are antigenically distinct from ancestrally related H3N2 viruses circulating in humans. In addition, we observed far greater antigenic diversity of H3N2 vi-ruses circulating in U.S. pigs in a much shorter period than with viruses circulating in European pigs. Coupled with the antigenic diversity, we observed cocirculation of different antigenic clusters within the pig population rather than replacement, as seen in hu-man influenza H3 evolution. Despite relatively similar genetic evolution rates in North American and European swine H3N2 viruses, as well as human seasonal H3N2, the within-host anti-genic evolution in pigs in the United States does not parallel the antigenic evolutionary patterns of H3N2 viruses in European pigs, people, or horses, likely because of host population and virus fac-tors that are currently undetermined.
Surprisingly, the substitutions that resulted in marked anti-genic differences were attributed in most cases to one or two amino acid changes in the HA-1 domain, located at 6 amino acid positions (145, 155, 156, 158, 159, and 189), strikingly similar to the 7 key amino acid changes recently identified in human anti-genic switches from 1968 to 2003: 145, 155, 156, 158, 159, 189, and
193 (43). Furthermore, similarities were also observed between
the H3 HA evolution seen in humans, pigs, and horses (see Table S4 in the supplemental material for direct comparison of observed substitutions in three host species). Although the precise amino acid substitutions differed or were present in different combina-tions in particular host species, similar amino acid posicombina-tions were associated with antigenic-cluster-defining substitutions in all three hosts, and all were located close to the receptor-binding site. These observations were consistent when natural host sera were used to characterize the antigenic properties of the viruses, as was the case in this study, or when ferret sera were used as a small-animal model to characterize H3 viruses circulating in either horses or humans. Of particular note is position 145, which caused the difference between A/Beijing/1992 and A/Wuhan/1995
vi-ruses in humans (43). Here, we observed that A/swine/Minnesota/
A01125993/2012 had substitutions at position 145 (N145K) and position 159 (Y159N) associated with an antigenic change of 6 antigenic units away from the red cluster. This is, remarkably, at the same linear amino acid position as the S145N/R substitution associated with the difference between the first and second
anti-genic clusters that emerged in European pigs (27). We also found
that positions 155 and 189 defined the antigenic difference be-tween the red (155Y-189K) and the cyan (155H-189R) swine
an-tigenic clusters, whereas Feng et al. (20) reported only R189K as
defining the two antigenic clusters of U.S. swine H3N2 in that study. The role of the R189K substitution has been explored in
swine (46), and position 189 has been consistently identified as
cluster defining in other species, as well. In the evolution of equine H3, the European-like cluster was distinguished from the Ameri-can-like cluster by the amino acid substitution K189N, -D, -Q, or
-E (47). Position 189 was also key in the human influenza A H3
antigenic evolution from A/England/1972 to A/Victoria/1975 and in combination with positions 155 and 159 in the evolution from
A/Bangkok/1979 to A/Sichuan/1987 (43). Although position 189
seems to be more consistently identified among different species and in different studies, it is clear that it is not the sole position
on November 7, 2019 by guest
http://jvi.asm.org/
responsible for cluster transition substitutions in human (43) and now swine H3N2. While the amino acid positions associated with antigenic variability were conserved among host species, the mechanism by which the individual substitutions act in the differ-ent host species is not known. The amino acid changes may cause structural differences in the hemagglutinin, leading to receptor-binding constraints in different hosts, differences in qualitative and quantitative adaptive immune recognition, or a combination of the above.
In the context of the swine humoral response represented by our serum panel and circulating swine H3N2 viruses, contempo-rary human seasonal H3N2 viruses were shown to have substan-tial antigenic distance from the contemporary swine H3N2 viruses, although these lineages share an ancestor from the mid-1990s. We showed that between 4 and 8 antigenic units separated the human seasonal vaccine strain representative A/Victoria/361/ 2011 from all currently circulating strains in pigs. This indicates that despite a potentially high level of immunity against swine H3N2 in the pig population in the United States, a future incur-sion of human seasonal H3N2 is possible if the event produced a virus fit for pig-to-pig transmission. The increasing antigenic dis-tance of the A/Victoria/361/2011 H3N2 and other previous hu-man seasonal vaccine strains from the contemporary swine H3N2 also suggests the youngest of the human population may become increasingly susceptible to incursions of swine H3N2 due to lack of cross-reacting immunity. Indeed, a dramatic number of H3N2v infections in humans, primarily children, in the United States were detected in 2011 to 2013, and studies with human sera dem-onstrated a lack of cross-reacting HI antibodies in children and
the elderly (22,23). Further study of human sera tested against a
panel of swine H3N2 viruses representing the antigenic diversity we demonstrate here is required to fully understand the level of human population immunity to H3N2 endemic in the pig popu-lation.
The marked antigenic diversity seen in H3N2 viruses in pigs since 2010 poses problems in assessing the relative risk of swine variants emerging in the human population and in using vaccine as an effective means of IAV control in pigs. How differences in host factors alter the relative evolution of viruses in these two hosts is poorly understood, but some factors that might alter the evolu-tionary pattern of the HA gene within pigs in comparison with H3 in the human host population include differing life spans and replacement rates of pigs versus humans, more continental sepa-ration of pigs than of humans, and relative spatial sepasepa-ration of sow farms but movement and mixing of weaned pigs to the Mid-west from the southeast and southMid-west United States and Canada
(48). All these factors might lead to different population
immu-nological profiles and thus alter the evolutionary patterns of vi-ruses. This complex immunological profile is exacerbated by dif-ficulty in updating inactivated vaccines to contain representatives of currently circulating strains and the subsequent lack of an ideal vaccine for all situations in pig production.
A national surveillance system was established in 2009 by the U.S. Department of Agriculture in response to the 2009 H1N1 pandemic, the growing diversity of swine viruses, and increasing
numbers of detections of zoonotic events in humans (18). The
number of isolates with sequence data from this surveillance stream has grown significantly, building the foundation for sys-tematic sequence analyses to pair with antigenic assessment. Phy-logenetic analysis of contemporary H3 suggested an increasing
rate of evolution since the emergence and subsequent
reassort-ment with the H1N1pdm09 virus (18,34), and here, we
demon-strate the resulting antigenic diversity. The USDA surveillance sys-tem and analyses such as ours, reported here, can now begin to be used to inform vaccine strain selection for swine. However, to improve and further facilitate vaccine strain updates, a vaccine strain selection working group established to collectively provide cross-HI and phylogenetic data from various laboratories and sec-tors together for interpretation and discussion would be benefi-cial. Changes in regulatory processes to allow rapid replacement of HA and NA on approved IAV backbones or platforms would also be extremely useful for improving control measures against influ-enza A virus in swine. Additionally, platforms not currently avail-able in swine, such as live attenuated influenza vaccines or vec-tored vaccines, have shown great promise in experimental settings for improved heterologous protection and greater efficacy in the
face of maternally derived antibodies (44,49–54).
Here, we found that as few as one or two amino acid substitu-tions resulted in new antigenic clusters and/or outliers. Since these cluster-defining amino acid changes were shown to be enough to result in vaccine failure in other host species, we need to continue to systematically monitor the evolution of swine IAV for vaccine strain updates. Such information is also critical to increase our understanding of what governs the evolutionary mechanisms in different hosts and in improving control measures for influenza A viruses to protect the health and well-being of swine, a primary protein food source for humans, as well as the respiratory health of the human population.
ACKNOWLEDGMENTS
We thank Michelle Harland, Gwen Nordholm, and Alicia Janas-Martin-dale for excellent technical assistance and Jason Huegal, Jason Crabtree, and Tyler Standley for animal care and handling assistance.
Mention of trade names or commercial products in this article is solely for the purpose of providing specific information and does not imply recommendation or endorsement by the U.S. Department of Agriculture. Funding was provided by USDA-ARS and USDA-APHIS. N.S.L. was funded by USDA-ARS SCA agreement number 58-3625-2-103F and EC FP7 award number 259949.
REFERENCES
1.Anonymous.1980. A revision of the system of nomenclature for influenza viruses: a WHO memorandum. Bull. World Health Organ.58:585–591. 2.Fouchier RAM, Munster V, Wallensten A, Bestebroer TM, Herfst S,
Smith D, Rimmelzwaan GF, Olsen B, Osterhaus ADME.2005. Charac-terization of a novel influenza A virus hemagglutinin subtype (H16) ob-tained from black-headed gulls. J. Virol.79:2814 –2822.http://dx.doi.org /10.1128/JVI.79.5.2814-2822.2005.
3.Hinshaw VS, Air GM, Gibbs AJ, Graves L, Prescott B, Karunakaran D. 1982. Antigenic and genetic characterization of a novel hemagglutinin subtype of influenza A viruses from gulls. J. Virol.42:865– 872. 4.Kawaoka Y, Yamnikova S, Chambers TM, Lvov DK, Webster RG.1990.
Molecular characterization of a new hemagglutinin, subtype H14, of in-fluenza A virus. Virology179:759 –767.http://dx.doi.org/10.1016/0042 -6822(90)90143-F.
5.Röhm C, Zhou N, Süss J, Mackenzie J, Webster RG.1996. Character-ization of a novel influenza hemagglutinin, H15: criteria for determina-tion of influenza A subtypes. Virology217:508 –516.http://dx.doi.org/10 .1006/viro.1996.0145.
6.Tong S, Li Y, Rivailler P, Conrardy C, Alvarez Castillo DA, Chen L-M, Recuenco S, Ellison JA, Davis CT, York IA, Turmelle AS, Moran D, Rogers S, Shi M, Tao Y, Weil MR, Tang K, Rowe LA, Sammons S, Xu X, Frace M, Lindblade KA, Cox NJ, Anderson LJ, Rupprecht CE, Donis RO.2012. A distinct lineage of influenza A virus from bats. Proc. Natl.
on November 7, 2019 by guest
http://jvi.asm.org/
Acad. Sci. U. S. A. 109:4269 – 4274. http://dx.doi.org/10.1073/pnas .1116200109.
7.Tong S, Zhu X, Li Y, Shi M, Zhang J, Bourgeois M, Yang H, Chen X, Recuenco S, Gomez J, ChenL-M, Johnson A, Tao Y, Dreyfus C, Yu W, McBride R, Carney PJ, Gilbert AT, Chang J, Guo Z, Davis CT, Paulson JC, Stevens J, Rupprecht CE, Holmes EC, Wilson IA, Donis RO.2013. New world bats harbor diverse influenza a viruses. PLoS Pathog. 9:e1003657.http://dx.doi.org/10.1371/journal.ppat.1003657.
8.Brown IH.2000. The epidemiology and evolution of influenza viruses in pigs. Vet. Microbiol.74:29–46.http://dx.doi.org/10.1016/S0378-1135(00)00164-4. 9.Myers KP, Olsen CW, Gray GC. 2007. Cases of swine influenza in
humans: a review of the literature. Clin. Infect. Dis.44:1084 –1088.http: //dx.doi.org/10.1086/512813.
10. Shinde V, Bridges CB, Uyeki TM, Shu B, Balish A, Xu X, Lindstrom S, Gubareva LV, Deyde V, Garten RJ, Harris M, Gerber S, Vagasky S, Smith F, Pascoe N, Martin K, Dufficy D, Ritger K, Conover C, Quinlisk P, Klimov A, Bresee JS, Finelli L.2009. Triple-reassortant swine influ-enza A (H1) in humans in the United States, 2005–2009. N. Engl. J. Med. 360:2616 –2625.http://dx.doi.org/10.1056/NEJMoa0903812.
11. Vincent A, Awada L, Brown I, Chen H, Claes F, Dauphin G, Donis R, Culhane M, Hamilton K, Lewis N, Mumford E, Nguyen T, Parchari-yanon S, Pasick J, Pavade G, Pereda A, Peiris M, Saito T, Swenson S, Van Reeth K, Webby R, Wong F, Ciacci-Zanella J.2014. Review of influenza A virus in swine worldwide: a call for increased surveillance and research. Zoonoses Public Health61:4 –17.http://dx.doi.org/10.1111/zph .12049.
12. Webby RJR, Swenson SLS, Krauss SLS, Gerrish PJP, Goyal SMS, Web-ster RGR.2000. Evolution of swine H3N2 influenza viruses in the United States. J. Virol.74:8243– 8251.http://dx.doi.org/10.1128/JVI.74.18.8243 -8251.2000.
13. Olsen CW, Karasin AI, Carman S, Li Y, Bastien N, Ojkic D, Alves D, Charbonneau G, Henning BM, Low DE, Burton L, Broukhanski G. 2006. Triple reassortant H3N2 influenza A viruses, Canada, 2005. Emerg. Infect. Dis.12:1132–1135.http://dx.doi.org/10.3201/eid1207.060268. 14. Karasin AI, Landgraf J, Swenson S, Erickson G, Goyal S, Woodruff M,
Scherba G, Anderson G, Olsen CW.2002. Genetic characterization of H1N2 influenza A viruses isolated from pigs throughout the United States. J. Clin. Microbiol. 40:1073–1079. http://dx.doi.org/10.1128/JCM.40.3 .1073-1079.2002.
15. Webby RJ, Rossow K, Erickson G, Sims Y, Webster R.2004. Multiple lineages of antigenically and genetically diverse influenza A virus co-circulate in the United States swine population. Virus Res.103:67–73. http://dx.doi.org/10.1016/j.virusres.2004.02.015.
16. Vincent AL, Ma W, Lager KM, Janke BH, Richt JA. 2008. Swine influenza viruses a North American perspective. Adv. Virus Res.72:127– 154.http://dx.doi.org/10.1016/S0065-3527(08)00403-X.
17. Vincent AL, Ma W, Lager KM, Gramer MR, Richt JA, Janke BH.2009. Characterization of a newly emerged genetic cluster of H1N1 and H1N2 swine influenza virus in the United States. Virus Genes39:176 –185.http: //dx.doi.org/10.1007/s11262-009-0386-6.
18. Anderson TK, Nelson MI, Kitikoon P, Swenson SL, Korslund JA, Vincent AL.2013. Population dynamics of cocirculating swine influenza A viruses in the United States from 2009 to 2012. Influenza Other Respir. Viruses7:42–51.http://dx.doi.org/10.1111/irv.12193.
19. Garten RJ, Davis CT, Russell CA, Shu B, Lindstrom S, Balish A, Sessions WM, Xu X, Skepner E, Deyde V, Okomo-Adhiambo M, Gubareva L, Barnes J, Smith CB, Emery SL, Hillman MJ, Rivailler P, Smagala J, de Graaf M, Burke DF, Fouchier RAM, Pappas C, Alpuche-Aranda CM, López-Gatell H, Olivera H, López I, Myers CA, Faix D, Blair PJ, Yu C, Keene KM, Dotson PD, Boxrud D, Sambol AR, Abid SH, St George K, Bannerman T, Moore AL, Stringer DJ, Blevins P, Dem-mler-Harrison GJ, Ginsberg M, Kriner P, Waterman S, Smole S, Gue-vara HF, Belongia EA, Clark PA, Beatrice ST, Donis R, Katz J, Finelli L, Bridges CB, Shaw M, Jernigan DB, Uyeki TM, Smith DJ, Klimov AI, Cox NJ.2009. Antigenic and genetic characteristics of swine-origin 2009 A(H1N1) influenza viruses circulating in humans. Science325:197–201. http://dx.doi.org/10.1126/science.1176225.
20. Feng Z, Gomez J, Bowman AS, Ye J, Long L-P, Nelson SW, Yang J, Martin B, Jia K, Nolting JM, Cunningham F, Cardona C, Zhang J, Yoon K-J, Slemons RD, WanX-F.2013. Antigenic characterization of H3N2 influenza A viruses from Ohio agricultural fairs. J. Virol.87:7655–7667. http://dx.doi.org/10.1128/JVI.00804-13.
21. Lindstrom S, Garten R, Balish A, Shu B, Emery S, Berman L, Barnes N,
Sleeman K, Gubareva L, Villanueva J, Klimov A.2012. Human infec-tions with novel reassortant influenza A(H3N2)v viruses, United States, 2011. Emerg. Infect. Dis.18:834 – 837.http://dx.doi.org/10.3201/eid1805 .111922.
22. Skowronski DM, Janjua NZ, De Serres G, Purych D, Gilca V, Scheifele DW, Dionne M, Sabaiduc S, Gardy JL, Li G, Bastien N, Petric M, Boivin G, Li Y.2012. Cross-reactive and vaccine-induced antibody to an emerg-ing swine-origin variant of influenza A virus subtype H3N2 (H3N2v). J. Infect. Dis.206:1852–1861.http://dx.doi.org/10.1093/infdis/jis500. 23. Centers for Disease Control and Prevention. 2012. Prevention and
control of influenza with vaccines: recommendations of the Advisory Committee on Immunization Practices (ACIP)—United States, 2012–13 influenza season. MMWR Morb. Mortal. Wkly. Rep.61:613– 618. 24. Houser KV, Pearce MB, Katz JM, Tumpey TM.2013. Impact of prior
seasonal H3N2 influenza vaccination or infection on protection and transmission of emerging variants of influenza A(H3N2)v virus in ferrets. J. Virol.87:13480 –13489.http://dx.doi.org/10.1128/JVI.02434-13. 25. Bowman AS, Sreevatsan S, Killian ML, Page SL, Nelson SW, Nolting
JM, Cardona C, Slemons RD.2012. Molecular evidence for interspecies transmission of H3N2pM/H3N2v influenza A viruses at an Ohio agricul-tural fair, July 2012. Emerg. Microbes Infect.1:e33.http://dx.doi.org/10 .1038/emi.2012.33.
26. Smith DJ, Lapedes AS, de Jong JC, Bestebroer TM, Rimmelzwaan GF, Osterhaus ADME, Fouchier RAM. 2004. Mapping the antigenic and genetic evolution of influenza virus. Science305:371–376.http://dx.doi .org/10.1126/science.1097211.
27. De Jong JC, Smith DJ, Lapedes AS, Donatelli I, Campitelli L, Barigazzi G, Van Reeth K, Jones TC, Rimmelzwaan GF, Osterhaus ADME, Fouchier RAM.2007. Antigenic and genetic evolution of swine influenza A (H3N2) viruses in Europe. J. Virol.81:4315– 4322.http://dx.doi.org/10 .1128/JVI.02458-06.
28. Lorusso A, Vincent AL, Harland ML, Alt D, Bayles DO, Swenson SL, Gramer MR, Russell CA, Smith DJ, Lager KM, Lewis NS.2011. Genetic and antigenic characterization of H1 influenza viruses from United States swine from 2008. J. Gen. Virol.92:919 –930.http://dx.doi.org/10.1099/vir .0.027557-0.
29. Nfon CK, Berhane Y, Hisanaga T, Zhang S, Handel K, Kehler H, Labrecque O, Lewis NS, Vincent AL, Copps J, Alexandersen S, Pasick J. 2011. Characterization of H1N1 swine influenza viruses circulating in Canadian pigs in 2009. J. Virol.85:8667– 8679.http://dx.doi.org/10.1128 /JVI.00801-11.
30. Core Team R.2013. R: a language and environment for statistical com-puting, 3rd ed. R Foundation for Statistical Comcom-puting, Vienna, Austria. 31. Montalvao RW, Smith RE, Lovell SC, Blundell TL.2005. CHORAL: a differ-ential geometry approach to the prediction of the cores of protein structures. Bioinformatics21:3719–3725.http://dx.doi.org/10.1093/bioinformatics/bti595. 32. Smith RE, Lovell SC, Burke DF, Montalvao RW, Blundell TL.2007. Andante:
reducing side-chain rotamer search space during comparative modeling using environment-specific substitution probabilities. Bioinformatics23:1099–1105. http://dx.doi.org/10.1093/bioinformatics/btm073.
33. PyMOL.2010. The PyMOL molecular graphics system, version 1.3r1. Schrödinger, LLC, Mannheim, Germany.http://www.pymol.org. 34. Kitikoon P, Nelson MI, Killian ML, Anderson TK, Koster L, Culhane
MR, Vincent AL.2013. Genotype patterns of contemporary reassorted H3N2 virus in US swine. J. Gen. Virol.94:1236 –1241.http://dx.doi.org /10.1099/vir.0.51839-0.
35. Edgar RC.2004. MUSCLE: multiple sequence alignment with high accu-racy and high throughput. Nucleic Acids Res.32:1792–1797.http://dx.doi .org/10.1093/nar/gkh340.
36. Maddison WP, Maddison DR.2011. Mesquite: a modular system for evolutionary analysis, 2nd ed.http://mesquiteproject.org.
37. Stamatakis A.2006. RAxML-VI-HPC: maximum likelihood-based phy-logenetic analyses with thousands of taxa and mixed models. Bioinformat-ics22:2688 –2690.http://dx.doi.org/10.1093/bioinformatics/btl446. 38. Darriba D, Taboada GL, Doallo R, Posada D.2011. ProtTest 3: fast
selection of best-fit models of protein evolution. Bioinformatics27:1164 – 1165.http://dx.doi.org/10.1093/bioinformatics/btr088.
39. Bao Y, Bolotov P, Dernovoy D, Kiryutin B, Zaslavsky L, Tatusova T, Ostell J, Lipman D.2008. The influenza virus resource at the National Center for Biotechnology Information. J. Virol.82:596 – 601.http://dx.doi .org/10.1128/JVI.02005-07.
40. Miller MA, Pfeiffer W, Schwartz T.2010. Creating the CIPRES Science Gateway for Inference of Large Phylogenetic Trees, p 1– 8. Proceedings of
on November 7, 2019 by guest
http://jvi.asm.org/
the Gateway Computing Environments Workshop (GCE), 14 November 2010, New Orleans, LA.
41. Paradis E, Claude J, Strimmer K.2004. APE: analyses of phylogenetics and evolution in R language. Bioinformatics20:289 –290.http://dx.doi .org/10.1093/bioinformatics/btg412.
42. Harmon LJ, Weir JT, Brock CD, Glor RE, Challenger W.2008. GEIGER: investigating evolutionary radiations. Bioinformatics24:129 –131.http: //dx.doi.org/10.1093/bioinformatics/btm538.
43. Koel BF, Burke DF, Bestebroer TM, van der Vliet S, Zondag GCM, Vervaet G, Skepner E, Lewis NS, Spronken MIJ, Russell CA, Eropkin MY, Hurt AC, Barr IG, De Jong JC, Rimmelzwaan GF, Osterhaus ADME, Fouchier RAM, Smith DJ.2013. Substitutions near the receptor binding site determine major antigenic change during influenza virus evo-lution. Science342:976 –979.http://dx.doi.org/10.1126/science.1244730. 44. Loving CL, Lager KM, Vincent AL, Brockmeier SL, Gauger PC, Ander-son TK, Kitikoon P, Perez DR, Kehrli ME. 2013. Efficacy in pigs of inactivated and live attenuated influenza virus vaccines against infection and transmission of an emerging H3N2 similar to the 2011–2012 H3N2v. J. Virol.87:9895–9903.http://dx.doi.org/10.1128/JVI.01038-13. 45. Nelson MI, Detmer SE, Wentworth DE, Tan Y, Schwartzbard A, Halpin
RA, Stockwell TB, Lin X, Vincent AL, Gramer MR, Holmes EC.2012. Genomic reassortment of influenza A virus in North American swine, 1998 –2011. J. Gen. Virol.93:2584 –2589.http://dx.doi.org/10.1099/vir.0 .045930-0.
46. Ye J, Xu Y, Harris J, Sun H, Bowman AS, Cunningham F, Cardona C, Yoon KJ, Slemons RD, WanX-F.2013. Mutation from arginine to lysine at the position 189 of hemagglutinin contributes to the antigenic drift in H3N2 in swine. Virology446:225–229.http://dx.doi.org/10.1016/j.virol .2013.08.004.
47. Lewis NS, Daly JM, Russell CA, Horton DL, Skepner E, Bryant NA, Burke DF, Rash AS, Wood JLN, Chambers TM, Fouchier RAM, Mum-ford JA, Elton DM, Smith DJ.2011. Antigenic and genetic evolution of
equine influenza A (H3N8) virus from 1968 to 2007. J. Virol.85:12742– 12749.http://dx.doi.org/10.1128/JVI.05319-11.
48. Nelson MI, Lemey P, Tan Y, Vincent A, LamTT-Y, Detmer S, Viboud C, Suchard MA, Rambaut A, Holmes EC, Gramer M. 2011. Spatial dynamics of human-origin H1 influenza A virus in North American swine. PLoS Pathog.7:e1002077.http://dx.doi.org/10.1371/journal.ppat .1002077.
49. Pena L, Vincent AL, Loving CL, Henningson JN, Lager KM, Lorusso A, Perez DR.2012. Restored PB1-F2 in the 2009 pandemic H1N1 influenza virus has minimal effects in swine. J. Virol.86:5523–5532.http://dx.doi .org/10.1128/JVI.00134-12.
50. Gauger PC, Vincent AL, Loving CL, Lager KM, Janke BH, Kehrli ME, Jr, Roth JA.2011. Enhanced pneumonia and disease in pigs vaccinated with an inactivated human-like (d-cluster) H1N2 vaccine and challenged with pandemic 2009 H1N1 influenza virus. Vaccine29:2712–2719.http: //dx.doi.org/10.1016/j.vaccine.2011.01.082.
51. Khurana S, Loving CL, Manischewitz J, King LR, Gauger PC, Henningson J, Vincent AL, Golding H.2013. Vaccine-induced anti-HA2 antibodies promote virus fusion and enhance influenza virus respiratory disease. Sci. Transl. Med. 5:200ra114.http://dx.doi.org/10.1126/scitranslmed.3006366.
52. Vincent AL, Lager KM, Janke BH, Gramer MR, Richt JA.2008. Failure of protection and enhanced pneumonia with a US H1N2 swine influenza virus in pigs vaccinated with an inactivated classical swine H1N1 vaccine. Vet. Microbiol.126:310 –323.http://dx.doi.org/10.1016/j.vetmic.2007.07 .011.
53. Salmon H, Berri M, Gerdts V, Meurens F.2009. Humoral and cellular factors of maternal immunity in swine. Dev. Comp. Immunol.33:10.http: //dx.doi.org/10.1016/j.dci.2008.07.007.
54. Polewicz MM, Gracia AA, Buchanan RR, Strom SS, Halperin SAS, Potter AAA, Babiuk LAL, Gerdts VV.2011. Influence of maternal anti-bodies on active pertussis toxoid immunization of neonatal mice and pig-lets. Vaccine29:7718 –7726.http://dx.doi.org/10.1016/j.vaccine.2011.07 .135.