De novo assembly,
characterization, functional
annotation and expression patterns
of the black tiger shrimp (Penaeus
monodon) transcriptome
Roger Huerlimann
1,2, Nicholas M. Wade
1,3, Lavinia Gordon
1,4, Juan D. Montenegro
4,
Jake Goodall
1,3, Sean McWilliam
3, Matthew Tinning
1,4, Kirby Siemering
1,4, Erika Giardina
1,5,
Dallas Donovan
1,5, Melony J. Sellars
1,3, Jeff A.
Cowley
1,3, Kelly Condon
1,2, Greg J. Coman
1,7,
Mehar S. Khatkar
1,6, Herman W. Raadsma
1,6, Gregory E. Maes
2,8,9, Kyall R. Zenger
1,2&
Dean R. Jerry
1,2The black tiger shrimp (Penaeus monodon) remains the second most widely cultured shrimp species globally; however, issues with disease and domestication have seen production levels stagnate over the past two decades. To help identify innovative solutions needed to resolve bottlenecks hampering the culture of this species, it is important to generate genetic and genomic resources. Towards this aim, we have produced the most complete publicly available P. monodon transcriptome database to date based on nine adult tissues and eight early life-history stages (BUSCO - Complete: 98.2% [Duplicated: 51.3%], Fragmented: 0.8%, Missing: 1.0%). The assembly resulted in 236,388 contigs, which were then further segregated into 99,203 adult tissue specific and 58,678 early life-history stage specific clusters. While annotation rates were low (approximately 30%), as is typical for a non-model organisms, annotated transcript clusters were successfully mapped to several hundred functional KEGG pathways. Transcripts were clustered into groups within tissues and early life-history stages, providing initial evidence for their roles in specific tissue functions, or developmental transitions. We expect the transcriptome to provide an essential resource to investigate the molecular basis of commercially relevant-significant traits in P. monodon and other shrimp species.
The black tiger shrimp Penaeus monodon belongs to the family Penaeidae and is the second most widely farmed shrimp species globally1. However, disease and limited progress in domestication and selective breeding of P.
monodon continue to hamper further expansion of the industry2. Modern genomic technologies have significant potential to advance selective breeding programs; however, they require complete, well annotated tissue-specific transcriptomic and genomic datasets. In addition to assisting in genome assembly and creating linkage maps3, a complete transcriptome provides a potential resource for focussed differential gene-expression studies4, genome annotation5, single nucleotide polymorphism discovery6 and genome scaffolding7.
1ARC Research Hub for Advanced Prawn Breeding, Townsville, QLD, 4811, Australia. 2Centre for Sustainable Tropical
Fisheries and Aquaculture, College of Science and Engineering, James Cook University, Townsville, QLD, 4811, Australia. 3Aquaculture, CSIRO Agriculture and Food, 306 Carmody Road, St Lucia, QLD, 4067, Australia. 4Australian
Genome Research Facility Ltd, The Walter and Eliza Hall Institute, 1G Royal Parade, Parkville, VIC, 3050, Australia.
5Seafarms Group Ltd, Level 11 225 St Georges Terrace, Perth, WA, 6000, Australia. 6Sydney School of Veterinary
Science, Faculty of Science, The University of Sydney, Sydney, NSW, Australia. 7Aquaculture, CSIRO Agriculture and
Food, 144 North Street, Woorim, QLD, 4507, Australia. 8Laboratory of Biodiversity and Evolutionary Genomics, KU
Leuven, Leuven, 3000, Belgium. 9Center for Human Genetics, UZ Leuven- Genomics Core, KU Leuven, Leuven, 3000,
Belgium. Roger Huerlimann and Nicholas M. Wade contributed equally. Correspondence and requests for materials should be addressed to R.H. (email: [email protected])
Received: 6 April 2018 Accepted: 12 August 2018 Published: xx xx xxxx
www.nature.com/scientificreports/
While genomic resources for Penaeid shrimp are increasing, they remain limited for many species, including
P. monodon. Previous research has focussed on hepatopancreas, ovary, heart, muscle and eyestalk tissues8,9, in male and female gonads10, and in response to infection with Vibrio bacterial species capable of inducing acute hepatopancreatic necrosis disease11. In addition to such differential gene-expression studies, genomic data from next generation sequencing (NGS) methods has expanded greatly in recent years, particularly in the study of Pacific white shrimp (Litopenaeus vannamei)3,6,12–23. Moreover, a transcriptome based on eight tissues was assembled for the less well studied banana shrimp Fenneropenaeus merguiensis24, and genes involved in early embryonic specification have been studied in Marsupenaeus japonicus25. Transcriptomics has also been applied to Penaeus merguiensis26–28 and the Chinese white shrimp Fenneropenaeus chinensis29,30 to investigate aspects of tissue-specific expression, stress tolerance and viral infection. Despite these advances, a comprehensive transcrip-tome from diverse tissue types and early life-history stages of P. monodon remains unavailable.
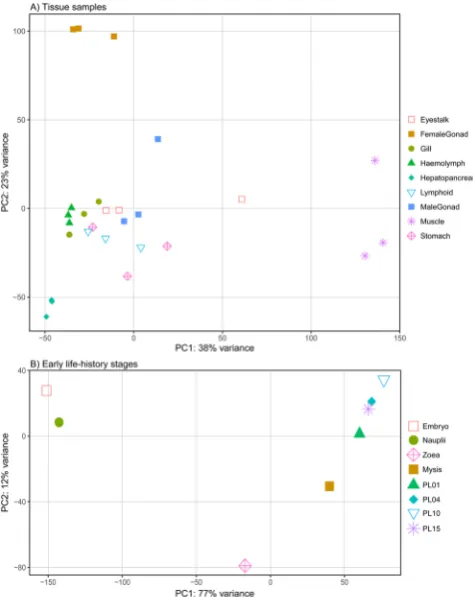
In order to address this deficiency, we report a highly complete transcriptome for P. monodon that can be used as a broad basis for future genomics research. To this effect, we sequenced three replicates each from nine dif-ferent tissues types (eyestalk, stomach, female gonad, male gonad, gill, haemolymph, hepatopancreas, lymphoid organ and tail muscle) and one pooled replicate each from four larval stages (embryo, nauplii, zoea, and mysis) and four post-larval stages ranging from days 1, 4, 10 and 15. Additionally, transcript expression profiles unique to each type and stage were determined, as well as identifying putative long non-coding RNA and transcripts originating from viruses.
Results
Sequence read data and code availability.
In total, nine tissues were sequenced in biological triplicates, as well as pools of eight early life-history stages, resulting in an average of 19.9 M ± 1.6 M (mean ± SD) read pairs per sample and 697 M reads in total (Table 1). After quality trimming, 99.5% ± 0.6% (mean ± SD) of reads were retained, indicating a high quality data set (>90% reads with ≥Q30). All read data are available on GenBank through the project ID PRJNA421400.Transcriptome assembly and quality control.
The initial combined outputs of all four assemblers comprised of 6,113,055 contigs, which were reduced to 462,772 contigs after filtering with Evidential Gene and combining both “okay” and “alternative” contigs. After clustering with Transfuse, the final assembly consisted of 236,388 transcripts with an assembly size of 226 Mb. These, together with transcript annotations, are available on GenBank. The final transcriptome had a high TransRate score of 0.37, with 88% of all reads successfully mapping back to the transcriptome, and only 3.2% of bases being uncovered. Based on BUSCO, the transcriptome was highly complete with 98% of arthropod ortholog genes being present, and few fragmented or missing genes; however, 51% of the contigs were duplicated/redundant (C:98.2%[S:46.9%, D:51.3%], F:0.8%, M:1.0%, n:1066).Annotation and gene ontology mapping.
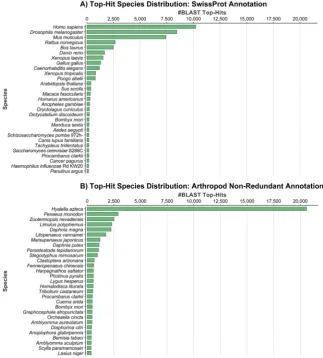
Annotation against the SwissProt database using BLASTx resulted in 47,871 successfully annotated contigs. Of these, 46,977 were successfully GO mapped, of which 41,069 were completely annotated. The top-hit species distribution was dominated by Homo sapiens with over 10,000 hits, followed by Drosophila melanogaster with just over 8,000 hits; no shrimp species made it into the list (Fig. 1A). GO terms for biological processes, molecular function and cellular components were all highly repre-sented in annotated genes (Fig. 2).The annotation against the non-redundant Arthropod (nrA) database using BLASTx resulted in 62,679 suc-cessfully annotated contigs, of which 48,456 had a successful GO mapping, and of which 25,201 were completely annotated. The top-hit species distribution was dominated by the freshwater amphipod Hyalella azteca with over 20,000 hits, followed by P. monodon with just over 2,500 hits (Fig. 1B). Other penaeid shrimp species included
Litopenaeus vannamei, Marsupenaeus japonicus and Fenneropenaeus chinensis, which were the sixth, seventh and twelfth most highly represented species respectively.
Detailed information on the annotations can be found in Supplementary Table S1.
Sequence read mapping and differential gene expression analysis.
Using Bowtie2, 67.4% ± 4.8% (mean ± SD) of the paired reads successfully mapped to the transcriptome. Using corset for read counting and additional clustering, the initial 236,388 contigs were placed into 99,203 transcript clusters for the nine tissue types and 58,678 transcript clusters for the eight early life-history stages (larval and post-larval stage). A total of 176,966 contigs were used in the clustering of tissues and larvae, with 113,435 shared contigs, 8,188 contigs unique to larvae and 55,343 contigs unique to adult tissues.Different tissue types expressed between 9,939 and 12,255 transcript clusters (defined as >50 normalized read counts per cluster), and between 17 and 316 unique sets of transcript clusters (defined as a cluster with >10 normalized read counts and <10 normalized read counts in all other tissue types) (Table 2). The ability to anno-tate transcript clusters varied across tissue types (63.0% to 85.9%). In terms of unique tissue specific transcript clusters, hepatopancreas contained the largest number (316), followed by female gonad (161) and gill (153). Annotation rates of these unique tissue-specific clusters were markedly lower (12.5% to 66.8%) than with clusters shared across all tissue types (82.5% and 85.9%)
variance in transcript clusters expressed across the different discrete larval stages, which appears to be strongly associated with larval development leading from embryo to post-larval stages.
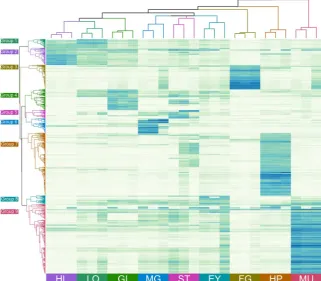
The top 2,000 most variably expressed transcript clusters across all nine tissue types clustered into nine dis-tinct groups using Pearson’s correlation (Fig. 4). These groups aligned broadly with expression patterns identified to be unique to each tissues type. For example, group two comprised 208 clusters highly expressed in female gonad, which were mostly successfully annotated (81.8%) using the nrA database. Annotated transcripts included farnesoic acid O-methyltransferase (FAmET), phosphoenolpyruvate carboxykinase (PEPCK), glutathione perox-idase (GPx) and nasrat. Transcripts in each cluster and their annotation are detailed in Supplementary Table S2. Group four consisted of clusters expressed mainly in male gonad that were annotated relatively poorly (38.7%) with many (35.5%) not expressed in the early life-history stages (Table 3). Group nine was the largest and com-prised 591 clusters that were mostly annotated (86.0%) and expressed predominantly in muscle tissue. Group seven consisted of 533 clusters that were also mostly annotated (85.7%) and expressed predominantly in hepato-pancreatic tissue. Except for male gonad, most clusters expressed in adult tissue types were also expressed in the early life-history stages.
The same top 500 most variably expressed transcript clusters in the different larval and post-larval stages used for the PCA broadly clustered into nine distinct groups based on Pearson’s correlation (Fig. 5). Irrespective of the annotation success, the analysis identified transcript clusters that shared similar expression patterns across developmental stages. Embryos and nauplii expressed a set of genes that were not expressed during any other developmental stage (groups 7 and 8). Of the 140 genes expressed exclusively within the embryo and nauplii stages (group 8), only 24.3% and 37.1%, respectively, were annotated successfully using the SWISS-PROT or nrA databases (Table 4). Of the transcript clusters that were annotated, 13 encoded orthologs of the neurotrophic
Shrimp ID Sex Tissue Number of paired-end reads
PM_F_08 Female
Eyestalk 18,984,152 Gill 19,971,115 Hepatopancreas 18,831,682
PM_F_02 Female
Female Gonad 21,338,933 Haemolymph 20,105,399 Muscle 20,361,299 Stomach 13,470,106
PM_F_04 Female
Female Gonad 20,255,448 Gill 21,362,076 Haemolymph 20,247,206 Stomach 21,461,589 PM_F_03 Female Female Gonad 20,759,890
PM_M_02 Male
Eyestalk 21,076,111 Hepatopancreas 19,029,973 Male Gonad 20,669,419 Muscle 20,129,858
PM_M_04 Male
Eyestalk 22,250,295 Gill 20,396,956 Haemolymph 21,637,767 Hepatopancreas 20,854,492 Male Gonad 20,600,256 Muscle 22,464,431 Stomach 16,444,377 PM_M_06 Male Male Gonad 19,800,274 PM_M_C2 Male Lymphoid Organ 19,873,753 PM_M_C3 Male Lymphoid Organ 20,480,178 PM_F_C1 Female Lymphoid Organ 20,372,862
Pool_E Embryo 19,745,313
Pool_N Nauplii 18,310,089
Pool_Z Zoea 19,528,689
Pool_M Mysis 19,744,563
Pool_PL1 PL1 19,815,103
Pool_PL4 PL4 18,680,555
Pool_PL10 PL10 18,773,667
Pool_PL15 PL15 19,661,826
[image:3.595.155.377.52.475.2]www.nature.com/scientificreports/
factor spaetzle and another 13 encoded orthologs of cuticular proteins. Transcripts in each cluster and their anno-tation are detailed in Supplementary Table S3. Two large clusters of genes were expressed from zoea throughout each subsequent stage (group 1), or from mysis throughout each subsequent stage (group 4). A high percentage (61.2% and 83.1%) of transcripts in these two clusters was annotated. Since each larval stage was sequenced as a pool of individuals, differential gene expression (DGE) analysis could not be performed.
Identification of long non-coding RNAs.
We used the set of 1,047 complete USCOs as the training set for classification of coding and non-coding transcripts. It was determined that a coding potential of 0.2642 was the appropriate threshold to balance classification specificity and sensitivity. In total 79,656 transcripts were classified as lncRNAs and the remaining 154,893 transcripts were classified as mRNAs.Comparing the lncRNA annotation with the BLASTx annotation, out of the 236,388 contigs 67,960 were uniquely identified as lncRNA, while 13,535 contigs were annotated both as mRNA and lncRNA. At a clus-ter level, 12,079 out of 58,768 larval clusclus-ters (22.6%) and 23,645 out of the 99,203 tissue clusclus-ters (23.8%) were uniquely annotated as lncRNA. Detailed results of the lncRNA analysis can be found in Supplementary Table S4.
KEGG pathway analysis.
Annotated contigs were overlaid onto their respective biological pathways using the Kyoto Encyclopaedia of Genes and Genomes (KEGG) pathways. Genes involved in general eukaryotic cellular processes such as RNA replication (Fig. 6) and basal transcription factor sequences (Fig. 7) were well represented in the P. monodon transcriptome. As expected, assignments to KEGG pathways in prokaryotes were rare, as were ribosomal RNA assignments. The various biological processes, metabolism and signalling cascades comprising all 235 KEGG pathways to which transcripts were assigned are detailed in Supplementary Table S5. [image:4.595.154.478.47.406.2]baculoviruses. Additional BLASTx searches of the GenBank nr database using representative contigs confirmed them to be or likely be endogenous shrimp gene transcripts. The remaining 21 contigs had Top Hit E-value scores identifying them to be related most closely to strains of Gill-associated virus (GAV; 4 contigs, longest 26,235 nt),
Penaeus chinensis hepandenovirus (PchiHDV; 4 contigs, longest 1,884 nt), Wenzhou shrimp virus 2 (WSV2; RdRp, hypothetical protein and G protein contigs, longest 6,891 nt), Wenzhou shrimp virus 8 (WSV8; 6 contigs, longest 4,579 nt), Beihai picorna-like virus 2 (5,277 nt), Wenzhou picorna-like virus 23 (551 nt) and Moloney murine leukaemia virus Pr180 sequence (Mo-MuLV; 2,431 nt). Additionally, Deformed wing virus (DWV; 10,133 nt) was present in two out of 35 samples; however, further investigation confirmed that this was caused by a highly localized cross-contamination from other samples with a high content of a specific strain of DWV during sequencing. Lastly, over 1200 contigs with homology to phages were detected, some of which related to phage tail protein and tetracycline resistance.
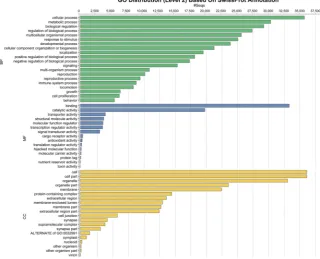
Figure 2. Distribution of sequence annotations based on the SWISS-PROT database across the top 20 GO terms at level 2. Determined across the entire dataset for Biological Process (BP, green), Molecular Function (MF, blue), and Cellular Component (CC, yellow).
Tissue type
Total expressed clusters Uniquely expressed clusters
Number % Annotated (SP/nrA) Number % Annotated (SP/nrA) Eyestalk 11,173 67.3/72.8 31 29.0/48.4 Female Gonad 9,941 74.3/79.7 161 37.3/45.3 Gill 12,255 63.7/69.8 153 30.7/39.2 Haemolymph 10,577 66.1/71.4 17 23.5/29.4 Hepatopancreas 12,169 67.7/73.9 316 49.7/66.8 Lymphoid Organ 11,923 63.0/68.5 24 54.2/66.7 Male Gonad 10,387 71.9/77.5 71 32.4/42.3 Muscle 11,405 66.9/72.4 77 33.8/48.1 Stomach 9,939 68.6/73.7 24 12.5/33.3 Constitutive 4,300 82.5/85.9 — —
[image:5.595.157.478.50.309.2]www.nature.com/scientificreports/
Discussion
Here we report a comprehensive black tiger shrimp (Penaeus monodon) transcriptome assembled from nine tissues, four larval stages and four post-larval stages. The transcriptome was generated to expand the genetic resources available for this species to help investigate the genetic basis behind larval developmental stage transi-tions and tissue functioning, as well as traits with potential to be exploited commercially for the aquaculture of this and other shrimp species. The aim was therefore to generate a highly complete P. monodon transcriptome at the risk of it containing higher levels of transcript redundancy. This was confirmed by BUSCO results which demonstrated the transcriptome to be highly complete (C:98.2%) with low fragmentation (F:0.8%) or missing (M: 1.0%) genes but high levels of duplication (D:51.3%). These assembly statistics are comparable to those obtained by a transcriptome assembly from L. vannamei15 (C:98.0%, F:0.7%, M:1.3%, D:25.5%), but greatly exceeded those of another P. monodon assembly focussing on gonadial tissue recently made available publicly10 (C:33.7%, F:44.9%, M:21.4%, D:6.8%). As other recent NGS analyses of P. monodon have focussed on only one or two tissue types without including any larval stages or biological replicates, generated fewer total reads, or experienced data loss due to quality trimming of low quality reads or low mapping efficiencies8–11, these are likely to have missed many transcripts. In contrast, the sequencing and assembly strategy used here covered more tissue types at greater read depth and employed multiple de novo assembly tools to reduce assembler bias.
Using the nrA database, 30.0% of transcript clusters found in the nine tissue types and 38.1% of transcript clusters found in the eight larval/post-larval stages analysed were successfully annotated. These annotation levels were comparable to those reported to date in similar studies on different crustaceans8,15,24,31. While transcript cluster annotation levels were lower using the SWISS-PROT database compared to the nrA database, the percent-age of successful GO-term assignments was substantially higher. In addition to the annotations, analyses were undertaken to identify transcript clusters expressed differentially across tissue types or early life-history stages, irrespective of successful annotation. The identification was done to help provide initial evidence for transcript roles in specific tissue functions or developmental transitions. Despite all efforts made here to improve transcript annotation levels for P. monodon, our data reaffirms the need for dedicated functional studies to assign or confirm gene functions of both annotated and unannotated transcript clusters of non-model (crustacean) species.
To our best knowledge, to date only two Penaeid shrimp transcriptome assemblies have been made publicly available10,15, restricting comparative analyses of these transcriptomes. A reciprocal MegaBLAST identified 96.8% of the most recent P. monodon assembly10 within the transcriptome described here, but only 40.0% of our assem-bly was found in the earlier assemassem-bly. These comparisons confirm that our transcriptome assemassem-bly contains many high quality P. monodon transcripts not discovered previously.
[image:6.595.156.393.46.345.2]When compared across species, a reciprocal MegaBLAST showed that the transcriptomes of P. monodon
(present) and L. vannamei15 shared approximately 48% of contigs. Since the assembly metrics of the L. vannamei transcriptome were similar to those of our P. monodon transcriptome, the low number of shared contigs could stem from considerable differences in transcript type or sequence composition between the two shrimp spe-cies. As comprehensive comparisons across crustacean species is currently impractical due to restrictions on publicly-available transcriptome assemblies, the potential value of this warrants effort to consolidate transcrip-tomic data and to establish both centralized and species-specific databases.
Read count data identified independent clusters of transcripts expressed uniquely within different tissues and clusters that formed distinct groups based on their tissue-specific expression patterns. An important considera-tion for this type of analysis is the normalized read count cutoff value for each cluster to be considered “unique”, which was arbitrarily set at above 10 in a specific tissue and <10 in all others. At >100 normalized read counts, Figure 4. Heatmap and hierarchical grouping of the top 2,000 differentially expressed genes in the nine different tissue types. A darker colour indicates a higher expression level. Gene expression patterns (rows) were grouped into nine expression groups based on Pearson’s correlation and the three replicates of each tissue type (columns) into nine tissue groups based on Euclidean distance. EY – eyestalk; FG – female gonad; GI – gill; HL – hemolymph; HP – hepatopancreas; LO – lymphoid organ; MG – male gonad; MU – muscle; ST – stomach.
Groups Predominant tissue type expression site Number of clusters % Annotated (SP/nrA) % in adult but not larval tissues 1 Lymphoid Organ 81 64.2%/76.5% 0.0%
2 Haemolymph 139 63.3%/84.9% 1.4% 3 Female Gonad 208 55.3%/81.7% 6.7%
4 Gill 177 53.1%/66.1% 3.4%
5 Stomach 72 62.5%/68.1% 8.3% 6 Male Gonad 124 29.0%/38.7% 35.5% 7 Hepatopancreas 533 66.6%/85.7% 0.8% 8 Eyestalk 75 66.7%/73.3% 1.3% 9 Muscle 591 75.1%/86.0% 1.5% Total — 2000 64.0%/84.6% 4.3%
[image:7.595.156.478.48.329.2]www.nature.com/scientificreports/
only approximately half of the assigned unique clusters were retained, indicating that the expression levels of many of these potentially tissue-specific clusters was relatively low. Among the annotated transcript clusters most highly expressed in female gonad tissue were FAMeT, PEPCK, GPx and nasrat. Functional roles these proteins may play range from the shrimp moult cycle and reproduction32, the primary step of gluconeogenesis33, prevent-ing oxidative stress33, to specifying terminal regions of the embryo34. Among the annotated genes expressed most highly in eyestalk tissue was hyperglycaemic hormone (CHH), a key neuropeptide hormone that regulates blood sugar, moulting and reproduction35. A subset of transcript clusters highly expressed in lymphoid organ tissue was also highly expressed in gill tissue, most likely due to high concentrations of haemocytes within both tissue types. The majority of genes expressed most highly in hepatopancreas were annotated, potentially reflecting the shared metabolic functions of this organ with those of other animals. Also of much interest were the non-annotated tran-scripts expressed uniquely in specific tissue types. For example, transcript clusters expressed highly in male gonad Figure 5. Heatmap and hierarchical grouping of the top 500 differentially expressed genes in the eight larval and post-larval stages examined. A darker colour indicates a higher expression level. Gene expression patterns in each larval/post-larval stage (row) were grouped into nine expression groups based on Pearson’s correlation.
Groups Stage(s) with predominant expression Number of clusters % Annotated (SP/nrA) % unique to larvae 1 Mid larval to PL (Z, M, PL01, PL04, PL10, PL15) 77 75.3/83.1 9.1
2 Mid Larval (Z, M) 35 42.9/68.6 62.9
3 Mid PL (PL4, PL10) 12 0.0/25.0 33.3
4 Late larval to PL (M, PL1, PL4, PL10, PL15) 152 61.2/69.7 18.4
5 PL15 13 69.2/92.3 76.9
6 Late PL (PL4, PL10, PL15) 38 84.2/84.2 10.5
7 Embryo (E) 12 0.0/16.7 58.3
8 Early larval (E, N) 140 24.3/37.1 85.0 9 Larval (E, N, Z, M, PL15) 21 33.3/61.9 38.1
Total — 500 49.6/61.6 50.4
[image:8.595.156.479.47.338.2] [image:8.595.156.470.402.542.2]Figure 6. Presence of mRNA contigs that encode for RNA polymerase subunits based on KEGG pathway analysis73–75. Green shading highlights the presence of gene orthologs in the P. monodon transcriptome.
[image:9.595.164.516.50.318.2] [image:9.595.154.522.373.689.2]www.nature.com/scientificreports/
were poorly annotated by both databases and included a large proportion of clusters, annotated or not, expressed exclusively in adult tissue types, indicating that male reproductive organs utilize many genes that remain poorly characterized. The grouping of genes with similar expression patterns broadly categorized these transcript clusters into potential functional groups within each tissue type, thereby guiding the selection for more targeted molec-ular function analyses.
Based solely on gene expression patterns, the transcriptome data identified unique groups of transcripts involved in transitions between P. monodon early life-history stages. There was a major disparity between the annotation success of transcript groups upregulated in early or late stage embryogenesis, highlighting how poorly early developmental pathways have been characterized in crustaceans. Also of significance was the presence of orthologs of the Spaetzle gene, known in Drosophila flies to establish the dorso-ventral patterning of the early embryo36 among transcript clusters detected consistently across later larval and post-larval stages. Since each lar-val and post-larlar-val stage sequenced comprised a pool of several hundred individuals, quantitative and/or spatial transcript expression patterns would be required to draw further functional conclusions. Nevertheless, the data reported here will benefit from similar data on other shrimp and crustacean species, particularly for transcript clusters expressed exclusively in embryo with no significant homology to currently known genes.
Long non-coding RNAs (lncRNA) are a type of transcript that have many common features with traditional coding mRNA, including 5′ capping, splicing and 3′ polyadenylation37–39. The nature of lncRNAs is still poorly understood, and it is likely that lncRNAs are in fact a heterogeneous group of transcripts with regulatory func-tions that are not actively translated into proteins40. Thus, their main characteristics are the lack of open reading frames (ORFs) or the presence of non-canonical ORFs in the mature transcript. The biological roles of lncRNAs range from regulation of gene expression, and control of translation, to imprinting. As such, they have been linked to X chromosome inactivation in humans41, genomic imprinting42 and cancer43,44.
Due to the lack of a known lncRNA database in shrimp that can be used for their identification, we used FEELnc which scores each transcript according to its coding potential and then selects a threshold score to classify the transcripts into coding or non-coding45. This software is particularly useful for non-model species because in the absence of an lncRNA training set, it generates a simulated training set using debris from high con-fidence coding transcripts. In fly data, this approach showed an MCC value of 0.754 with an accuracy of 0.86845.
In this study, 79,656 transcripts were classified as lncRNAs, of which 67,960 (85.3%) could not be aligned to any protein database. As expected, the use of a non-model organism and the lack of a set with known lncRNA for training led to the ambiguous classification of 13,535 transcripts with low protein-coding potential but clear alignments to known proteins in curated databases. Classification of these transcripts is the first step towards understanding their roles in the development and regulation of gene expression in Penaeus monodon.
Annotated transcript clusters mapped into 235 KEGG pathways (Supplementary Table S3), which have been broadly classified into functional groupings such as general metabolism (e.g. TCA cycle, xenobiotic metabolism, immunity, reproduction), nutritional metabolism (e.g. proteins, lipids, carbohydrates, vitamins), cellular pro-cesses (e.g. DNA replication, protein trafficking, apoptosis), biological propro-cesses (e.g. circadian rhythm, olfaction and taste, digestion and absorption) and signalling pathways (e.g. PI3K-Akt, MAPK, axis formation, TGF-beta). In general, core pathways such as citrate cycle, oxidative phosphorylation, ribosome biogenesis and RNA/DNA polymerases were better represented than more specific pathways such as the pentose and glucuronate inter-conversion pathway, or the ascorbate and aldarate metabolism pathway. Furthermore, arthropod specific path-ways were generally better represented. For example, the general circadian rhythm pathway was missing several homologs, while the fly specific circadian rhythm pathway was complete. This could be explained by transcripts not sharing sufficient homology with the known genes used for the KEGG analysis and therefore failing to be annotated.
Particularly for those pathways highly-conserved among other eukaryotes, the existence of unique transcripts suggests that Penaeid shrimp and possibly crustaceans in general might use metabolic mechanisms differing from eukaryote species studied to date. Their existence also highlights the need for high-quality genome assemblies for shrimp and other crustacean species, overlaid with isoform, tissue-specific and developmental stage transcript expression data, to either help predict gene functions or direct gene knockdown studies, using RNA interference processes as an example, to empirically ascribe functions to novel genes.
Several RNA transcripts and/or genome sequences likely to be from viruses were discovered in the P. mono-don transcriptome. This was not unexpected considering that it was generated from multiple individuals, tissue types and larval/post-larval stages, as shrimp are co-infected commonly with multiple viruses and as there are several viruses known to be endemic in P. monodon populations indigenous to different regions of Australia46–49. The presence of near full-length ssRNA genome sequences for viruses such as gill-associated virus (GAV, 26,235 nt) and white spot virus 2 (WSV2, 10,542 nt) provided additional validation of the methods used to synthe-size and assemble the transcriptome, and to its completeness as demonstrated by various metrics measuring the nature and number of endogenous gene transcripts. The detection of a ssDNA virus, hepandenovirus, within the transcriptome, presumably detected in a replicative phase, indicates the application of this technique as a tool to also detect the presence of viruses with DNA genomes.
retrotransposons like others now being reported in shrimp53 will require further investigation, as will the nature of the strains, host and distribution ranges, prevalence and potential pathogenicity of the new viruses discovered in the transcriptome.
In conclusion, this study describes the assembly of a comprehensive and high quality transcriptome from nine different tissue types, and eight larval and post-larval early life-history stages of the black tiger shrimp, Penaeus monodon. It also summarizes the number and nature of specific transcript clusters differentially expressed in different tissue types and larval stages, and the Clusters were functionally annotated and mapped to 235 KEGG pathways. Unique transcript clusters and cluster groups were defined across distinct tissues and early life-history stages, providing initial evidence for their roles in specific tissue functions or developmental transitions. The current transcriptome provides a valuable resource for further investigation of directing gene-function studies to increase basic functional biology knowledge in shrimp and for investigating molecular basis of traits of relevance to the aquaculture of shrimp. While the current transcriptome already provides an improved resource for P.
monodon, further effort is required using long-read sequencing data, such as provided by PacBio, to better resolve genes at isoform level. Lastly, this high-quality de novo assembly and data set are publically available and will hopefully support research projects that underpin transformational advances in how we culture shrimp globally.
Material and Methods
Sample taking and RNA extraction.
Tissues of P. monodon broodstock were collected from multiple intermolt individuals, immediately snap frozen on dry ice, and stored at −80 °C until extraction (Table 1). All tissues except lymphoid organs were collected from wild broodstock caught off coastal waters near the border between the Northern Territory and Western Australia provided, which were provided by a commercial hatchery at Flying Fish Point, North Queensland, Australia. The prawns were kept at a salinity of 27–35 ppt, pH 7.8–8.0, 28.5–29.5 °C and 5 to 7 ppm dissolved oxygen. Lymphoid organ tissue was collected from wild prawns caught off the East Coast of Queensland. Larval and post-larval stages were collected from the same hatchery in pools of approximately 400 individuals per life stage, after four hours of starvation, and preserved in RNAlater (Thermo Fisher Scientific). All tissues and early life-history stages were sub-sampled in an RNase-free laboratory and total RNA was extracted using an RNeasy Universal extraction kit (QIAGEN) following manufacturer’s instructions. RNA quantity and quality was estimated using a Nanodrop UV spectrophotometer (Thermo Fisher Scientific), and purity was further assessed using an Agilent Bioanalyzer (Agilent Technologies). RNA was selected from individual sample replicates based on Nanodrop spectra, RNA concentration, and Agilent Bioanalyzer traces, in preference to using comparative tissues from the same individuals.Illumina library preparation and sequencing.
Library preparation and sequencing was carried out at the Australian Genome Research Facility (AGRF). Upon arrival at the sequencing facility, the quality of the sam-ples was checked using a Bioanalyzer RNA 6000 nano reagent kit (Agilent) and libraries were prepared using the TruSeq Stranded mRNA Library Preparation Kit (Illumina) according to established protocols. Final libraries were again checked using Tapestation DNA 1000 TapeScreen Assay (Agilent). Cluster generation was performed on a cBot with HiSeq PE Cluster Kit v4 - cBot and sequencing was done on a HiSeq 2500 using a HiSeq SBS Kit. The Hiseq 2500 was operating with HiSeq Control Software v2.2.68 and base-calling was performed with RTA v1.18.66.3. Samples in the second sequencing run were pooled and split across two lanes to reduce sequencing bias (Table 1).Sequence quality control, assembly and annotation.
Raw sequence data was quality checked using FastQC54 v0.11.5, and assembled loosely following the Oyster River Protocol for Transcriptome Assembly55. In brief, all sequences were collectively error-corrected using RCorrector56 V3. Samples were then assembled in Trinity57 V2.3.2; grouped by individual shrimps, i.e. all tissues from a specific shrimp were assembled together. Reads were trimmed harshly for adapters and softly for Phred score <2 using Trimmomatic58 V0.32; and then normalized in silico within Trinity. The normalized forward and reverse reads produced by Trinity were then used in BinPacker59 V1.0, IDBA-Tran60 V 1.1.1 using K20, K30, K40, K50 and K60; and Bridger61 version 2014-12-01. All resulting transcriptomes were concatenated and merged using Evidential Gene62, followed by clus-tering using Transfuse V0.5.0 (https://github.com/cboursnell/transfuse) using a similarity value of 0.98. Lastly, contigs <300 bp were removed to produce the final transcriptome. The quality of the final assembly was assessed using TransRate63 V1.0.1, and BUSCO64 V2 using the arthropoda_odb9 database65. Sequences were annotated in Blast2Go66 using the SWISS-PROT database67 (accessed 17/03/2017), and separately using the arthropod and viral subsections of the GenBank nr database (accessed 06/06/2017).Identification of long non-coding RNAs.
FEELnc45 was used for the identification of long non-coding RNAs. The coding transcripts training set was constructed from the 1,047 complete universal single copy orthol-ogous genes found with BUSCO v2.0 (database arthropoda_odb965). The mode “shuffle” was used to generate a training set of lncRNA from the debris of the known coding RNA transcripts.Mapping and differential gene expression analysis.
Before mapping, error-corrected raw sequence reads were trimmed using the same parameters as before, but without palindrome trimming used by Trinity. Sequence reads were mapped using Bowtie268 V2.2.8, and read counts were calculated using Corset69 V1.0.6. Differential gene expression was analyzed using DESeq270 V1.16.1 in RStudio71 V1.0.143 running R72 V3.4.1.www.nature.com/scientificreports/
with the single-directional best hit (SBH) method. All scripts can be found on GitHub at https://github. com/R-Huerlimann/Pmono_multitissue_transcriptome.
Statistical analyses.
For data analysis, the top 2,000 variably expressed genes across the nine tissue types and the top 500 variably expressed genes across the four larval and four post-larval stages were visualized in a prin-cipal component analysis and heatmap using variance-stabilizing transformed read-count data from DESeq. 2. The gene level dendrograms in the heatmap were created using Pearson’s correlation for both the tissue type lar-val/post-larval stages. Euclidean distance was used to cluster tissue types. All statistical analyses were performed in RStudio. More detailed information on the analyses can be found on GitHub.Ethical approval.
This study has been carried out abiding by all necessary Queensland Government legisla-tion and James Cook University policies.Availability of Data and Material
Raw short read data and transcriptome assembly are available on NCBI under the following accession num-bers: BioProject: PRJNA421400, BioSamples: SAMN08741487-SAMN08741521, SRA: SRP127068 (RR6868116-SRR6868172), TRA: GGLH00000000. Bioinformatics scripts are available on GitHub at https://github. com/R-Huerlimann/Pmono_multitissue_transcriptome.
References
1. FAO. Fisheries and Aquaculture topics. The State of World Fisheries and Aquaculture (SOFIA) (Food and Agriculture Organization United Nations, 2016).
2. Gjedrem, T., Robinson, N. & Rye, M. The importance of selective breeding in aquaculture to meet future demands for animal protein: a review. Aquaculture 350, 117–129 (2012).
3. Jones, D. B. et al. A comparative integrated gene-based linkage and locus ordering by linkage disequilibrium map for the Pacific white shrimp, Litopenaeus vannamei. Scientific Reports 7 (2017).
4. Wang, Z., Gerstein, M. & Snyder, M. RNA-Seq: a revolutionary tool for transcriptomics. Nature reviews genetics 10, 57–63 (2009). 5. Saha, S. et al. Using the transcriptome to annotate the genome. Nature biotechnology 20, 508–512 (2002).
6. Yu, Y. et al. SNP discovery in the transcriptome of white Pacific shrimp Litopenaeus vannamei by next generation sequencing. PLoS One 9, e87218 (2014).
7. Song, L., Shankar, D. S. & Florea, L. Rascaf: Improving Genome Assembly with RNA Sequencing Data. The Plant Genome, https:// doi.org/10.3835/plantgenome2016.03.0027 (2016).
8. Nguyen, C. et al. De novo assembly and transcriptome characterization of major growth-related genes in various tissues of Penaeus monodon. Aquaculture 464, 545–553 (2016).
9. Rotllant, G. et al. Identification of genes involved in reproduction and lipid pathway metabolism in wild and domesticated shrimps.
Marine genomics 22, 55–61 (2015).
10. Uengwetwanit, T. et al. Transcriptome-based discovery of pathways and genes related to reproduction of the black tiger shrimp (Penaeus monodon). Marine Genomics (2017).
11. Soonthornchai, W. et al. Differentially expressed transcripts in stomach of Penaeus monodon in response to AHPND infection.
Developmental & Comparative Immunology 65, 53–63 (2016).
12. Chen, K. et al. Transcriptome and molecular pathway analysis of the hepatopancreas in the Pacific White Shrimp Litopenaeus vannamei under chronic low-salinity stress. PLoS One 10, e0131503 (2015).
13. Li, C. et al. Analysis of Litopenaeus vannamei transcriptome using the next-generation DNA sequencing technique. PloS one 7, e47442 (2012).
14. Chen, X. et al. Transcriptome analysis of Litopenaeus vannamei in response to white spot syndrome virus infection. PLoS One 8, e73218 (2013).
15. Ghaffari, N. et al. Novel transcriptome assembly and improved annotation of the whiteleg shrimp (Litopenaeus vannamei), a dominant crustacean in global seafood mariculture. Scientific reports 4, 7081 (2014).
16. Guo, H. et al. Trascriptome analysis of the Pacific white shrimp Litopenaeus vannamei exposed to nitrite by RNA-seq. Fish & shellfish immunology 35, 2008–2016 (2013).
17. Hu, D., Pan, L., Zhao, Q. & Ren, Q. Transcriptomic response to low salinity stress in gills of the Pacific white shrimp, Litopenaeus vannamei. Marine genomics 24, 297–304 (2015).
18. Lu, X. et al. Transcriptome analysis of the hepatopancreas in the Pacific white shrimp (Litopenaeus vannamei) under acute ammonia stress. PloS one 11, e0164396 (2016).
19. Sookruksawong, S., Sun, F., Liu, Z. & Tassanakajon, A. RNA-Seq analysis reveals genes associated with resistance to Taura syndrome virus (TSV) in the Pacific white shrimp Litopenaeus vannamei. Developmental & Comparative Immunology 41, 523–533 (2013). 20. Wei, J., Zhang, X., Yu, Y., Li, F. & Xiang, J. RNA-Seq reveals the dynamic and diverse features of digestive enzymes during early
development of Pacific white shrimp Litopenaeus vannamei. Comparative Biochemistry and Physiology Part D: Genomics and Proteomics 11, 37–44 (2014).
21. Xue, S. et al. Sequencing and de novo analysis of the hemocytes transcriptome in Litopenaeus vannamei response to white spot syndrome virus infection. PLoS One 8, e76718 (2013).
22. Zeng, D. et al. Transcriptome analysis of Pacific white shrimp (Litopenaeus vannamei) hepatopancreas in response to Taura syndrome Virus (TSV) experimental infection. PloS one 8, e57515 (2013).
23. Zhang, D., Wang, F., Dong, S. & Lu, Y. De novo assembly and transcriptome analysis of osmoregulation in Litopenaeus vannamei under three cultivated conditions with different salinities. Gene 578, 185–193 (2016).
24. Powell, D., Knibb, W., Remilton, C. & Elizur, A. De-novo transcriptome analysis of the banana shrimp (Fenneropenaeus merguiensis) and identification of genes associated with reproduction and development. Marine genomics 22, 71–78 (2015). 25. Sellars, M. J., Trewin, C., McWilliam, S. M., Glaves, R. & Hertzler, P. L. Transcriptome profiles of Penaeus (Marsupenaeus) japonicus
animal and vegetal half-embryos: identification of sex determination, germ line, mesoderm, and other developmental genes. Marine Biotechnology 17, 252–265 (2015).
26. Powell, D., Knibb, W. & Elizur, A. In Proceedings of the 24th Plant and Animal Genome Conference. (Plant and Animal Genome (PAG) Conference).
27. Powell, D., Knibb, W., Nguyen, N. H. & Elizur, A. Transcriptional profiling of banana shrimp Fenneropenaeus merguiensis with differing levels of viral load. Integrative and comparative biology 56, 1131–1143 (2016).
29. Li, S., Zhang, X., Sun, Z., Li, F. & Xiang, J. Transcriptome analysis on Chinese shrimp Fenneropenaeus chinensis during WSSV acute infection. PloS one 8, e58627 (2013).
30. Shi, X. et al. Transcriptome analysis of ‘Huanghai No. 2′ Fenneropenaeus chinensis response to WSSV using RNA-seq. Fish & Shellfish Immunology 75, 132–138, https://doi.org/10.1016/j.fsi.2018.01.045 (2018).
31. Baranski, M. et al. The development of a high density linkage map for black tiger shrimp (Penaeus monodon) based on cSNPs. PLoS One 9, e85413 (2014).
32. Homola, E. & Chang, E. S. Methyl farnesoate: crustacean juvenile hormone in search of functions. Comparative Biochemistry and Physiology Part B: Biochemistry and Molecular Biology 117, 347–356 (1997).
33. Michal, G. & Schomburg, D. Biochemical pathways: an atlas of biochemistry and molecular biology. (Wiley New York, 1999). 34. Jiménez, G., González-Reyes, A. & Casanova, J. Cell surface proteins Nasrat and Polehole stabilize the Torso-like extracellular
determinant in Drosophila oogenesis. Genes & development 16, 913–918 (2002).
35. Webster, S. G., Keller, R. & Dircksen, H. The CHH-superfamily of multifunctional peptide hormones controlling crustacean metabolism, osmoregulation, moulting, and reproduction. General and comparative endocrinology 175, 217–233 (2012). 36. Morisalo, D. & Anderson, K. V. Signaling pathways that establish the dorsal-ventral pattern of the Drosophila embryo. Annual
review of genetics 29, 371–399 (1995).
37. Chew, G.-L. et al. Ribosome profiling reveals resemblance between long non-coding RNAs and 5′ leaders of coding RNAs.
Development 140, 2828–2834 (2013).
38. Derrien, T. et al. The GENCODE v7 catalog of human long noncoding RNAs: analysis of their gene structure, evolution, and expression. Genome research 22, 1775–1789 (2012).
39. Guttman, M., Russell, P., Ingolia, N. T., Weissman, J. S. & Lander, E. S. Ribosome profiling provides evidence that large noncoding RNAs do not encode proteins. Cell 154, 240–251 (2013).
40. Engreitz, J. M., Ollikainen, N. & Guttman, M. Long non-coding RNAs: spatial amplifiers that control nuclear structure and gene expression. Nature Reviews Molecular Cell Biology 17, 756 (2016).
41. Brockdorff, N. et al. The product of the mouse Xist gene is a 15 kb inactive X-specific transcript containing no conserved ORF and located in the nucleus. Cell 71, 515–526 (1992).
42. Koerner, M. V., Pauler, F. M., Huang, R. & Barlow, D. P. The function of non-coding RNAs in genomic imprinting. Development 136, 1771–1783 (2009).
43. Leucci, E. et al. Melanoma addiction to the long non-coding RNA SAMMSON. Nature 531, 518 (2016).
44. Prensner, J. R. & Chinnaiyan, A. M. The emergence of lncRNAs in cancer biology. Cancer discovery 1, 391–407 (2011).
45. Wucher, V. et al. FEELnc: a tool for long non-coding RNA annotation and its application to the dog transcriptome. Nucleic acids research 45, e57–e57 (2017).
46. Cowley, J. A., Dimmock, C. M., Spann, K. M. & Walker, P. J. Gill-associated virus of Penaeus monodon prawns: an invertebrate virus with ORF1a and ORF1b genes related to arteri-and coronaviruses. Journal of General Virology 81, 1473–1484 (2000).
47. Cowley, J. A. et al. Tactical Research Fund: Aquatic Animal Health Subprogram: Viral presence, prevalence and disease management in wild populations of the Australian Black Tiger prawn (Penaeus monodon). (FRDC, 2015).
48. Mohr, P. G. et al. New yellow head virus genotype (YHV7) in giant tiger shrimp Penaeus monodon indigenous to northern Australia.
Diseases of aquatic organisms 115, 263–268 (2015).
49. Owens, L., La Fauce, K. & Claydon, K. The effect of Penaeus merguiensis densovirus on Penaeus merguiensis production in Queensland, Australia. Journal of fish diseases 34, 509–515 (2011).
50. Li, C.-X. et al. Unprecedented genomic diversity of RNA viruses in arthropods reveals the ancestry of negative-sense RNA viruses.
Elife 4 (2015).
51. Shi, M. et al. Redefining the invertebrate RNA virosphere. Nature 540, 539 (2016).
52. Shen, C.-H. & Steiner, L. A. Genome structure and thymic expression of an endogenous retrovirus in zebrafish. Journal of virology
78, 899–911 (2004).
53. Sakaew, W., Pratoomthai, B., Pongtippatee, P., Flegel, T. W. & Withyachumnarnkul, B. Discovery and partial characterization of a non-LTR retrotransposon that may be associated with abdominal segment deformity disease (ASDD) in the whiteleg shrimp Penaeus (Litopenaeus) vannamei. BMC veterinary research 9, 189 (2013).
54. Andrews, S. FastQC: a quality control tool for high throughput sequence data, http://www.bioinformatics.babraham.ac.uk/projects/ fastqc (2010).
55. MacManes, M. D. Establishing evidenced-based best practice for the de novo assembly and evaluation of transcriptomes from non-model organisms. bioRxiv, 035642 (2016).
56. Song, L. & Florea, L. Rcorrector: efficient and accurate error correction for Illumina RNA-seq reads. GigaScience 4, 1 (2015). 57. Grabherr, M. G. et al. Full-length transcriptome assembly from RNA-Seq data without a reference genome. Nature biotechnology 29,
644–652 (2011).
58. Bolger, A. M., Lohse, M. & Usadel, B. Trimmomatic: a flexible trimmer for Illumina sequence data. Bioinformatics, btu170 (2014). 59. Liu, J. et al. BinPacker: Packing-Based De Novo Transcriptome Assembly from RNA-seq Data. PLoS Comput Biol 12, e1004772
(2016).
60. Peng, Y. et al. IDBA-tran: a more robust de novo de Bruijn graph assembler for transcriptomes with uneven expression levels.
Bioinformatics 29, i326–i334 (2013).
61. Chang, Z. et al. Bridger: a new framework for de novo transcriptome assembly using RNA-seq data. Genome biology 16, 1 (2015). 62. Gilbert, D. EvidentialGene: tr2aacds, mRNA Transcript Assembly Software, http://arthropods.eugenes.org/EvidentialGene/about/
EvidentialGene_trassembly_pipe.html (2013).
63. Smith-Unna, R., Boursnell, C., Patro, R., Hibberd, J. & Kelly, S. TransRate: reference free quality assessment of de novo transcriptome assemblies. Genome research, gr. 196469, 196115 (2016).
64. Simão, F. A., Waterhouse, R. M., Ioannidis, P., Kriventseva, E. V. & Zdobnov, E. M. BUSCO: assessing genome assembly and annotation completeness with single-copy orthologs. Bioinformatics, btv351 (2015).
65. Zdobnov, E. M. et al. OrthoDBv9. 1: cataloging evolutionary and functional annotations for animal, fungal, plant, archaeal, bacterial and viral orthologs. Nucleic acids research 45, D744–D749 (2016).
66. Conesa, A. et al. Blast2GO: a universal tool for annotation, visualization and analysis in functional genomics research. Bioinformatics
21, 3674–3676 (2005).
67. Boeckmann, B. et al. The SWISS-PROT protein knowledgebase and its supplement TrEMBL in 2003. Nucleic acids research 31, 365–370 (2003).
68. Langmead, B. & Salzberg, S. L. Fast gapped-read alignment with Bowtie 2. Nature methods 9, 357 (2012).
69. Davidson, N. M. & Oshlack, A. Corset: enabling differential gene expression analysis for de novo assembled transcriptomes. Genome biology 15, 1 (2014).
70. Love, M. I., Huber, W. & Anders, S. Moderated estimation of fold change and dispersion for RNA-seq data with DESeq. 2. Genome biology 15, 550 (2014).
71. Racine, J. S. RStudio: A Platform‐Independent IDE for R and Sweave. Journal of Applied Econometrics 27, 167–172 (2012). 72. R Development Core Team (2008). R: A language and environment for statistical computing. R Foundation for Statistical
www.nature.com/scientificreports/
73. Kanehisa, M., Tanabe, M., Sato, Y. & Morishima, K. KEGG: new perspectives on genomes, pathways, diseases and drugs. Nucleic Acids Res. 45, D353–D361 (2017).
74. Kanehisa, M., Sato, Y., Kawashima, M., Furumichi, M. & Tanabe, M. KEGG as a reference resource for gene and protein annotation.
Nucleic Acids Res. 44, D457–D462 (2016).
75. Kanehisa, M. & Goto, S. KEGG: Kyoto Encyclopedia of Genes and Genomes. Nucleic Acids Res. 28, 27–30 (2000).
Acknowledgements
We thank Andrew Foote, Gopala Krishna, Sarah Berry and Tansyn Noble for assistance in organizing and collecting tissue samples. Research Funding for this project was from the Australian Research Council Industrial Transformation Research Program IH130200013. This work was funded by the Australian Research Council (ARC) Industrial Transformation Research Hub scheme, awarded to James Cook University and in collaboration with the Commonwealth Scientific Industrial Research Organisation (CSIRO), the Australian Genome Research Facility (AGRF), the University of Sydney and Seafarms Group Pty Ltd.
Author Contributions
R.H. conceptualised, developed and oversaw the project, performed sampling and carried out RNA extractions, developed and performed the transcriptome assembly, quality assessment and differential gene analysis, and wrote the manuscript. N.M.W. conceptualised and developed the project, performed sampling, led components of data analysis and interpretation and wrote the manuscript. L.G. developed the transcriptome assembly bioinformatics pipeline. J.D.M. carried out the lncRNA analysis and assisted with the transcriptome assembly bioinformatics pipeline. J.G. carried out sampling and RNA extractions, and assisted with development of the transcriptome assembly bioinformatics pipeline, and reviewed the manuscript. S.M. assisted with the bioinformatic analysis of the differential gene expression data and reviewed manuscript. M.T. oversaw the library preparation and sequencing, and reviewed the manuscript. K.S. conceptualised and developed the project and reviewed manuscript. E.G. reared and sampled the larval stages. D.D. conceptualised and developed the project. Coordinated facilities and resources for larval and adult prawn production and reviewed manuscript. M.S. provided prawn tissue samples, conceptualised and developed the project, assisted with data interpretation and reviewed manuscript. J.C. assisted with the interpretation and writing of the viral analysis, and edited manuscript. K.C. assisted with the interpretation and writing of the viral analysis, and reviewed manuscript. G.C. conceptualised and developed the project and reviewed manuscript. M.K. conceptualised and developed the project and reviewed manuscript. H.R. conceptualised and developed the project and reviewed manuscript. G.M. conceptualised and developed the project, performed sampling, provided advice on sequencing strategies and data interpretation and reviewed manuscript. K.R.Z. conceptualised and developed the project and reviewed manuscript. D.R.J. conceptualised and developed the project, oversaw coordination of project activities and reviewed manuscript
Additional Information
Supplementary information accompanies this paper at https://doi.org/10.1038/s41598-018-31148-4. Competing Interests: The authors declare no competing interests.
Publisher's note: Springer Nature remains neutral with regard to jurisdictional claims in published maps and institutional affiliations.
Open Access This article is licensed under a Creative Commons Attribution 4.0 International License, which permits use, sharing, adaptation, distribution and reproduction in any medium or format, as long as you give appropriate credit to the original author(s) and the source, provide a link to the Cre-ative Commons license, and indicate if changes were made. The images or other third party material in this article are included in the article’s Creative Commons license, unless indicated otherwise in a credit line to the material. If material is not included in the article’s Creative Commons license and your intended use is not per-mitted by statutory regulation or exceeds the perper-mitted use, you will need to obtain permission directly from the copyright holder. To view a copy of this license, visit http://creativecommons.org/licenses/by/4.0/.