FACULTY OF ELECTRICAL ENGINEERING
FINAL YEAR PROJECT 2 BEKU 4894
IMPACT OF FLUCTUATING INPUT OF PV TO HARMONIC DISTORTION
Akmal Fuad Bin Yusuf B011110338
Bachelor of Electrical Engineering (Industrial Power)
“I hereby declare that I have read through this report entitle “Impact of fluctuating input of PV to harmonic distortion” and found that it has comply the partial fulfillment for awarding the degree of Bachelor of Electrical Engineering (Industrial Power)”
Signature :
Supervisor’s Name : DR. Aida Fazliana Binti Abdul Khadir
IMPACT OF FLACTUATING INPUT OF PV TO HARMONIC DISTORTION
AKMAL FUAD BIN YUSUF
A report submitted in partial fulfillment of the requirement for the degree of Bachelor of Electrical Engineering (Industrial Power)
Faculty of Electrical Engineering UNIVERSITY TECHNICAL MALAYSIA MELAKA
“I declare that this report entitle “Impact of fluctuating input of PV to harmonic distortion” is the result of my own research except as cited in the references. The report has not been accepted for any
degree and is not concurrently submitted in candidature of any other degree.
Signature :
Name : Akmal Fuad Bin Yusuf
ACKNOWLEDGEMENT
Alhamdulillah. I am greatly indebted to Allah on His mercy and blessing for making this research successful.
Secondly, I wish to express my sincere appreciation to my supervisor, Pn. Aida Fazliana Binti Abdul Kadir for her encouragement, guidance and valuable advices, without her continued support and interest, this thesis would not have been the same as presented here.
Next, I would like to express my thankful to Universiti Teknikal Malaysia Melaka (UTeM) for its equipment material support and to my colleagues especially in Fakulti Kejuruteraan Elektrik (FKE) for their valuable encouragement during the time of this research.
My sincere appreciation also extends to all my lectures and entire staffs in Solar LAB for their assistance at various occasions. Their views, comments and tips are very helpful in completing this research.
ABSTRACT
ABSTRAK
TABLE OF CONTENTS
CHAPTER TITLE PAGE
ACKNOWLEDGEMENTS i
ABSTRACT ii
ABSTRAK iii
TABLE OF CONTENTS iv
LIST OF TABLES vii
LIST OF FIGURES viii
LIST OF APPENDICES xi
1. INTRODUCTION
1.1 Research Background 1
1.2 Problem Statement 2
1.3 Objectives 2
1.4 Scopes 2
1.5 Report Structure 3
2. LITERATURE REVIEW
2.1 Basic Principles 4
2.2 Type of PV Solar Cell 5
2.2.1 Mono-Crystalline 5
2.2.2 Heterojunction with intrinsic thin layer (HIT) 6 2.2.3 The PV solar systems that used at FKE, UTeM 8
CHAPTER TITLE PAGE
2.4 The model of the inverters 9
2.5 Reviews of previous related works 9
2.5.1 Power quality of grid connected solar
PV system 10
2.5.2 The impact of PV system on steady
state voltage variation 11
2.5.3 The performance of inverter 11
2.5.4 Multi PV simulation LV network simulation 12
2.6 Chapter Summary 13
3. RESEARCH METHODOLOGY
3.1 Introduction 14
3.2 Flow of the research 16
3.2.1 Calculation for Mono-Crystalline 18
3.2.2 Calculation for Hiterojuntion 19
3.2.3 Collect the data from the Sunny Webbox 19
4. RESULTS AND DISCUSSION
4.1 Introduction 20
4.2 Mono-Crystalline System Result 20
4.2.1 Cloudy Day 21
4.2.2 Rainy Day 27
4.3HIT System Result 33
4.2.1 Cloudy Day 33
4.2.2 Rainy Day 40
5. CONCLUSIONS AND RECOMMENDATION 47
5.1 Conclusion 47
CHAPTER TITLE PAGE
REFERENCES 49
LIST OF TABLES
TABLE NO. TITLE PAGE
2.1 The Mono-Crystalline PV performance
under standard test conditions (STC)* 6
2.2 The HIT PV performance under standard test
conditions (STC)* 7
2.3 The PV solar systems that used at FKE UTeM 8 24 The harmonic orders and magnitudes at inverter current 10 2.3 The harmonic orders and magnitudes of filtered current 10
LIST OF FIGURES
FIGURE NO. TITLE PAGE
2.1 The flow of the PV cell basic operation 4
2.2 The panel of Mono-Crystalline PV 5
2.3 The panel of HIT PV 7
2.4 The SMA SUNNY BOT 2000HFinverter 9
2.5 The variation of PV systems power output during
a month. 11
2.6 The relationship between the per-unit inverter efficiency and
per-unit AC output power. 11
3.1 Three Phase Power Quality Analyzer 435 Fluke Meter 14
3.2 The block diagram of the grid connected system 15
3.3 The Sunny Webbox Data Lodger 15
3.4 The summary of research work 17
4.1 Solar irradiation data on 3 April 2014 21 4.2 Power output by Mono-Crystalline PV on 3 April 2014 21
4.3 Power output of each inverter 22
4.4 The maximum and minimum power output of each inverter 22
4.5 The voltage of each inverter 23
4.6 The current of each inverter 23
FIGURE NO. TITLE PAGE
4.8 Current harmonic profile 24
4.9 THDv spectrum at minimum irradiation 25
4.10 THDv spectrum at maximum irradiation 25
4.11 THDi spectrum at minimum irradiation 26
4.12 THDi spectrum at maximum irradiation 26
4.13 Solar irradiation data on 11 April 2014 27 4.14 Power output by Mono-Crystalline on 11 April 2014 27
4.15 Power output of each inverter 28
4.16 The maximum and minimum power output of each inverter 28
4.17 The voltage of each inverter 29
4.18 The current of each inverter 29
4.19 Voltage harmonic profile 30
4.20 Current harmonic profile 30
4.21 THDv spectrum at minimum irradiation 31
4.22 THDv spectrum at maximum irradiation 31
4.23 THDi spectrum at minimum irradiation 32
4.24 THDi spectrum at maximum irradiation 32
4.25 Solar irradiation data on 14 April 2014 33 4.26 Power output of HIT PV on 14 April 2014 34
4.27 Power output of each inverter 34
FIGURE NO. TITLE PAGE
4.29 The voltage of each inverter 35
4.30 The current of each inverter 36
4.31 Voltage harmonic profile 36
4.32 Current harmonic profile 37
4.33 THDv spectrum at minimum irradiation 38
4.34 THDv spectrum at maximum irradiation 38
4.35 THDi spectrum at minimum irradiation 39
4.36 THDi spectrum at maximum irradiation 39
4.37 Solar irradiation data on 15 April 2014 40 4.38 Power output of HIT PV on 15 April 2014 41
4.39 Power output of each inverter 41
4.40 The maximum and minimum power output of each inverter 42
4.41 The voltage of each inverter 42
4.42 The current of each inverter 43
4.43 Voltage harmonic profile 43
4.44 Current harmonic profile 44
4.45 THDv spectrum at minimum irradiation 44
4.46 THDv spectrum at maximum irradiation 45
4.47 THDi spectrum at minimum irradiation 45
LIST OF APPENDICES
APPENDIX TITLE PAGE
A Mono-Crystalline solar technical data sheet 52 B Hetereojunction solar technical data sheet 55
C Inverter technical data sheet 58
D Sunny Webbox technical data sheet 61
E The fluke meter Mono-crystalline data recorded 64
F The fluke meter HIT data recorded 65
G IEEE Standards 512-1992 66
Chapter 1
Introduction
1.1 Research Background
Technological advancement nowadays has resulted in high demand for electricity. Hence the demand of the production of electricity has led to global warming and polluted environment [1]. Therefore, many of the clean and renewable energy sources were created and introduced to concern the environmental issues and together sustained the electricity demand [2]. This photovoltaic (PV) systems is one of the most renewable energy system that been focus due to clean the environments and also meet future demands [3].
This PV technologies are comes from the source of sunlight, this PV system may convert the light energy to the form of electricity energy. During the conversion process there was no pollution produced, no moving part used and very little maintenance needed [4]. In Malaysia the government takes an initiatives to support the goods of the PV system approved and started the enactment of renewable energy law 2011. The users that installing the fit-in-tariff (FiT) PV system will be awarded at the certain rates Ringgit Malaysia (RM) per kWh for duration of 21 years [5]-[8].
There are many researcher studied the PV analysis. Some of the investigations were focusing on modeling and the simulation of the PV system [9], the harmonic distortion with harmonic resonance effect [10], and PV systems with problem of voltage rise causes by the high penetrations of solar PV [11].
Heterojunction with intrinsic thin layer (HIT) grid connected PV has been investigated on the harmonic distortion.
1.2 Problem Statement
The application of the inverters in the PV solar systems will contribute harmonic distortion to the system because of the electronic component used in the inverter itself. This harmonic distortion will affect both of the voltage grid and also the current waveform. The generated output of PV solar will depend on the weather and the efficiency of the PV solar itself. Different type of PV may contribute different propagation of harmonic. The significant findings will contribute useful information to power quality research area. There are two types of the PV solar systems have been considered in this report. The two types of the PV solar systems; namely Mono-Crystalline cell system and HIT cell system. Each of the system will generate different values of voltage, current and power.
1.3 Objectives
The objectives of this research:
1. To measure the voltage harmonic and current harmonic distortion with two weather condition and the different various types of PV systems.
2. To analyze the harmonic impact of the two different type of the PV solar systems.
1.4 Scope
The research work will be focused on the following scopes which are:
1. The study will focus only in Faculty of Electrical Engineering (FKE), Universiti Teknikal Malaysia Melaka (UTeM) area.
1.5 Report Structure
Here were the overall preview of the research report that start from the beginning until the end. Here the explanation about each of the topic discussed
Introduction
The first chapter is all about the introduction of this research. Explain about base and the background of what was the idea of this research. This chapter also explains about the objectives and also about the scope of this research as well. This research was focus on the study and analyze of voltage, current and harmonic behavior with the two weather condition for various types of PV systems.
Literature Review
On chapter two, the explanation is all about the basic principles that used for this research. Papers, journals or books found with related topic to become as a source for researcher. From that the current knowledge including substantive findings, as well as theoretical and methodological can be review.
Methodology
Next, this chapter will explains more about the methodology of this research. Explains the sequence from the beginning till to the end of the research and also the method to collect data and complete the research. Further explanation will be in chapter three.
Results
The measurements data of this research will be discuss in this part. All the graphical figures and value will be explained further in this topic. Some discussion also will be involves together to strengthen the information.
Conclusion
Chapter 2
Literature Review
2.1 Basic Principles
This PV technology actually converts energy from sunlight to electricity energy by using no moving parts, consuming no conventional fossil fuels, creating no pollution, and lasting for decades with very little maintenance [4]. In the real life the solar cells that you see that attached on the calculators and satellites are also called PV cells. PV cells are made of special materials called semiconductors such as silicon, which is currently used commonly.
Figure 2.1shows that, photovoltaic cells are made up of at least 2 semi-conductor layers. The first layers containing the positive charge while the second layer is negative charge. At the negative layer side contained electrons that are free to move. As the cell is exposed to the sunlight, the sunlight consists of the little particles of solar energy that known as photons. Photons from the sunlight are absorbed by the negative layer. Then, when the photons fills the layer are absorbed by the negative layer of the cell, the freed electrons will migrate to move to the positive layer and creating the voltage differential, similar to a household battery. If the layer connected to an external load, the electron flows through the circuit and create electricity [12]-[14].
[image:19.595.120.520.611.705.2]
Figure 2.1: The flow of the PV cell basic operation [14].
These cells are enough to generate power if the small amount of direct sunlight is attached. Groups of cells are mounted together in panels or modules. The power of a PV cell is measured in kilowatts peak (kWp). That's the rate at which it generates energy at peak performance in full direct sunlight during the summer. PV cells come in a variety of shapes and sizes design criteria [15] [16].
2.2 Type of PV Solar Cell
In this research, there are two types of semiconductor that is used for solar cells with the differences lie in the atomic structure. The semiconductor is consists of Mono-Crystalline PV System and HIT PV System.
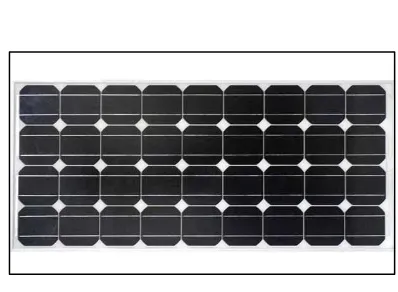
2.2.1 Mono-Crystalline
[image:20.595.222.421.561.707.2]Mono-Crystalline silicon has an orderly atomic structure. This makes the material predictable, with an efficiency rate of less than 15 to more than 21 percent. It's also easier to work with. The downside of Mono-Crystalline silicon is that it is expensive to make. To create predetermined and orderly cell structure, the manufacturing process is slow and precise. The development of Mono-Crystalline silicon begins with the production of crystals of silicon, made from molten silicon. This silicon is very pure. The thickness of the molten silicon was 0.2 to 0.3 mm. The edge of the round wafers is cut off, creating hexagonal shape, allowing more wafers to be placed on a module [17] [18]. Figure 2.2 shows the shape and figure of Mono-Crystalline panel.
For this research, the model of this panel module is SW255 Mono-crystalline Solar World from Germany was used. This Mono-crystalline PV model consists of 24 units of panels. The system consists of 3 arrays and each of the arrays had 8 units of panel and all the 3 arrays are connected to each of the 3 inverters. Inside each of this panel contain 60 cells per module that was bond together. The Table 2.1 shows the performance under standard test condition for each of this Mono-crystalline panel module that was stated in the data sheet. The overall total size of this system was 6.12kW. The SW255 Mono-crystalline further data sheet detail is attached at Appendix A.
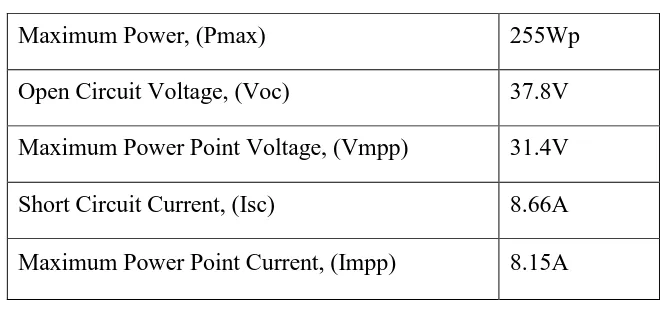
Table 2.1: The Mono-crystalline PV performance under standard test conditions (STC)*
Maximum Power, (Pmax) 255Wp
Open Circuit Voltage, (Voc) 37.8V
Maximum Power Point Voltage, (Vmpp) 31.4V Short Circuit Current, (Isc) 8.66A Maximum Power Point Current, (Impp) 8.15A
*STC: 1000 W/m2, 250C, AM1.5
2.2.2 Heterojunction with Intrinsic Thin Layer (HIT)
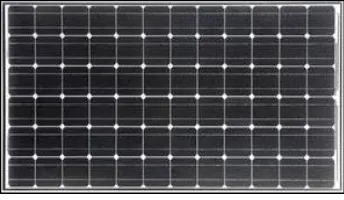
Figure 2.3 shows the shape and figure of HIT panel. The model of this panel module is HIT VBHN235SJ18 Panasonic brand Japan. This HIT PV model is consists of 24 units of panels. The system consists of 3 arrays and each of the arrays had 8 units of panel and all the 3 arrays are connected to each of the 3 inverters. The table 2.2 shows the performance under standard test condition for each of this HIT panel module that was stated in the data sheet. The overall total size of this system was 5.64 kW. The HIT VBHN235SJ18 further technical data detail is attached at Appendix B.
Table 2.2: The HIT PV performance under standard test conditions (STC)*
Maximum Power, (Pmax) 235Wp
Open Circuit Voltage, (Voc) 51.8V
Maximum Power Voltage, (Vmp) 43.0V
Short Circuit Current, (Isc) 5.84A
Maximum Power Current, (Imp) 5.48A
*STC: 1000 W/m2, 250C, AM1.5 Figure 2.3: The panel of HIT PV
[image:22.595.134.477.498.641.2]2.2.3 The PV Solar Systems that Used at FKE UTEM
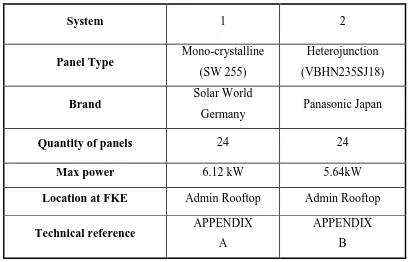
[image:23.595.100.512.171.433.2]The table 2.3 shows that there are two different types of PV solar systems that install around Faculty of Electrical Engineering (FKE).
Table 2.3: The PV solar systems that used for this research
System 1 2
Panel Type Mono-crystalline
(SW 255)
Heterojunction (VBHN235SJ18)
Brand Solar World
Germany Panasonic Japan
Quantity of panels 24 24
Max power 6.12 kW 5.64kW
Location at FKE Admin Rooftop Admin Rooftop
Technical reference APPENDIX
A
APPENDIX B
2.3 Type of PV Connection
PV power systems are generally classified according to their functional and operational requirements, their component configurations, and how the equipment is connected to other power sources and electrical loads. For this research, system that only has been applied was the grid-connected system.
The major components of a grid-connected PV system include the PV array, inverter and the metering system. In addition to these major components are the necessary cables, combiner boxes, protection devices, switches, lightning protection and signage. The connection of these systems must follow the requirements that made by a MS 1837:2005 Malaysian Standards on Installation of Grid Connected Photovoltaic System [23].
2.4 The Model of the Inverters
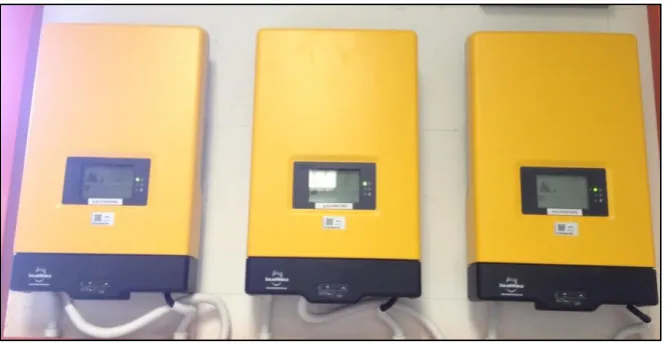
[image:24.595.149.482.401.573.2]The model of SMA sunny boy 2000HF was used for these two solar systems. Figure 2.4 show the inverter installation for this solar PV system. Each of this Mono-crystalline and HIT PV systems was used three inverters each. The performance of the inverter is depends on it operation efficiency behavior. These inverters were imported from USA. The further technical information will be at Appendix C.
Figure 2.4: The SMA SUNNY BOY 2000HF inverter.
![Figure 2.1: The flow of the PV cell basic operation [14].](https://thumb-us.123doks.com/thumbv2/123dok_us/137662.14806/19.595.120.520.611.705/figure-flow-pv-cell-basic-operation.webp)