FACULTY OF ELECTRICAL ENGINEERING
FINAL YEAR PROJECT REPORT
CONTROL STRATEGY OF THREE PHASE OF SERIES ACTIVE FILTER FOR VOLTAGE DISTURBANCES IN ELECTRICAL DISTRIBUTION SYSTEM
SITI NORDIANA BINTI YUNOS
BACHELOR OF ELECTRICAL ENGINEERING (INDUSTRIAL POWER) WITH HONOURS
CONTROL STRATEGY OF THREE PHASE OF SERIES ACTIVE FILTER FOR VOLTAGE DISTURBANCES IN ELECTRICAL DISTRIBUTION SYSTEM
SITI NORDIANA BINTI YUNOS
A report submitted in partial fulfilment of the requirements for the degree of Bachelor in Electrical Engineering (Industrial Power) with Honours
Faculty of Electrical Engineering
UNIVERSITI TEKNIKAL MALAYSIA MELAKA
“I hereby declare that I have read through this report entitle “Control Strategy of Three
Phase of Series Active Power Filter for Voltage Disturbances in Electrical Distribution
System” and found that it has comply the partial fulfilment for awarding the degree of
Bachelor of Electrical Engineering (Industrial Power)”
Signature :
Supervisor’s Name : Associate Professor Ir. Dr. Rosli Bin Omar
“I hereby declare that I have read through this report entitle “Control Strategy of Three
Phase of Series Active Power Filter for Voltage Disturbances in Electrical Distribution
System” and found that it has comply the partial fulfilment for awarding the degree of
Bachelor of Electrical Engineering (Industrial Power)”
Signature :
Student’s Name : Siti Nordiana Binti Yunos
ACKNOWLEDGEMENT
In the name of Allah, the Most Gracious, the most Merciful.
All Praise is due to Allah S.W.T for His mercy and grace. I am so thankful for all the chances that given to me. Finally, I manage to complete my report for Final Year Project entitle “Control Strategy of Three Phase of Series Active Power Filters for Voltage Disturbances in Electrical Distribution System”.
I would like to express my deepest appreciation to my supervisor, Associate Professor Ir. Dr. Rosli bin Omar who always guiding me through this project. It is a great chance for me to learn and get guidance from him until this project finally completed. Not to forget, I would like to express millions of thanks to both of my supportive parents, which never stop give support and courage me to give my best. Not to forget, all my friends, that always give their hands and always support each other through completing our study.
ABSTRACT
ABSTRAK
TABLE OF CONTENT
CHAPTER TITLE PAGE
LIST OF TABLE i
LIST OF FIGURE ii
1 INTRODUCTION 1.1 Project Background 1
1.2 Problem Statement 2
1.3 Objective 2
1.4 Scope 2
2 LITERATURE REVIEW 2.1 Voltage disturbances in electrical systems 3
2.1.1 Voltage Sags 3
2.1.2 Voltage Swells 3
2.1.3 Cause of Voltage Sags & Voltage Swells 4
2.1.3.1 Sags Causes 4
2.1.3.2 Sag Causes- Distribution Systems 5
2.1.3.3 Swell Causes 6
2.1.4 Impact of Voltage Sags and Voltage Swells 6
2.2 Monitoring and Testing 6
2.3 Solution 9
3 METHODOLOGY
3.1 Methodology of Project Activities 11
3.2 Flow Chart of Project Activities 12
3.3 The Simulation of Three Phase (SAPF) 13
3.4 Methodology of system of three phase SAPF 18
4 RESULT AND DISCUSSION 4.1 Condition 1: System without SAPF 20
(Voltage Sags and Swells) 4.2 Condition 2: System with SAPF 21 4.2.1 Case 1: Normal Condition (No Voltage Sags and Swells) 4.2.2 Case 2: Voltage Sags 23
4.2.3 Case 3: Voltage Swells 32 5 CONCLUSION 5.1 Conclusion 41
5.2 Recommendation 42
REFERENCES 43
LIST OF FIGURE
FIGURE TITLE PAGE
2.1 Voltage sags and voltage swells 4 2.3 Series active power filter 10 3.1 Flow chart of project activities 12 3.2 Series active power filter 14 3.3 Circuit configuration of three phase of series active power
filters 16
3.4 Circuit configuration of control unit 17 3.5 Schematic diagram of voltage source inverters
(normal circuit) 17
3.6 Simulation without SAPF 18
3.7 Message box of simulation diagnostics 19
3.8 Simulation with SAPF 19
4.1 Waveform shows voltage sags and voltage swells. 20 4.2 Waveform of normal grid voltage 22 4.3 Waveform of no voltage injected by injection
transformer 22 4.4 Waveform of load voltage without distortion 22 4.5 Waveform show 20% voltage sags in grid voltage within
0.5s until 0.7s 24
4.6 Waveform show 250V is injected to mitigate voltage sags
in source voltage within 0.5s to 0.7s 24 4.7 Waveform show load voltage back to its nominal voltage 24 4.8 Waveform show 30% voltage sags in grid voltage within
0.5s until 0.7s 26
4.9 Waveform show 220V is injected to mitigate voltage sags
4.11 Waveform show 50% voltage sags within 0.5s until 0.7s
in source voltage 28 4.12 Waveform show 159V is injected to mitigate voltage sags
in source voltage within 0.5s to 0.7s 28 4.13 Waveform show sag voltage is eliminate and load voltage
is back to its nominal value 28 4.14 Waveform show 60% voltage sags within 0.5s until 0.7s
in source voltage 30 4.15 Waveform show 125V is injected to mitigate voltage sags
in source voltage within 0.5s to 0.7s 30 4.16 Waveform show injected voltage bring load voltage to its
nominal value 30
4.17 Waveform show 20% of voltage swells in grid voltage
happen within 0.7s until 1.5s 33 4.18 Waveform show 60V is injected to mitigate 20% of
voltage swells in the system 33 4.19 Waveform show the load voltage is back to its nominal
value 33
4.20 Waveform show 30% of voltage swells in grid voltage
happen within 0.7s until 1.5s 35 4.21 Waveform show 60V is injected to mitigate 30% of
voltage swells in the system 35 4.22 Waveform show the load voltage is back to its nominal
value 35
4.23 Waveform show 50% of voltage swells in grid voltage
happen within 0.7s until 1.5s 37 4.24 Waveform show 150V is injected to mitigate 50% of
voltage swells in the system 37 4.25 Waveform show the load voltage is back to its nominal
value 37
4.26 Waveform show 60% of voltage swells in grid voltage
happen within 0.7s until 1.5s 39 4.27 Waveform show 180V is injected to mitigate 60% of
voltage swells in the system 39 4.28 Waveform show the load voltage is back to its nominal
LIST OF TABLE
TABLE TITLE PAGE
LIST OF APPENDICES
CHAPTER 1
INTRODUCTION
1.1 Project Background
Customers now days are interested in guaranteeing the quality and reliability of power supplies. This is because many economic activities are depends on the power quality and their efficiency. Power quality actually is referring to the quality of the voltage. Therefore, the voltage magnitude for perfect power quality must at a specified value, both RMS and peak. [1]
Unfortunately, due to many factors, perfect waveform of supply voltage is difficult to achieve. [2] This problem is due to voltage distortions such as voltage sags, swells and harmonics in electrical distribution network. This problems can cause failure or malfunction of sensitive equipment such as personal computers, programmable logic controllers (PLC) and contactors. [3]
Failure or malfunction of sensitive equipment in electrical distribution system may lead to various impacts such as power loss, disturbances, measurement errors, and control malfunctions, increase damage rate of components, cause undesirable tripping of sensitive devices and worse, may contribute to the degradation of the power quality in distribution network. All this effects will lead to industrial production losses because its operation is dependent on the functionality of mentioned sensitive equipment. [3] This occurrences just not have major economic impact but also impact on the quality services and products.
To mitigate the voltage disturbances in distribution system, there are a lot of methods can be used. One of methods is by using series active filters. Series active power filter (SAPF) is regarded as controlled voltage source (CVS) since it is able compensating voltage sags and swells by inject a voltage component in series with supply voltage. [3] Therefore, the SAPF are able to improve quality of power supply.
1.2 Problem Statement
Voltage disturbances that happened caused by fault in electrical distribution can reduce quality of power supply. This may lead to failure and damage of sensitive electrical equipment and lead to losses. [3] [4] Therefore, the ultimate goal of this project is to maintain perfect waveform of voltage supply.
1.3 Objectives
The objectives of this project are:-
1. To study the impact of voltage disturbances focusing on voltage sags and swells in electrical distribution system.
2. To propose efficient method that able to compensate voltage disturbances (sag and swell) in supply voltage.
3. To design, develop and analyse of a three phase of series active power filter configuration using MATLAB/SIMULINK system.
1.4 Scope
CHAPTER 2
LITERATURE REVIEW
2.1 Voltage disturbances in electrical systems
Voltage disturbances can be defined as any problem in voltage drop or voltage increase from its nominal value. This phenomena can lead to failure or malfunction of electrical equipment. [5][6] This problem then will give impact on quality and reliability of power supply. Voltage distortion is classified based on how the voltage are distorted as shown in table 2.1. [7]
Table 2.1: Types of voltage disturbances in electrical network
Disturbances Voltage Duration
Dip 0.1 – 0.9 pu 0.5 – 30 cycle
Surge (Swell) 1.1 – 1.8 pu 0.5 – 30 cycle
Flicker (𝑷𝑰𝒕) 0 – 1% Steady state
Imbalance 0.5 – 3% Steady state
Interruption <0.1 pu 0.5 cycle
2.1.1 Voltage Sags
Voltage Sag is happen when voltage level is distorted temporary to 10%-90% of it nominal value. It happen for 0.5 cycles to 1 minute. Therefore, it is classified as a short duration voltage decrease phenomena. [8]
2.1.2 Voltage Swells
Figure 2.1: Voltage sags and voltage swells [10]
2.1.3 Causes of Voltage Sags and Voltage Swells
2.1.3.1 Sags Causes [11]
The causes of voltage sags can be divided into three areas of occurrence which are the transmission system (usually above 65kV); distribution systems (65kV to 12 kV); and, point-of utilization (120-480V). Meanwhile, voltage swells are classes under a single category. [11] A common, basically cause of sags and swells in all three areas is an unexpected change of current flow through the source impedance.
A sag, the unexpected, large increase in the current required from a source will cause a larger voltage to be developed across the source impedance. This will cause in a reduction in the voltage, as seen by the load. Similarly with a surge. A sudden reduction in the current flow will effect an increase in voltage in inductive/capacitive impedances, which the load may experience.
Table 2.2: Cause of sags on distribution system
Cause No. Of Occurrences Percentage (%)
Wind and lightning 37 46
Utility equipment failure 8 10
Construction or traffic accident
8 10
Animals 5 6
Tree limbs 1 1
Unknown 21 26
Total 80
2.1.3.2 Sag Causes- Distribution Systems
Same like the transmission system causes, motor vehicle accidents, weather (lightning, wind), construction accidents, animal contact, contamination of insulators, falling or contact with tree limbs can result in voltage sags. Faults may happen in 3- phase, line-to-line, or single line-to-ground. But, the 3-phase faults are the most severe, but are relatively infrequent. "In an industrial plant, single line-to-ground faults on the utility system are the most common cause of voltage sags". [13] [14]
Based from previous study indicate that most important cause of momentary voltage sags is lightning strikes. In the common of sags, the voltage drops to about 80% of nominal value on the parallel feeders, while the faulted feeder may have a lower sag value, or may result in an outage if the fault cannot be mitigate.
2.1.3.3 Swell Causes[15]
Swells are less common than voltage sags, but also usually related with system fault conditions. A swell can occur due to a single line-to ground fault on the system, which can also effect in a temporary voltage rise on the unfaulted phases. This is specifically true in ungrounded or floating ground delta systems, where the sudden change in ground reference result in a voltage rise on the ungrounded phases. Usually, close to the substation on a grounded system, there will be no voltage rise on unfaulted phases because the substation transformer is usually connected delta-wye, providing a low impedance path for the fault current.
2.1.4 Impact of Voltage Sags and Voltage Swells [16]
Voltage sags may lead to following impacts:-
i. Equipment does not operate correctly
ii. Variable speed drives close down to prevent damage iii. Production rates fluctuates
iv. Unreliable data in equipment test v. Relays and contactors drop out vi. Dimming of lighting systems
Voltage swells may cause:-
i. Failure of system ii. Data corruption
iii. Damage of electronic devices
2.2 Monitoring and Testing
The four basic types of power quality monitors (also known as power line disturbance monitors) are: [18]
Event indicators, Text monitors,
Solid state recording volt/ammeters Graphical monitors.
Even though all of these devices can be used to measure or monitor sags and swells, the efficiency of each depends on what information the user wants to gain. Usually, the indicators are on the lower price end of the market. They indicate to the user that a sag or swell has occurred through visual means, such as indicator lights or illuminated bar graphs.
Meanwhile, some products will collect the worst case amplitudes of such and/or the number of occurrences of the type of event. Most such device do not provide an indication of the time of occurrence or the duration. Basically, the voltage limit detectors may be pre-set or programmable, with the accuracy being in the 2-5% range.
Textual-based monitors were actually the first dedicated power quality monitors, produced back in 1976. The function of these instruments is similar to the event indicators, except the output is in alphanumeric format. Additional information, such as duration and time-of-occupancy is often provided.
Besides, some of these products allow for the correlation of other information (such as environmental parameters and system status levels) to help the user in determining the cause of the event. Solid state recording volt/ammeters have replaced the older pen-and-ink chart recorders as a means of providing a graphical history of an event. These devices typically does not have the resolution necessary for monitoring fault-clearing sags. Sampling techniques range from average of several cycles to samples over 2-30 cycles. The averaging over several cycles may mask the sag or swell, as well as result in less accurate amplitudes. Sampling over multiple cycles will not properly represent the event either.
fault occurred upstream or downstream. The timing and magnitude information can frequently recognize the source of the fault. For example, if the phase current levels of the load same with to the voltage sag, the fault is more likely upstream. If the magnitude of the sag is down to 20% of nominal, it is likely that the fault was close by.
The location of the monitor, power supply wiring, measurement input wiring, and immunization from RFI/EMI is exclusively serious with the higher performance graphical monitors. The monitor itself must also be able of riding through the sag and surviving extended duration swells. Therefore, the functionality of the monitor should be thoroughly evaluated in the laboratory, under simulated disturbances, before placing out in the field. It is cannot be simply assumed it did not happen just because it have not be recorded. Unless there is equivalent information pointing to the cause of the disturbance before the monitoring begins, it is common practice to begin at the point of common coupling with the utility service as the initial monitoring point.
2.3 Solution
2.3.1 Series Active Power Filters (SAPF)
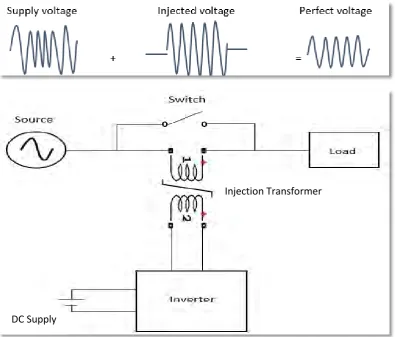
Series active power filters are operated mainly as a voltage regulator and as a harmonic isolator between the non-linear load and the utility system. It can protects the consumer from distorted supply voltage. SAPF will injects a voltage components in series with the supply voltage to compensate voltage sags and swells on the load side as shown in Figure 2.3. This method is recommended for compensated of voltage distortions from the AC supply and for low power applications. [20]
The main stages of the control system of a SAPF are as follows: detection of the start and finish of the sag, voltage reference generation, injection voltage generation, and
Figure 2.3: Series active power filter
Injection Transformer
![Figure 2.1: Voltage sags and voltage swells [10]](https://thumb-us.123doks.com/thumbv2/123dok_us/136734.13878/18.595.130.476.100.286/figure-voltage-sags-voltage-swells.webp)