ResearchOnline@JCU
This file is part of the following work:
Kuo, Chao-Yang (2017) Adaptive strategies in reef-building corals. PhD Thesis,
James Cook University.
Access to this file is available from:
https://doi.org/10.25903/5bfb7e3342ccc
Copyright © 2017 Chao-yang Kuo
The author has certified to JCU that they have made a reasonable effort to gain
permission and acknowledge the owners of any third party copyright material
included in this document. If you believe that this is not the case, please email
Adaptive strategies in reef-building
corals
Thesis submitted by
Chao-yang Kuo, MSc.
in May 2017
for the degree of Doctor of Philosophy
within the ARC Centre of Excellence for Coral Reef Studies
James Cook University
Acknowledgements
It has been a long and challenging but joyful journey and I am deeply grateful to my remarkable team of supervisors, Prof. Andrew Baird, Prof. Morgan Pratchett, and Prof. Terry Hughes, who have been tremendously supportive, and provided excellent guidance. Andrew thanks for your encouragement and giving me the freedom and independence to learn. I’m also very appreciative of your patience during this learning process. More than that, thanks for guiding me with your attitude, “Enjoy life”, which has been with me through all moments during this journey. Morgan, thanks for
providing consistent support and guidance throughout lab meetings. Terry, thanks for giving me this opportunity to give the adaptive strategies approach in corals another shot, and your support before the 3MT competition.
I also truly appreciate many other people who have helped me make this thesis possible, in their own ways.
Numerous other academics have inspired and guided me along the way. Dr. Josh Madin, Prof. Chaolun Allen Chen, Dr. Vianney Denis, and Dr. Sung-yin Yang; thank you for sharing your expertise and experience, and guiding me to improve my work. Thank you Ciemon Caballes, Cheng-han Tsai, and Michael McWillian for discussing statistic and trait-approach issues with me. Thank you Liz Tynan, Kellie Johns, and Kylie Simmonds for guiding me through the language boundary and the 3 Minute Thesis Competition. Many thank Lisa Boström-Einarsson being my professional proofreader.
Logistics would not have been possible without help from the following people: the exceptional team, Jennifer Lappin, Janet Swanson, Rose-Marie Vasiljuk, Olga Bazarka, David Yellowlees, Vivian Doherty, and Alana Grech at the CoE for Coral Reef Studies; Phil Osmond, Glenn Ewels and Jane Webb at “Boating and Diving”, and Marta
Espinheira at Orpheus Island Research Station. And to Andrew Norton and Brad King, the IT-heros taking care of my computer.
Many thanks all the member from Coral Larval Ecology Lab: Vivian Cumbo, Joana Figueiredo, Miin Chua, Erika Woolsey, James Tan, Brigitte Sommer, Ed Thomas. You guys are amazing and very helpful. “¡Viva la Larva!”
Besides the academic support mentioned above, daily life support was also equally important and was very much appreciated. The gang of the fantastic four, the big boss Diana Pazmino, the joyful Natalia Andrade, and the man always calm, Diego Ortiz, thanks for the support and company throughout this journey, and releasing the part of my soul that is Latin American. Thanks Vivian Lam for being my PhD buddy, supporting, cheering me up, and providing feedback on my work. Many thanks Colin Wen, James Tan, Kah Leng Cherh, Mei-fang Lin, Yan Xiang Ow, Meen Chee Hong, Kayan Ma, Boer Bao, Annie Chang, Wei Chi, Julia Yun-hsuan Hung, and Simon Hu for the support and sharing home style meals. I am also so grateful to have a group of inspiring friends to make life colourful and stylish: Emily Howells, David Abrego, Vera Horigue, Martina Prazeres, Chiara Pisapia, Sue Lim, Tessa Hempson, Blanche
D’Anastasi, Karen Michelle Chong-Seng, Thomas Mannering, Jorge Alvarez Romero, Georgina Gurney, Jennifer Donelson, Greg Torda, Jessica Blythe, James Kerry, Andrew Hoey, Alejandra Hernandez, César Herrera, Roger Huerlimann, Heather Loxton, Maria Nayfa, Maximilian Hirschfeld, Vanessa Messmer, Kristen King (Anderson), Wiebke Wessels, Sylvain Foret, Catalina Aguilar-Hurtado, Jeroen van de Water, Maria Del Mar Palacios, Kirsty Nash, Adriana Chacón, Adrian Arias, Rafael Magris, Nicolás Younes, Estefania Erazo-Mera, Sandra Infante, Santiago Calero, Lucia Lasso, Salomé
Maldonado, Wing Chan, Steve Doo, and Carynn Chen. I am very appreciated the support from all of you. Last but not least, I would also thanks Tsung-Jung Wu and Juanhui Lin who send unconditional support and warm words across the ocean.
To my family, I am so grateful having the unconditional support. To my brother, Chao-wei, thank you for taking care and be around with parents that I can trace corals along the Great Barrier Reefs. Thank you.
On the top of everyone, thanks Matsu for your bless and help making this dream come true.
Statement on the contribution of others
This thesis includes collaborative work with my supervisors, Prof. Andrew Baird,
Morgan S. Pratchett and Terry Hughes, as well as Dr. Joshua Madin. All chapters are at different stages of preparation for submission to peer-reviewed journals. The author contributions of each chapter are outlined below.
The manuscript based on Chapter 2 will be a collaboration with Andrew H. Baird (AHB), Morgan S. Pratchett (MSP) and Joshua S. Madin (JSM). Statistical analyses
were performed by CYK under the supervision of AHB, JSM and MSP. All authors will contribute to writing the manuscript.
The manuscript based on Chapter 3 will be a collaboration with AHB, Dr. Paul A.
Marshall (PAM), MSP and JSM. The field survey was designed by AHB and PAM and conducted by AHB, PAM, MSP and CYK. Statistical analyses were performed by CYK
under the supervision of AHB and JSM. All authors will contribute to writing the manuscript. Dr. Sally Keith (SK) was the volunteer for the fieldwork.
The manuscript based on Chapter 4 will be a collaboration with AHB and JSM.
The field survey was designed by CYK and conducted by CYK and AHB. Statistical analyses were performed by CYK under the supervision of AHB and JSM. All authors
will contribute to writing the manuscript.
The proof-reading of the thesis was conducted by Lisa Boström-Einarsson. Fieldwork was funded by ARC grants to AHB. The James Cook University
Contribution of authors to publications
Publication Contribution Author Madin et al. 2016 Conceived the idea, compiled the
preliminary data. Compiled, entered and edited trait data and jointly wrote the data descriptor
Joshua S. Madin and Andrew H. Baird
Compiled the preliminary data Marcela Diaz Compiled, entered and edited trait
data and jointly wrote the data descriptor
Joshua S. Madin, Kristen D. Anderson, Magnus Heide Andreasen, Tom C.L. Bridge, Stephen D. Cairns, Sean R. Connolly, Emily S. Darling, Marcela Diaz, Daniel S. Falster, Erik C. Franklin, Ruth D. Gates, Mia O. Hoogenboom, Danwei Huang, Sally A. Keith, Matthew A. Kosnik, Chao-Yang Kuo, Janice M. Lough, Catherine E. Lovelock, Osmar Luiz, Julieta Martinelli. Toni Mizerek, John M. Pandolfi, Xavier Pochon, Morgan S. Pratchett, Hollie M. Putnam, T. Edward Roberts, Michael Stat, Carden C. Wallace, Elizabeth Widman, and Andrew H. Baird
Publication Contribution Author Hughes et al. 2017 First draft Terry Hughes
Arial survey in 1998 and 2002 Russell C. Babcock and David R. Wachenfeld Arial survey in 2016 James T. Kerry, Terry Hughes, and Tristan
Simpson Coordinated data compilation,
analysis and graphics
James T. Kerry
Underwater survey Mariana Álvarez-Noriega, Andrew H. Baird, David R. Bellwood, Maria Byrne, Neal E. Cantin, Chao-yang Kuo, Guillermo Diaz-Pulido, Andrew S. Hoey, Mia O. Hoogenboom, Emma V. Kennedy, Michael J. McWilliam, Rachel J. Pears, Morgan S. Pratchett, Gergely Torda, Bette L. Willis, Tom C. Bridge, Hugo B. Harrison, Maria Byrne, Ian R. Butler, Russell C. Babcock, Steven J. Dalton, Will F. Figueira, Hamish A. Malcolm, John M. Pandolfi, Brigitte Sommer, Russell C. Babcock, Steeve Comeau, James P. Gilmour, Jean-Paul A. Hobbs, Malcolm T. McCulloch, Verena Schoepf, and Shaun K. Wilson.
Analysis matching satellite data to the bleaching footprints on the Great Barrier Reef.
Abstract
One of the major goals of ecology is to identify metrics of assemblage structure that
are easy to obtain and that enable accurate predictions of how assemblages respond to disturbance and environmental change. One recent approach, termed Universal Adaptive Strategy Theory (UAST), has been hypothesised to apply to all creatures on
the tree of life. However, previous attempts to classify reef-building corals according to UAST have been inconclusive, perhaps because they have not chosen species traits
according to the principles set out in the theory. In addition, the utility of the approach for predicting the response of coral assemblages to disturbance has not been effectively tested. This aims of my thesis was to test whether UAST applies to reef-building corals
and whether or not adaptive strategy grouping are useful for predicting the response of taxa to disturbance. In Chapter 2, I first classify coral species into groups using the principles of UAST and a comprehensive database of coral traits. Next, in Chapter 3, I test the ability of adaptive strategy groups to predict the response of coral taxa to disturbance using a long-term dataset from inshore reefs on the Great Barrier Reef
(GBR). Finally, in Chapter 4, I test for variation in the relative abundance of adaptive strategy groups in coral assemblages along the 1600 km latitudinal or environmental
gradient that is the GBR. I found that UAST does not apply to corals and the analyses suggests only two groups of species rather than the three predicted by the theory. I also found that adaptive strategy groups do not accurately predict how a taxa will respond to
disturbance nor do these groups respond in a predictable way along an environmental gradient. In conclusion, it is much more tractable and informative to explore traits
Table of Contents
Acknowledgements
Statement on the contribution of others
Contribution of authors to publications
Abstract
Table of Contents
List of Tables
List of Figures
CHAPTER 1
GENERALINTRODUCTION
1.1 Adaptive strategies in ecology ... 1
1.2 Adaptive strategies in ecology: a brief history ... 2
1.3 Adaptive strategies and reef-building corals ... 4
1.4 Other potential issue in applying adaptive strategy theory to corals ... 11
1.5 Outline of the thesis ... 12
CHAPTER 2
A TEST OF UNIVERSAL ADAPTIVE STRATEGY THEORY IN REEF-BUILDING CORALS
2.1 ABSTRACT
2.2 INTRODUCTION
2.3 MATrt
2.4.3 Summary of groups in the two-and three group scenario including categorical traits and
taxonomy
2.5 DISCUSSION
2.6 CONCLUSIONS
CHAPTER 3
FIFTEEN YEARS OF CHANGES IN THE ABUNDANCE OF CORALS ON INSHORE REEFS IN
THE CENTRAL GREAT BARRIER REEF: A TEST OF ADAPTIVE STRATEGY THEORY
3.1 ABSTRACT
3.2 INTRODUCTION
3.3 MATERIAL AND METHODS
3.3.1 Study site
3.3.2 Survey method
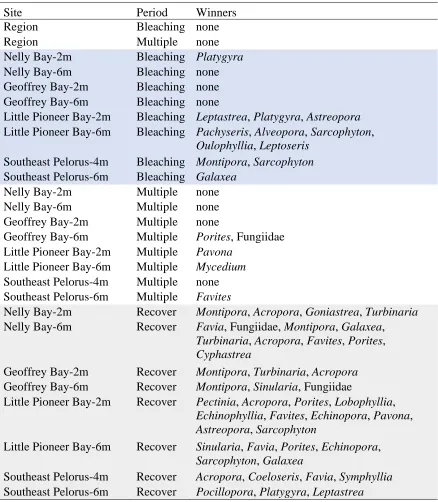
3.3.3 Change in coral abundance through time 3.3.4 Disturbance regime through the course of the study 3.3.5 The response of taxa in the different time intervals 3.3.6 Bleaching mortality index vs. response as estimated by the change in effect size
3.4 RESULTS
3.4.1 Changes in the abundance of coral through time 3.4.2 Response of taxa to bleaching in 1998 3.4.3 Response of taxa to multiple disturbances 3.4.4 Response of taxa to periods of no disturbance or stress 3.4.5 Bleaching mortality index vs response as estimated by the change in effect size
3.5 DISCUSSION
CHAPTER 4
LATITUDINAL VARIATION IN THE RELATIVE ABUNDANCE OF ADAPTIVE-STRATEGIES
IN CORAL ASSEMBLAGES.
4.1 ABSTRACT
4.2 INTRODUCTION
4.3 MATERIAL AND METHODS
4.3.4 Latitudinal trends in the relative abundance of adaptive strategy groups
4.4 RESULTS
4.4.1 Latitudinal trends in coral cover and species richness and evenness 4.4.2 Latitudinal trends in assemblage structure 4.4.3 Latitudinal trends in the assemblage-weighted mean of the traits 4.4.4 Latitudinal trends in the relative abundance of adaptive strategies
4.5 DISCUSSION
CHAPTER 5
GENERALDISCUSSION
5.1 General discussion
5.2 Future directions
REFERENCES
List of Tables
Table 1.1 Suggested adaptive strategies under different environmental conditions from low to high levels of either disturbances or stress. Modified from Table 1 in Grime
(1977).
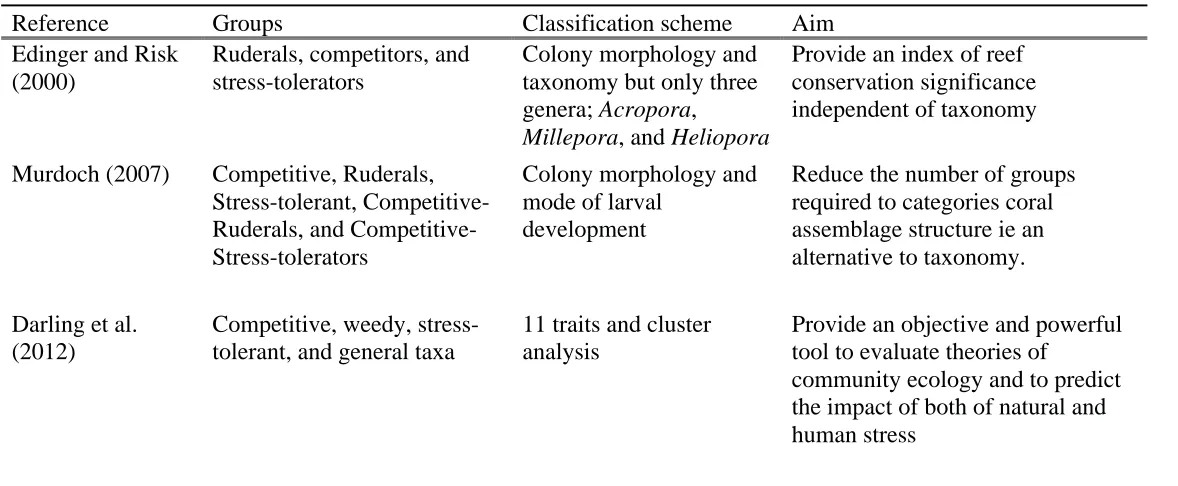
Table 1.2 A summary of previous adaptive strategy approaches in corals. Table 1.3 Taxa included in each group in the various adaptive strategy schemes used
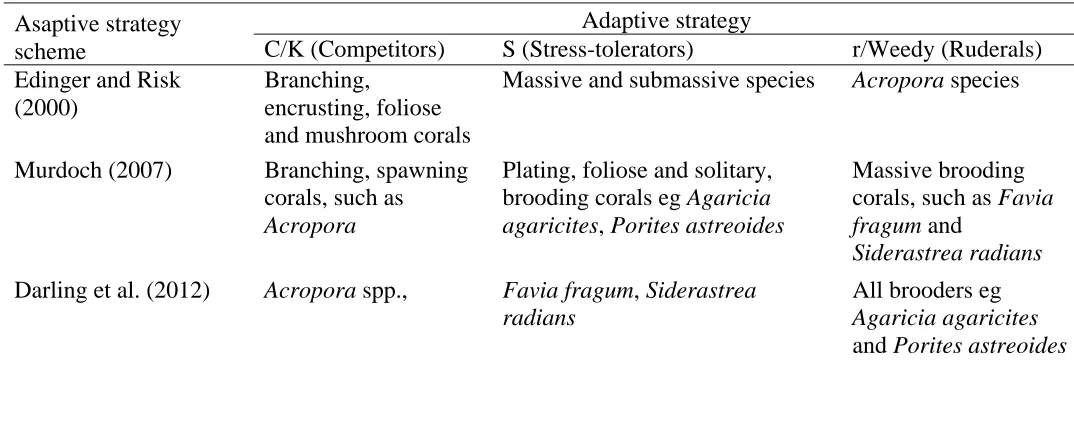
previously in corals.
Table 1.4 Biological and ecological characters associated with three adaptive strategy
groups of UAST.
Table 1.5 The results of Kruskal-Wallis rank tests. Table 2.1 Traits used in the analyses. The description of traits is from Madin et al.
(2016b). All traits are continuous.
Table 2.2 Traits used in the data infilling process. The description of traits is from
Madin et al. (2016b). All traits are categorical.
Table 2.3 Summary statistics for the five continuous traits used in the analyses. Table 2.4 The statistic result comparing the variations between the 2 groups. The result
of (a) permutational multivariable analysis of variation (PERMANOVA) and (b)
Kruskal-Wallis rank test of each species trait.
Table 2.5 Summary of species traits across scenarios of 2 to 3 groups. For categorical traits (No. of family, genus, species, mode of larval development, growth form, and sexuality), abundance of each trait is presented; mean (standard deviation) is
reported for continuous traits.
Table 3.1 History of disturbances affecting the coral assemblages on Magnetic Island
and the Great Palms during study period.
Table 3.2 Adaptive strategy groups. Table 3.3 One-way ANOVA testing for difference in the mean coral abundance
through time at eight sites in the central Great Barrier Reef region from 1998 to
2012/13.
Table 3.4 Summary of changes in the abundance of genera at each site in the three
different periods.
Table 4.1 Survey sites
Table 4.2 Permutational multivariate analysis of variance (PERMANOVA) result of testing the two groups identified in the cluster analysis. Table 5.1 The comparison between coral and terrestrial plant and anima, and the
List of Figures
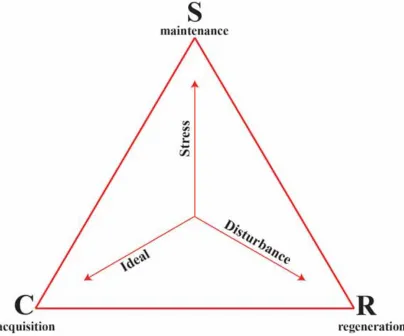
Fig. 1.1 The Universal Adaptive Strategy Theory (UAST) triangle indicating the
predicted dominated strategy under different conditions. Fig. 1.2 A comparison of corallite size (a-d), growth rate (e-h), polyp fecundity (i-l),
propagule size (m-p), skeletal density (q-t), and colony size (u-x), of each adaptive strategy classified by Edinger and Risk (2000)(a, e, I, m, q, u),
Murdoch_Caribbean (2007)(b, f, j, n, r, v), Murdoch_global (2007)(c, g, k, o, s, w), and Darling et al. (2012)(d, b, l, p, t, x). Murdoch_Caribbean contains only
Caribbean species because Murdoch (2007) used only species from Caribbean in his adaptive-strategy scheme. Murdoch_global includes Caribbean and Indo-Pacific species following the same criteria as Murdoch_Caribbean. Green points indicate outliners picked up by the analysis. The letters at the top of each plot indicates the results of a multiple comparison test after Kruskal-Wallis test. Strategies that share the same letter within a plot are not significantly different to
each other for that specific trait.
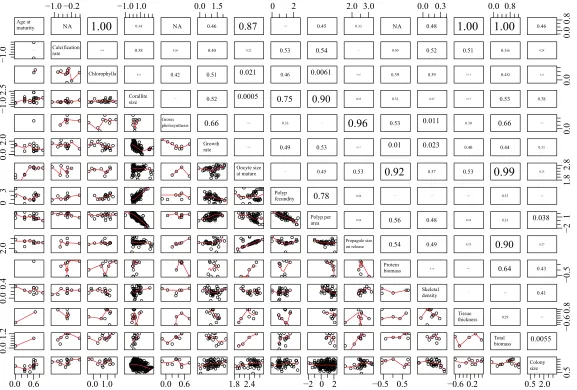
Fig. 2.1 Correlation among traits for use in determining the best model for trait infilling.
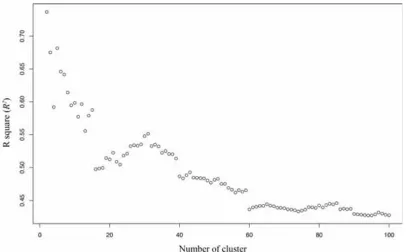
Fig. 2.2 Histogram of each of the individual traits. Fig. 2.3R2 for each of scenario of from 2 to 100 clusters from the hierarchical cluster
analysis. The 2-cluster scenario is the preferred scenario with a clear drop in R2
between 2 and 3 clusters.
Fig. 2.4 Principle component analysis of 473 reef-building coral species and five traits with scenarios of from two to four groups. Solid lines indicate the 95% confidence
ellipses (a) two groups, (b) three groups.
Fig. 2.5 Hierarchical cluster analysis of 473 reef-building corals species based on five
species traits (a) two groups, (b) three groups.
Fig. 3.1 Location of survey sites, including Nelly Bay (NB); Geoffrey Bay (GB); Little
Pioneer Bay (LPB); and Southeast Pelorus (SEP).
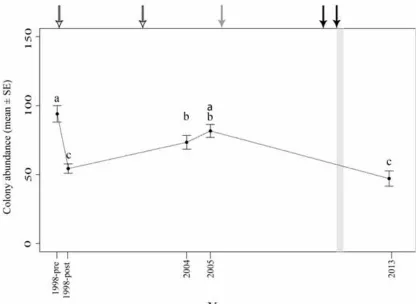
and 2002, white), one low tide event (2005, grey), two flood events (2009, 2010-2011, black). The grey bar indicates tropical Cyclone Yasi in 2011. Letters above dots indicate significant groupings by Tukey’s post hoc test at different surveys. Fig. 3.3 Temporal changes in average anthozoan colony abundance (mean ± SE) at 8
sites in the central Great Barrier Reef region from 1998 to 2013. Sites include NB 2m (a) 6m (b), GB 2m (c) 6m (d), LPB 2m (e) 6m (f), and SEP 4m (g) 6m (h). Arrows indicated disturbances including two bleaching events (1998 and 2002, white), one low tide event (2005, grey), two flood events (2009, 2010-2011, black). The grey bar indicates tropical Cyclone Yasi in 2011. Letters above dots indicate significant groupings by one-way ANOVA, Welch's F test and Tukey’s
post hoc test at different surveys.
Fig. 3.4 Effect size by taxa for bleaching (a) and multiple disturbances (b) at regional scale. Colours indicate Darling at al.’s adaptive strategy scheme used, including competitive (red), generalist (gray), stress-tolerant (blue), weedy (green), and
unknown (black) strategy.
Fig. 3.5 Effect size by taxa for bleaching event. Sites include Nelly Bay 2m (a) 6m (b), Geoffrey Bay 2m (c) 6m (d), Little Pioneer Bay 2m (e) 6m (f), and Southeast Pelorus 4m (g) 6m (h). Colours indicate Darling at al.’s adaptive strategy scheme used, including Competitive (red), generalist (gray), stress-tolerant (blue), weedy
(green), and unknown (black) strategy.
Fig. 3.6 Effect size by taxa for multiple disturbances. Sites include Nelly Bay 2m (a) 6m (b), Geoffrey Bay 2m (c) 6m (d), Little Pioneer Bay 2m (e) 6m (f), and
Southeast Pelorus 4m (g) 6m (h). Colours indicate Darling at al.’s adaptive strategy scheme used, including Competitive (red), generalist (gray), stress-tolerant (blue),
weedy (green), and unknown (black) strategy.
Fig. 3.7 Effect size by taxa for recover period. Sites include Nelly Bay 2m (a) 6m (b), Geoffrey Bay 2m (c) 6m (d), Little Pioneer Bay 2m (e) 6m (f), and Southeast Pelorus 4m (g) 6m (h). Colours indicate Darling at al.’s adaptive strategy scheme used, including Competitive (red), generalist (gray), stress-tolerant (blue), weedy
(green), and unknown (black) strategy.
Fig. 3.8 Bleaching mortality index vs. effect size. Blue line represents the smooth line of LOESS smoother. Red line and the formula above represent the linear
strategy scheme used, including Competitive (red), generalist (gray), stress-tolerant (blue), weedy (green), and unknown (black) strategy. Fig. 4.1 Location of the 27 survey reefs along the Great Barrier Reef. One to three sites
were surveyed per reef.
Fig. 4.2 Changes in (a) reef-building coral cover, (b) species richness, and (c) evenness along the latitude of the Great Barrier Reef. Block dots represent the value of each
index recorded on each transect. Red line and the formula above each graph
represent the linear regression line and regression result.
Fig. 4.3 Hierarchical cluster analyses of coral assemblage composition on 47 sites of 27 reefs. The first four digits label the reef on the map, while the last digit refers to the site on each reef. The colours show the two groups identified in the cluster
analysis.
Fig. 4.4 The principle component analysis (PCA) of coral assemblage composition on 47 sites of 27 reefs. The colours show the two groups identified in the cluster
analysis.
Fig. 4.5 Assemblage-weighted means (AWM), block dots, in assemblages along the latitude for six species traits, including (a) corallite size, (b) growth rate, (c)
propagule size, (d) fecundity, (e) skeletal density, and (f) colony size. The red line
is the linear regression line.
CHAPTER 1
GENERAL INTRODUCTION
1.1Adaptive strategies in ecology
Adaptive strategy theory proposes that the direction of natural selection is constrained by trade-offs in life-history traits that shape both the organism and the
role it plays in ecosystem processes. Adaptive strategy theories are very appealing to tropical community ecologists because they aim to limit the number of ecological units required to describe assemblages and predict how assemblages respond to
disturbance. For example, the limited number of groups typically identified by adaptive strategy approaches are likely to be much easier to work with than the 100s
of species that commonly make up tropical assemblages, such as reef corals. Finally, the promise to reveal the functional role of a species in the ecosystem using the adaptive strategy approach is also very appealing, particularly in groups such as reef
corals where such knowledge is limited.
The concept of adaptive strategies first emerged in MacArthur and Wilson’s
classic book “The Theory of Island Biogeography” (MacArthur and Wilson 1967). The concept has since progressed through many iterations, the most recent being Grime and Pierce’s (2012) Universal Adaptive Strategy Theory (UAST) - a scheme
the authors claim applies to all organisms on the tree of life. The authors summarize the scheme as follows
“A universal three-way trade-off constrains adaptive strategies throughout the tree of life, with extreme strategies facilitating the survival of genes via: (C)
resource control in consistently productive niches, (S) individual survival via
maintenance of metabolic performance in variable and unproductive niches, or
(R) rapid gene propagation via rapid completion of the life cycle and
regeneration in niches where events are frequently lethal to the individual”. Grime and Pierce (2012).
The aim of my thesis is to test whether or not this scheme applies to reef-building corals as claimed by Grime and Pierce (2012) and further, whether or not the scheme
offers ecological insights above and beyond alternative approaches to community ecology such as more direct trait based approaches or traditional taxonomy.
1.2Adaptive strategies in ecology: a brief history
Numerous adaptive-strategy theories have been developed to describe the
trade-offs among species traits and species interactions with their environment. Initially, r/K
selection was developed to describe how selective processes work on islands where resources and space are limited. Early colonisers of an island will not experience
crowding, and therefore selection should favour species that can proliferate rapidly (MacArthur and Wilson 1967). The term r refers to the maximum intrinsic rate of
natural increase [rmax] (MacArthur and Wilson 1967). In contrast, later in the process
of island colonisation, resources available for each individual are lower and selection should favour species that can maintain the population under these conditions
(MacArthur and Wilson 1967). The term K refers to the carrying capacity of
environment (MacArthur and Wilson 1967). Pianka (1970) further hypothesised that
mortality is low, selection will favour organisms that delay reproduction, have longer
life-spans and a capacity to monopolize resources (K-selection).
While the theory of r/K selection initially became very popular it has gradually
gone out of favour due to several perceived flaws. As Pianka (1970) pointed out “no organism is completely ‘r-selected’ or completely ‘K-selected’, but all must reach some compromise between the two extremes”. For instance, both trees and sea turtles
are long lived and delay reproduction, both characteristic of K-selection, but they also have r-selected characteristics in that both produce numerous offspring. In addition,
the theory was criticised because, unlike r, K cannot be directly expressed as a
function of life-history traits (Stearns 1977). In other words, there are several different strategies by which a population can approach the carrying capability of an
ecosystem, such as capturing a high amount of resources or resisting unfavorable environmental conditions (Stearns 1977; Grime and Pierce 2012).
Greenslade (1972) next identified a third type of selection associated with the ability to acquire resources in unfavourable or stressful habitats that he termed “beyond K”. These ideas were incorporated into a three-way trade-off theory, as r, K
and A (Adversity) selection by Southwood (1977). r/K/A selection was further developed into the Southwood-Greenslade template for animals (Southwood, 1988),
which shares similarities with CSR theory for plants (Grime, 1974), where by K and A selection in r/K/A selection is equal to C and S selection in CSR theory, separately. Other three-way trade-off schemes include the rKL scheme for bacteria (Golovlev
2001), rKI (Taylor et al. 1990), RDV (De Miguel et al. 2010) and the LFG (Enright et al. 1995) schemes for plants.
a more detailed theoretical framework and was therefore chosen as the most
appropriate scheme with which to test the utility of the adaptive strategy approach in reef-building corals. UAST identifies three adaptive strategies: Competitive species have traits that maximise resource acquisition and control in consistently productive niches where the intensity of disturbance and stress are low; Stress-tolerant species have traits that maintain metabolic performance in variable and unproductive niches
where the intensity of disturbance is low but the intensity of stress is high; and Ruderal species complete their life cycle or regenerate rapidly in productive niches where disturbance events are frequently lethal (Fig. 1.1, Table 1.1). The distinction between stress and disturbance is an important aspect of UAST: stress is defined as “the sum of many agents that limit the quantity of living matter created per unit of
space and time by constraining its production”; and disturbance as “the sum of the great multiplicity of agents that limit biomass by partly or completely destroying it”
(Grime and Pierce 2012).
1.3Adaptive strategies and reef-building corals
A number of researchers have applied various adaptive strategy schemes to reef-building corals. Loya (1976) suggested Stylophora pistillata was a classic r-selected
species on the basis of a number of traits often linked to r-selection: rapid colonization of primary habitats, small colony size, early reproduction and vulnerability to disturbance. Loya (1976) further suggested that most coral species
could be classified along the r-K continuum. Similarly, Jokiel (1998) proposed that
Pocillopora damicornis was r-selected because it produced numerous planula larvae
colonizing unpredictable reef habitats, rapid development, great population turnover,
early reproduction, and high rate of natural increase”.
Grime’s CSR scheme outline above has been highly influential in adaptive
strategy approaches in reef-building corals. Edinger and Risk (2000) proposed a classification scheme for corals based on Grime’s CSR scheme with the aim of assisting managers with little or no taxonomic expertise to assess the conservation
significance of different coral assemblages. Edinger and Risk (2000)’s scheme was based on colony morphology plus some common and easy to identify hard coral
genera. Tabular colonies plus Millepora spp. and Heliopora coerulea were classified as ruderal; branching, encrusting, foliose, and mushroom corals were classified as competitive; massive and sub-massive corals were classified as stress-tolerant.
Edinger and Risk (2000) suggested that the relative abundance of these three strategies in a coral assemblage was a good proxy for species richness and habitat
quality (Edinger and Risk 2000). In particular, they found that coral assemblages dominated by stress-tolerant species had low coral cover and low species richness. In contrast, assemblages with a more even mix of strategies were more species rich with
a more complex habitat that would better support reef-fish assemblages (Edinger and Risk 2000). Given the high correlation between morphology and the three strategies
in the scheme it is difficult to understand the need to situate this work within an adaptive strategy framework. Similarly, given that the groups are defined largely on colony morphology, it is a tautology to state that assemblages with an even mix of
adaptive strategy groups would have higher structural complexity. The aim of Edinger and Risk (2000) to identify habitats of conservation significance could have been
not been used since.
Similarly, Murdoch (2007) classified coral species in the Florida Keys into five adaptive groups, based on colony morphology and the mode of larval development.
The aim of Murdoch’s work was to simplify the description of coral assemblages (i.e. five groups vs. 38 species in the Florida Keys) and to explore the response of each group along an environmental gradient. There are many problems with this work. In
particular, the choice of traits with which to group species has no direct link to adaptive strategy theory and therefore it is difficult to predict how each group should
respond to the environmental gradient, which is also very poorly defined. Furthermore, the results are difficult to judge whether or not this scheme offered any ecological insight above that gained by using morphology or taxonomy. Once again,
utility of this scheme can best be judged by the fact that it has never been used since and the work has never been published outside of Murdoch’s PhD thesis.
Darling et al. (2012) were the first to apply a quantitative trait based approach to identify adaptive strategy groups in reef-building reef-building corals. Darling et al. (2012) used 11 traits to classify 143 species into four groups that they named
competitive, weedy, stress-tolerant and generalists. In this scheme competitive species form large colonies with branching or plating morphology that grow quickly, occur in
shallow reef habitats and reproduce by broadcast spawning; weedy species are smaller and reproduce by brooding; stress-tolerant corals are mostly massive, grow slowly and reproduce by broadcast spawning; generalist are domed and plating species with a
moderate growth rate and large colony size. Despite the empirical and analytical approach, there are numerous problems with this work. In particular, Darling et al.
trade-offs in energy allocation towards acquisition, maintenance or regeneration
(Grime and Pierce 2012). In particular, it is difficult to see how traits such as colony size, colony growth form, modularity, mode of larval development, depth range and
symbiont richness compete against each other for energetic resources. For example, there are a number of different ways for a colony to reach a large size: a colony can invest in rapid growth to reach a large size quickly or it can invest in skeletal density
in order to survive periods of disturbance. Thus colony size is ambiguous in terms of adaptive strategy. This poor choice of traits explains why a number of the species in
Darling at al.’s groups seem out of place. For example, the slow-growing massive species Dendrogyra cylindrus (Hudson and Goodwin 1997) is classified as a competitor along with numerous fast-growing Acropora spp. possibly because both
taxa can reach a large size (Veron 2000). Similarly, while the mode of larval development clearly has a strong appeal due to the apparent trade-off between a few,
large offspring (brooding) versus many, small offspring (spawning) (eg Loya 1976; Jokiel 1998; Murdoch 2007), brooding and spawning do not necessarily represent differences in the amount of energy devoted to reproduction. The fact that all species
in Darling at al.’s “weedy” group are brooders suggests that this trait has been given too much weight in determining the groups. In addition, Darling et al. (2012) did not
specifically address how the traits of the groups relate to UAST. For example, their S-species have traits normally associated with ruderal strategies, such as high fecundity, plus traits normally associated with being good competitors for space, such as large
corallite size (Lang 1973). As a test of UAST it also fails because Darling et al. (2012) identify four groups rather than the three groups predicted by the theory.
Potential problems with the above three approaches are also revealed when they
are directly compared (Table 1.2). Firstly, the same taxa are often classified into different adaptive groups. For instance, Acropora spp. were considered ruderals by
Edinger and Risk (2000) and competitors by Murdoch (2007) and Darling et al. (2012) (Table 1.3). Similarly, Agaricia agaricites and Porites astreoides were classified as stress-tolerant by Murdoch (2007) and ruderals by Darling et al. (2012)
(Table 1.3). The inconsistency of these three schemes is further evident when comparing the trait values of each strategy using data from coraltraits.org (Madin et al.
2016a). For example, all the schemes claim that C- and R-species grow quickly and S- species grow slowly (Table 1.4). However, there is no significant difference in growth between R- and S-species in either Murdoch (2007) (Fig. 1.2f, g, Table 1.5) or
Darling et al. (2012) (Fig. 1.2h, Table 1.5). UAST further suggests that R-species should have a high investment in reproduction (Table 1.4). However, there was no
significant difference in either fecundity or propagule size among Murdoch’s three strategies (Fig. 1.2j, n, Table 1.5). Similarly, the S-species of Edinger and Risk (2000) and Darling et al. (2012) have the highest polyp fecundity in their respective schemes
(Fig. 1.2i, l, Table 1.5).
It is important to note that an analytical approach to defining the groups relies on
data from numerous species for numerous traits and these data are not easy to come by. For example, traits that vary greatly in time and space and among individuals, such as skeletal density and growth rate, require the destructive sampling of numerous
individuals from multiple sites. Similarly, determining reproductive traits such as fecundity and sexuality requires expensive equipment and processing samples is
available of the utility of the adaptive strategy approach in coral reef ecology do not
suggest it offers any ecological insight above more straightforward classification schemes.
Darling et al. (2013) claim in the title of their paper that “Life histories predict coral community disassembly under multiple stressors”. However, the evidence to support this statement is mixed because Darling at al.’s groups do not always respond
in the way adaptive strategy theory predicts. Darling et al. (2013) investigated changes in the abundance of adaptive stratedy groups in response to fishing and a
bleaching event on reefs in Kenya. On unfished reefs, all groups fluctuated in synchrony in the six years prior to the bleaching, whereas UAST predicts that competitive species should benefit in periods free of stress and disturbance. Bleaching
caused all three groups to decline dramatically on unfished reefs, whereas UAST predicts that the stress-tolerant species should benefit. Similarly, all three groups on
unfished reefs increased in abundance in synchrony following the bleaching, whereas the theory predicts that the competitive species should dominate. In some cases the response of the groups was context-dependent. For example, stress-tolerant species
declined in response to bleaching on unfished reefs but not on fished reefs. This suggests that there is a range of different responses to bleaching among species within
the stress-tolerant group. In other cases the response of groups varied through time. For example, weedy species increased on fished reefs during the six years prior to bleaching but there was no similar increase in the 12 years after the bleaching. In fact,
the only finding consistent with the predictions of the theory is that competitors are more susceptible to chronic disturbance in the form of fishing than stress-tolerant and
species are more susceptible to fishing than non-branching species. Therefore, the
claim for improved ecological insight using the adaptive strategies approach is not apparent. Indeed, a very simple morphological approach to classifying corals would
have been equally informative (i.e. branching vs non- branching) and much less time-consuming.
Graham et al. (2014) concluded that the relative abundance of Darling at al.’s
adaptive strategy groups was useful for distinguishing among reefs with a different disturbance history on the Great Barrier Reef (GBR). Specifically, the relative
abundance of competitive taxa was higher on undisturbed and recovered reefs than on reefs that had not recovered from a crown-of-thorns outbreak. However, the only locally abundant species classified as competitors were Acropora spp. Therefore,
these reefs could equally well have been distinguished by classifying taxa as
Acropora or non-Acropora. In addition, the three other Darling at al.’s groups were
all relatively less abundant on disturbed reefs, in contrast to the prediction of UAST that stress-tolerant or weedy species should dominate in disturbed habitats.
Sommer et al. (2014) used Darling at al.’s scheme to compare the relative
abundance of species in each adaptive group among coral assemblage along a high-latitude gradient in south-eastern Australia – a gradient that included sites at the range
limit of most coral species. The only clear trend in these data was a decrease in the relative abundance of stress-tolerant species in coral assemblage at higher latitudes. This is in direct contrast to UAST that predicts that stress-tolerant species should
dominate in unproductive habitats, such as these marginal reefs at high latitude. Clearly, Darling at al.’s adaptive strategy groups are not behaving as the theory
Furthermore, the use of the groups does not appear to offer any ecological insight
beyond that achievable with a very simple taxonomic approach.
1.4Other potential issue in applying adaptive strategy theory to corals
The life-history traits of reef-building corals are a very different to most plants and animals, which suggest that they might be difficult to classify within existing
adaptive strategy schemes. In particular, most corals are clonal with limited plasticity in many reproductive traits. While there is likely to be a large range in the longevity
of corals species the clonal nature of corals makes it difficult to determine the age of individuals due to asexual reproduction, including fission and fragmentation, and the fact that multiple colonies can fuse together to form a single individual (Hughes and
Jackson 1980). In addition, the vast majority of corals species have annual gametogenic cycles meaning individuals breed only once per year (Baird et al. 2009).
This limits the capacity of individuals to reproduce sexually in response to stress, unlike numerous r-adapted plants and animals. Even in species that release propagules over an extended period, like most brooding species, it is unclear whether or not
individual polyps within the colony breed once or repeatedly (Baird et al. 2015). However, various means of asexual reproduction, such as fission and fragmentation
(Fautin 2002), means some coral populations can rapidly increase in abundance in response to stress and disturbance, such as bleaching or hurricanes (Hughes and Jackson 1985; and see Chapter 3). In addition, there is little variation in the age at first
reproduction, unlike flowering plants where some species breed within weeks and others delay reproduction for many decades (Grime and Pierce 2012). While the data
also very different to most other plants and animals. In particular, corals are both
autotrophic, deriving nutrition from endosymbiotic algae, Symbiodinium spp., and heterotrophic, deriving nutrition from prey captured from the plankton (Goreau et al.
1971). In addition, many coral species can switch between these nutritional modes depending on the prevailing conditions (Porter 1976).
The distinction that UAST makes between stress and disturbance is not as clear in
the marine environment as in the terrestrial environment. Stress as defined by UAST is rare in the marine environment. In the terrestrial realm it occurs due to a lack of
water or nutrients. Coral reefs primarily occur in oligotrophic waters which are by definition nutrient poor with no shortage of water. Alternative stressors relevant to coral reefs include eutrophication and a decline in the availability of light as depth or
latitude increase. While coral bleaching could potentially be regarded as a stress because it leads to lack of nutrients for affected corals, it almost always also results in
a large loss of tissue. Disturbances, in particular tropical storms, however, are common. Therefore, not only do corals have life-history traits that make them difficult to place in UAST groups, the environment in which they live is also difficult
to define within UAST.
1.5Outline of the thesis
The primary aim of this thesis is to test whether the adaptive strategy approach can be applied to corals, and if so, to explore the utility of the approach by testing
whether it provides improved ecological insight compared to the use of standard classification schemes based on morphology or taxonomy. In particular, I will explore
stress and disturbance and whether the relative abundance of these groups varies
predictably along a latitudinal gradient. The specific chapters are outlined below. In Chapter 2, I test whether UAST applies to reef-building corals. I use UAST principles in combination with a recent comprehensive compilation of coral traits to explore whether or not species cluster into groups that represent different adaptive strategies.
In Chapter 3, I test whether the groups identified by Darling et al. (2012) are good predictors of the responses of coral taxa to environmental stasis and change. I
will use a 15-year data set that documents changes in the abundance of coral genera at eight sites in the central Great Barrier Reef (GBR). This time period includes the mass bleaching of corals in 1998, a number of other stresses and disturbances, as well as
periods of stasis.
In Chapter 4, I test whether the relative abundance of the groups identified in Chapter 2 varies predictably along an environmental gradient: the 1800 km length of the GBR. I will use data collected in the field to describe coral assemblage structure along the length of the GBR. In particular, I use this environmental gradient to test
whether coral assemblages confirm to the predictions of UAST that southern coral assemblages should have a higher relative abundance of S- adapted species.
I also include in an appendix pdfs of two publications on which I am a co-author
that arose from my collaborations with colleagues at James Cook University in the
Table 1.1 Suggested adaptive strategies under different environmental conditions from low to high levels of either disturbances or stress. Modified from Table 1 in Grime (1977).
Intensity of Stress
Intensity of Disturbance Low High
Low C-strategy S-strategy
Table 1.2 A summary of previous adaptive strategy approaches in corals.
Reference Groups Classification scheme Aim
Edinger and Risk (2000)
Ruderals, competitors, and stress-tolerators
Colony morphology and taxonomy but only three genera; Acropora,
Millepora, and Heliopora
Provide an index of reef conservation significance independent of taxonomy
Murdoch (2007) Competitive, Ruderals, Stress-tolerant, Ruderals, and Competitive-Stress-tolerators
Colony morphology and mode of larval
development
Reduce the number of groups required to categories coral assemblage structure ie an alternative to taxonomy.
Darling et al. (2012)
Competitive, weedy, stress-tolerant, and general taxa
11 traits and cluster analysis
Provide an objective and powerful tool to evaluate theories of
Table 1.3 Taxa included in each group in the various adaptive strategy schemes used previously in corals. Asaptive strategy
scheme
Adaptive strategy
C/K (Competitors) S (Stress-tolerators) r/Weedy (Ruderals) Edinger and Risk
(2000)
Branching,
encrusting, foliose and mushroom corals
Massive and submassive species Acropora species
Murdoch (2007) Branching, spawning corals, such as
Acropora
Plating, foliose and solitary, brooding corals eg Agaricia agaricites, Poritesastreoides
Massive brooding corals, such as Favia fragum and
Siderastrea radians
Darling et al. (2012) Acropora spp., Favia fragum, Siderastrea radians
All brooders eg
Agaricia agaricites
Table 1.4 Biological and ecological characters associated with three adaptive strategy groups of UAST.
Adaptive-strategy
Characteristics C S R
Maximum size Large Wide range Small
Longevity Long Long to
very long
Very short
Reproductive maturity Late Late Early
Frequency of reproduction Once per year Every few years
Numerous times per year
Reproductive effort Small Small Large
Growth rate Rapid Slow Rapid
Response to stress and disturbance Sensitive Less sensitive
Sensitive
Palatability Variable Low High
Table 1.5 The results of Kruskal-Wallis rank tests. Species trait Edinger and English
(2000)
Murdoch_Caribbean (2007)
Murdoch_Global (2007)
Darling et al. (2012)
Fig. 1.2 A comparison of corallite size (a-d), growth rate (e-h), polyp fecundity (i-l), propagule size (m-p), skeletal density (q-t), and colony size (u-x), of each adaptive strategy classified by Edinger and Risk (2000)(a, e, I, m, q, u), Murdoch_Caribbean (2007)(b, f, j, n, r, v), Murdoch_global (2007)(c, g, k, o, s, w), and Darling et al. (2012)(d, b, l, p, t, x). Murdoch_Caribbean contains only Caribbean species because Murdoch (2007) used only species from Caribbean in his adaptive strategy scheme. Murdoch_global includes Caribbean and Indo-Pacific species following the same criteria as Murdoch_Caribbean. Green points indicate outliners picked up by the analysis. The letters at the top of each plot indicates the results of a multiple comparison test after Kruskal-Wallis test. Strategies that share the same letter within a plot are not significantly different to each other for that specific trait.
í í í í
/,&3 )'*.#.#0 .,--.)&,(. /,&3 )'*.#.#0 .,--.)&,(. /,&3 )'*.#.#0 .,--.)&,(.
! "
# $ % &
' ( ) *
+ , - .
/ 0 1 2
),&&#.-#4 &)!''
,)1.",. >ORJPP\HDU
@
)&3* /(#.3 >ORJXQLWSRO\S@
,)*!/&-#4 &)!5'
%&.&(-#.3 &)!!'
)&)(3-#4 &)!'
/,&3 )'*.#.#0 .,--.)&,(.
#(!,(!&#-" /,)",#( /,)"&)& 'DUOLQJHWDO
CHAPTER 2
A test of universal adaptive strategy theory in reef-building
corals
2.1 ABSTRACT
One of the major goals of ecology is to identify metrics of assemblage structure that are easy to obtain and that enable accurate predictions of how assemblages respond to
disturbance and environmental change. One recent approach, termed Universal Adaptive Strategy Theory (UAST) (Grime and Pierce 2012), has been hypothesised to apply to all creatures on the tree of life. However, previous attempts to classify
reef-building corals according to UAST have been inconclusive, because they have not chosen species traits according to the principles set out in the theory. Here, we test
whether UAST applies to reef-building corals using the principles of UAST and a comprehensive database of coral traits. The analyses suggest that reef-building coral species cluster into two groups on the basis of these traits rather than the three groups
predicted by UAST. Furthermore, both groups contain a mix of species with very different life history strategies. We conclude that UAST does not apply to corals
because the tropical marine environment is very different to most terrestrial environments. In addition, corals are both heterotrophic and autotrophic and therefore very different to most plants and animals
2.2 INTRODUCTION
Adaptive strategy theory states that the direction of natural selection is constrained
because it aims to limit the number of units required to describe assemblages. For example, the three adaptive groups proposed by the Universal Adaptive Strategy Theory (UAST) of Grime and Pierce (2012) should be more tractable than the 100s of species
that commonly make up tropical assemblages such as reef corals, as long as the group that a species belongs to is easy to determine. Adaptive strategy theory is also appealing
because aims to predict how taxa and assemblages respond to disturbance.
The concept of adaptive strategies was first presented by MacArthur and Wilson (1967) who suggested that species colonising islands displayed one of two broad
strategies based on the parameters of Lotka and Voltera’s predator-prey equations;
r-species that proliferate rapidly in an empty landscape and K-species that maintain
populations when resources are limited later in the colonization process. Adaptive strategy theory has since proceeded through many iterations, the most recent of which is the UAST of Grime and Pierce (2012) - a scheme the authors claim applies to all
organisms on the tree of life. UAST identifies three adaptive strategies (C-, S-, R-strategy): Competitive species have traits that maximise resource acquisition and control in consistently productive niches where the intensity of disturbance and stress are low; Stress-tolerant-species have traits that maintain metabolic performance in variable and unproductive niches where the intensity of disturbance is low but the
intensity of stress is high; and Ruderal species complete their life cycle or regenerate rapidly in productive niches where disturbance events are frequently lethal (Fig. 1.1,
Table 1.1). The distinction between stress and disturbance is an important aspect of UAST: stress is defined as “the sum of many agents that limit the quantity of living matter created per unit of space and time by constraining its production”; and
makes between stress and disturbance is less evident on coral reefs than in terrestrial environments, given that water is never limited and most reefs occur in oligotrophic waters where nutrients are by definition limited.
Adaptive strategy theory has been applied to reef-building corals in a number of studies, however the theory has generally not been applied correctly (discussed in detail
in Chapter 1). Darling et al. (2012) were the first to apply a quantitative trait based approach to identify adaptive strategy groups in reef-building corals. Darling et al. (2012) used 11 traits to classify 143 species into four groups that they named
competitive, weedy, stress-tolerant and generalists. Despite the quantitative approach, there are numerous problems with this work. In particular, Darling et al. (2012) is not a
legitimate test of Grime’s UAST as claimed because they did not choose traits following the principles of the theory i.e. traits should compete for the energy allocated towards acquisition of resources, maintenance of metabolism or regeneration (Grime
and Pierce 2012). Most of the traits used by Darling et al. (2012) including colony size, colony growth form, modularity, mode of larval development, depth range and
“symbiont richness” can not be expressed in a common currency to allow the trade-offs among traits for limited energetic resources to be explored. For example, there are a number of different ways for a coral to reach a large size: it can invest in rapid growth
to reach a large size quickly or it can invest in skeletal density in order to survive through periods of disturbance, such as cyclones. In addition, Darling et al. (2012) did
not specifically address how the traits of their groups relate to UAST. For example, their stress-tolerant species have traits normally associated with R-strategies, such as high fecundity, as well as traits normally associated with C-species, such as large
also fails because Darling et al. (2012) identified four groups rather than the three groups predicted by the theory.
Adaptive strategy theory has proved highly influential in plant and animal ecology,
however attempts to apply UAST to corals have been ill-conceived or poorly executed. The first aim of my thesis was therefore to test whether or not this scheme applies to
reef-building corals using appropriate traits as outlined by Grime and Pierce (2012).
2.3 MATERIAL AND METHODS
2.3.1Source of trait data
Trait data were sourced from coraltraits.org, a comprehensive database of coral life history traits (Madin et al. 2016a).
2.3.2Choice of traits
Traits for the analyses were chosen following the principles of UAST. Only traits directly related to the three primary functions of acquisition, maintenance and regeneration where used and only those traits that directly compete in a trade-off for
available energy (Grime and Pierce 2012). The choice of traits was also based on what was available at coraltraits.org. For example, some measure of tissue biomass as a
proxy for investment in maintenance would have been ideal, however there were insufficient data available for this trait or other similar traits.
The traits chosen for use in the analyses were 1) corallite width maximum, 2)
propagule size on release, 3) polyp fecundity, 4) skeletal density and 5) growth rate (Table 2.1). For the remainder of my thesis these traits will be referred to as corallite
For example, species that grow rapidly are generally considered good at acquiring space (Buddemeier and Kinzie 1976; Pratchett et al. 2015), which is often the limiting resource in sessile benthic invertebrate assemblages such as coral reefs. Species with
large corallites generally outcompete species with small corallites in competitive interactions involving digestion (Lang and Chornesky 1990). Species with large
corallites generally rely more on heterotrophic feeding as opposed to species with small corallites that tend to rely on energy derived from photosynthesis (Goreau et al. 1971). The capacity to feed heterotrophically has been linked to a greater ability to survive
periods of stress, such as those that induce coral bleaching (Grottoli et al. 2006).
Corallite size has also been suggested as a proxy for energy stored in the polyps (van
Woesik et al. 2012) and for environmental tolerance (Sommer et al. 2014). Skeletal density is generally seen as a proxy for investment in maintenance; species that invest heavily in a dense skeleton are more likely to survive common disturbances on the reef,
like bio-erosion (Highsmith 1981) and waves generated by storms (Hughes 1987).
Fecundity and propagule size are clearly related to investment in reproduction, or
regeneration to use the terminology of UAST. In summary, I propose growth rate as a potential indicator of energy invested in acquisition (i.e. competition), corallite size and
skeletal density as potential indicators of energy invested in maintenance (i.e. stress
tolerance), and fecundity and propagule size as indicators of investment in regeneration (i.e. reproduction).
A number of other traits, including the mode of larval development (brooders vs. spawners), sexuality (hermaphrodites vs. gonochores), colony morphology (various schemes), and colony size (the maximum colony size observed in a species) have also
difficult to see how these traits can be converted into a common currency by which to explore trade-offs in energy allocation with other traits. Secondly, many of these traits are ambiguous with respect to the trade-offs that have shaped them. As previously
discussed, there are many ways a colony can reach a large size (Chapter 1 and above). Similarly, colony growth form is best thought of as an interplay among traits and the
environment. Indeed, Jackson and Hughes (1985) propose that different colony morphologies represent adaptive strategy groups. Nonetheless, given the frequent reference to these additional four non-UAST-traits (i.e. mode of larval development,
sexuality, colony morphology, and colony size) in the adaptive strategy literature, I will explore how they vary among groups identified in the UAST analyses. Data for these
traits was sourced from coraltraits.org.
2.3.3Trait infilling
Coraltraits.org includes almost all the empirical data from the literature (Madin et al 2016a). However, for some traits, there is a paucity of data due to a lack of research.
For example, for skeletal density and propagule size, empirical data was only available for 54 and 67 species respectively. Therefore, in order to increase the number of species available for use in the analyses, a regression approach was used to fill in missing data
(i.e. trait infilling) following Madin et al. (2016b).
A species × trait matrix with only one value of trait for each species was first
completed using empirical data from coraltraits.org (Madin et al. 2016a). When a species had multiple empirical values for a given trait the average trait value was used as the global estimate for that species. For traits where I was interested in the maximum
order to help choose the variables used in each regression analysis. The decisions on which variables to use were also guided by previous work (eg Madin et al. 2016b) and expert opinion as outlined below. The variables used to infill each trait are summarised
in Table 2.1 and 2.2.
The trait infilling of growth rate included family and morphology as predictors
(Madin et al. 2016b). For colony morphology, I used the trait growth form typical at coraltraits.org, which includes nine morphologies modified from descriptions in Veron (2000): branching_closed, branching_open, columnar, corymbose, digitate, encrusting,
laminar, massive, and tabular (Table 2.2). Corallite size is generally highly conserved within taxonomic family and correlated with growth rate (Fig. 2.1). Skeletal density is
also likely to be phylogenetically conserved and previous work suggests that morphology is also important (Fig. 2.1, Table 2.1; Hughes 1987). Propagule size is generally conserved within genera and varies consistently between modes of larval
development (i.e. brooded larvae are generally larger than spawned larvae) (Baird et al. 2009). Empirical data were standardized to egg/planulae number per polyp, and log
transformed before the infilling process.
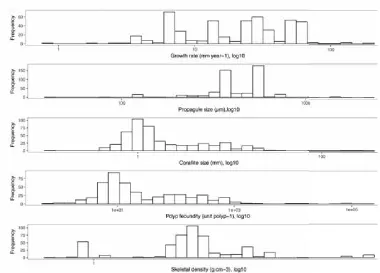
After infilling a species-trait matrix was available for 473 reef-building coral species. Summary statistics for the five in-filled traits are presented in Figure 2.2 and
Table 2.3. Data in the matrix were standardized within each species-trait because the units varied for each combination. All analyses were performed in R using the Predict
function (R Core Team 2016).
2.3.4Testing UAST
dissimilarity matrix was used to group the 473 species based on the five UAST traits. I used Ward’s hierarchical clustering because it tends to produce clusters of more equal size (Ward 1963). Euclidean distance matrix was used because it is the distance matrix
used in Principle Component Analysis (PCA), which was used to ordinate the species in trait space.
The optimal number of groups was determined by examining how the coefficient of determination (R2) of permutational multivariable analysis of variance (PERMANOVA) changed among the different clustering scenarios. I was looking for scenarios that
minimized within-cluster dissimilarity and between-cluster homogeneity, as described in Darling et al. (2012). The optimal number of clusters of the trait dendrogram was
estimated by looking at the elbow of the coefficient of determinations (R2) across different scenarios from 2 to 100 clusters. The optimal number of clusters is the number of clusters before a significantly drop of R2 across the 99 scenarios, the elbow. PERMANOVA was then used to test the hypothesis that there was significant variation among the number of clusters chosen. Principle component analysis (PCA) was then
used to explore the relationship between the groups and the UAST traits. Multivariable analyses were performed using the “vegan” (Oksanen et al. 2017) and “FD” (Laliberté et al. 2014) packages in R (R Core Team 2016). The average value of all UAST traits as
well as the continuous trait and maximum colony size, was determined for each group and differences tested using non-parametric Kruskal-Wallis rank test.
2.3.5A comparison of non-UAST traits among the groups
In addition, the relative abundance of traits with categorical values, such as colony
2.4 RESULTS
The analysis suggested that a two-group scenario best captured the differences among species in trait space (PERMANOVA, P = 0.001, Fig. 2.3, Table 2.4). In order to 1) describe the optimal grouping (i.e. two groups) and 2) to explore whether or not
the three-group scenario match the groups as predicted by UAST, I outline the characteristics of the two scenarios are below.
2.4.1Principle component analysis
Species were separated on the first principle component axis (PC1) by differences in growth rate, fecundity and corallite size and on PC2 by differences in skeletal density
(Fig. 2.4). The biplot indicates that corallite size and fecundity were highly correlated and negatively correlated with growth rate (Fig. 2.4). Skeletal density was negatively
correlated with propagule size (Fig. 2.4). The first two PCAs explained 78.42% of the variation among traits (Fig. 2.4).
2.4.2Cluster analysis
The first split separates species with high growth rates (Group 1) from those with
2.4.3Summary of groups in the two-and three group scenario including categorical
traits and taxonomy
Species in Group 1 are characterised by rapid growth, large propagules, small
corallites, low fecundity and moderately dense skeletons (Table 2.4, 2.5). Group 1 includes 295 species from 10 genera and three families (Table 2.5). Group 1 includes all
but one species of the family Acroporidae that were included in the analyses, a selection of closed-branching pocilloporids and all but one Porites spp. The group contains some species with each of the nine growth forms and a mix of brooders, spawners,
hermaphrodites and gonochores.
Species in Group 2 are characterised by slow growth, moderate sized propagules,
large corallites, high fecundity and dense skeletons (Table 2.4, 2.5). Group 2 includes 178 species from 26 genera and five families (Table 2.5). It includes all species from the family Merulinidae, all species from the genus Goniopora and all spawning
Pocillopora spp. The group contains some species with seven of the nine growth forms and a mix of brooders, spawners, hermaphrodites and gonochores.
Species in Group 3 are a small subset of Group 2 above with moderate growth rate, small propagules, small corallites, moderate fecundity and very dense skeletons (Table 2.5). All species in the group are broadcast spawning Pocillopora spp.
2.5 DISCUSSION
The best scenario suggested by the analyss is a scenario with two groups in contrast
to the three groups predicted by UAST. These two groups contain species with vastly different life histories and a mix of traits associated with different UAST groups. The
The two groups do not make good ecological sense because each group includes a mix of species with very different life-histories and traits associated with more than one UAST strategies (Table 1.4, 2.5). For example, Group 1 includes species with very
small colony sizes (eg Seriatopora spp.) and species with some of the largest colony size recorded (eg Porites spp.); it includes some of the longest lived species (eg Porites
spp.) and some of the shortest (eg Seriatopora spp.); it includes species that breed relatively early in life (eg Seriatopora hystrix) and species likely to delay maturity for many years (eg Porites spp.); it includes species that breed annually (Acropora spp. and
Montipora spp.) and those that breed frequently each year (S. hystrix and Pocillopora damicornis); it includes some of the fastest growing species (eg Acropora spp.) and
many slower growing species (eg Porites spp.); it include species that are typically among the worst affected by stress such as bleaching (eg Pocillopora damicornis,
Seriatopora hystrix) and many species considered relatively immune to bleaching (some
Montipora spp. and most Porites spp.); it include species that are typically among the worst affected by disturbances, in particular cyclones (eg Acropora spp.) and those
typically regarded as relatively immune to cyclones (massive species such as many
Porites spp.); it includes species that are palatable to a wide range of predators (eg
Acropora spp.) and those that are not palatable, at least to crown-of-thorns starfish (eg
Porites spp.). Group 2 is slightly more homogenous. The majority of the species are from the family Merulinidae and these share a number of traits including slow growth,
delayed reproductive maturity, relative immunity to stress and disturbance. However, it also includes a number of Pocillopora spp. which grow relatively rapidly and breed relatively early, as well as the solitary fungiids. The three-group scenario creates two
different life history strategies. Therefore, this three-group scenario does not match the groupings predicted by UAST.
There are a number of reasons why UAST might be difficult to apply to corals
(Chapter 1). For example, many coral reproductive traits are not that variable. For example, the frequency of reproduction does not vary much within the order. The vast
majority of reef-building species have annual gametogenetic cycles and therefore only breed once per year (Baird et al. 2009). Even in species that release brooded larvae on a monthly cycle it is not clear whether the individual polyps have multiple gametogenetic
cycles or breed out of synchrony (Baird et al. 2015). Similarly, there is no evidence that individuals can reproduce sexually in response to stress. There is also very little
variation in the age at first reproduction. Most corals breed within 2-5 years (Madin et al. 2016a) and there is no evidence for a long delay in any species. The clonal nature of corals also makes it very difficult to determine the age of individuals (Hughes and
Jackson 1980) in addition to numerous other forms of asexual reproduction including fragmentation (Fautin 2002). Similarly as discussed previously in Chapter 1 stress and
disturbance are difficult to distinguish on coral reefs.
2.6 CONCLUSIONS
The UAST approach does not appear to have produced homogenous groups that make ecological sense. Nonetheless, species within the two groups identified in the analyses might behave in a consistent and predictable way to stress and disturbance. In
Chapter 3 I explore this idea by using Darling et al.’s (2012) groups at the level of genus to test whether taxa and assemblages behave in a consistent and predictable way
Table 2.1 Traits used in the analyses. The description of traits is from Madin et al. (2016b). All traits are continuous.
Trait Abbreviation used
in text
Description Unit Factors used when infilling
Corallite width maximum Corallite size The maximum typical corallite width, axial corallite width or valley size
mm "Family", "Growth rate" Growth rate Growth rate The yearly extension for branching and
massive corals, or simple linear extension
mm year-1 "Family", "Growth form typical" Polyp fecundity Fecundity The number of eggs (oocytes) in a polyp units "Corallite width maximum", "Propagule
size on release"
Table 2.2 Traits used in the data infilling process. The description of traits is from Madin et al. (2016b).