Interactions and Formation of the A-Particle
Lindsey J. Organtini,aAlexander M. Makhov,bJames F. Conway,bSusan Hafenstein,aSteven D. Carsonc
Department of Medicine, The Pennsylvania State University College of Medicine, Hershey, Pennsylvania, USAa; Department of Structural Biology, University of Pittsburgh School of Medicine, Pittsburgh, Pennsylvania, USAb; Department of Pathology and Microbiology, University of Nebraska Medical Center, Omaha, Nebraska, USAc
ABSTRACT
The coxsackievirus and adenovirus receptor (CAR) has been identified as the cellular receptor for group B coxsackieviruses,
in-cluding serotype 3 (CVB3). CAR mediates infection by binding to CVB3 and catalyzing conformational changes in the virus that
result in formation of the altered, noninfectious A-particle. Kinetic analyses show that the apparent first-order rate constant for
the inactivation of CVB3 by soluble CAR (sCAR) at physiological temperatures varies nonlinearly with sCAR concentration.
Cryo-electron microscopy (cryo-EM) reconstruction of the CVB3-CAR complex resulted in a 9.0-Å resolution map that was
in-terpreted with the four available crystal structures of CAR, providing a consensus footprint for the receptor binding site. The
analysis of the cryo-EM structure identifies important virus-receptor interactions that are conserved across picornavirus species.
These conserved interactions map to variable antigenic sites or structurally conserved regions, suggesting a combination of
evo-lutionary mechanisms for receptor site preservation. The CAR-catalyzed A-particle structure was solved to a 6.6-Å resolution
and shows significant rearrangement of internal features and symmetric interactions with the RNA genome.
IMPORTANCE
This report presents new information about receptor use by picornaviruses and highlights the importance of attaining at least an
⬃
9-Å resolution for the interpretation of cryo-EM complex maps. The analysis of receptor binding elucidates two
complemen-tary mechanisms for preservation of the low-affinity (initial) interaction of the receptor and defines the kinetics of
receptor-cata-lyzed conformational change to the A-particle.
C
oxsackieviruses are causative agents of myocarditis,
meningi-tis, and pancreatitis and have also been implicated in the
de-velopment of type 1 diabetes (
1–4
). There are six group B
cox-sackievirus serotypes (CVB1 to -6) within the
Picornaviridae
family. These viruses are icosahedral, nonenveloped, and
approx-imately 300 Å in diameter, with a positive-sense single-stranded
RNA genome (
5
). The crystal structures of CVB3-M and
CVB3-RD strains are available in the Protein Data Bank (PDB)
(PDB identifiers [ID]
1COV
and
4GB3
) (
6
,
7
). The capsid has a
T
⫽
1 (pseudo T
⫽
3) icosahedral architecture, is composed of four
viral proteins (VP1 to -4), and has distinct topological features
that are important to the function of the virus (
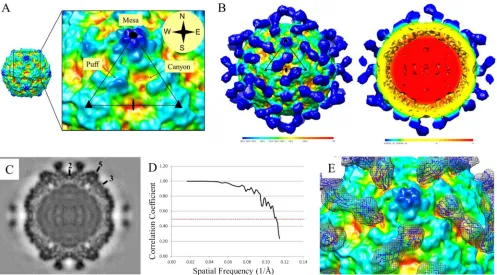
Fig. 1A
). Each
5-fold icosahedral symmetry axis is surrounded by a depression
called the canyon, where a known receptor binding site is located.
A hydrophobic pocket that contains a “pocket factor,” which is
likely a lipid moiety, lies directly beneath the floor of the canyon.
At the southern rim of the canyon, there is an elevated
hypervari-able region called the “puff” that is a known antigenic site (
5
,
8
).
Like other picornaviruses, CVB3 undergoes specific structural
changes as it proceeds through the virus life cycle; these changes
are critical for cellular entry and subsequent infection (
9
,
10
).
Initially, the virus must bind to a specific host receptor to gain
entry into the cell and begin the infection. Previous studies with
poliovirus (PV) and human rhinovirus (HRV) showed that there
are two distinct modes for virus binding to receptor: a
lower-affinity binding event that can be trapped at low temperatures and
a higher-affinity binding event that is fleeting and occurs near
physiological temperatures (
11–13
). In the picornavirus entry
model, receptor binds into the virus canyon, pocket factor is lost,
and the virus transitions to the altered particle, or A-particle (
14
,
15
). The A-particle is expanded compared to mature infectious
virus, has lost VP4, has exposed the N termini of VP1, and
typi-cally has lost the ability to bind the receptor (
16–18
).
Conse-quently, A-particle formed in solution has lost the ability to infect
cells efficiently even though it has not yet lost the RNA genome.
Previous studies have shown that mature infectious virus
experi-ences transient structural rearrangements that are characterized
by reversible partial exposure of VP4 and the N termini of VP1, a
dynamic phenomenon referred to as “viral breathing” (
19
,
20
).
The purpose of viral breathing is not yet known, but it may be
relevant to the high-affinity binding of the receptor (
12
,
21
).
Most picornaviruses use molecules in the immunoglobulin
su-perfamily (IgSF) as their cell entry receptors (
22–25
). All CVBs use
the coxsackievirus and adenovirus receptor (CAR) (
26
,
27
), a cell
adhesion molecule found in tight junctions (
28
). CAR is
com-prised of an extracellular domain folded into subdomains, D1 and
D2, a single membrane-spanning sequence, and a C-terminal
in-tracellular domain. Crystal structures for both human CAR D1
(PDB ID
1F5W
and
1KAC
) and murine CAR D1D2 (PDB ID
3MJ7
and
3JZ7
) have been reported (
29–32
).
Received30 January 2014 Accepted5 March 2014
Published ahead of print12 March 2014
Editor:K. Kirkegaard
Address correspondence to Susan Hafenstein, [email protected], or Steven D. Carson, [email protected].
Copyright © 2014, American Society for Microbiology. All Rights Reserved.
doi:10.1128/JVI.00299-14
on November 7, 2019 by guest
http://jvi.asm.org/
A 22-Å resolution cryo-electron microscopy (cryo-EM)
recon-struction of CVB3 complexed with CAR was previously
inter-preted with the CAR D1 structure (
23
). Here we present a 9.0-Å
resolution cryo-EM map of CVB3-CAR complex interpreted with
each of the four available crystal structures of CAR. This analysis
provides a consensus footprint of the receptor binding site onto
the virus. The receptor footprint maps to the puff region and the
northern rim of the canyon, largely overlapping with known
picornavirus antigenic epitopes. This mode of binding is
con-served across picornavirus species. When incubated at 37°C,
sol-uble CAR (sCAR) catalyzed virus inactivation with saturating
ki-netics, generating the CVB3 A-particle. The 6.6-Å cryo-EM map
of the A-particle shows global expansion, loss of CAR, and
exten-sive RNA reorganization.
MATERIALS AND METHODS
Virus growth and purification.CVB3 strain 28 (CVB3/28), used for the decay experiments, was passaged twice through HeLa cells after the initial transfection with the infectious cDNA plasmid (33) and isolated as de-scribed previously (34). The virus stock in 0.1 M NaCl was stored in aliquots at⫺80°C. Infectious CVB3/28 was quantitated as 50% tissue culture infectious doses (TCID50)/ml using RDt3 cells (a rhabdomyosar-coma cell line, RD CCL-136, that expresses coxsackievirus and adenovirus receptor [CAR] with a truncated cytoplasmic domain) (35).
For cryo-EM studies, CVB3/28 DNA was transfected into confluent HeLa cells using Lipofectamine 2000 (Invitrogen). The lysate was col-lected 36 to 48 h posttransfection and centrifuged. The supernatant was
used as first-passage stock to expand inoculum. Virus was propagated in HeLa cells and purified as previously described (36). Briefly, infected cells were frozen and thawed three times, pelleted through a sucrose cushion, and purified by tartrate step gradient ultracentrifugation. Virus was col-lected and transferred to storage buffer using an Amicon centrifugal con-centrator (Millipore) and four applications of 4 ml of 50 mM 2-(N -mor-pholino)ethanesulfonic acid (MES) buffer with 100 mM NaCl, pH 6.0. Virus concentration and quality were assessed by measuring absorbance at 260, 280, and 310 nm.
CAR production and purification.Soluble CAR (sCAR) was purified by immunoaffinity chromatography from medium conditioned by Raji cells transfected with pEF-ECAR (34). sCAR protein concentration was determined by bicinchoninic acid (BCA) assay and purity established by Coomassie-stained SDS-PAGE. These sCAR preparations have previously been shown to inhibit CVB3 infection of cell lines (34).
Cryo-EM reconstruction.CVB3/28 was incubated 1 h at 4°C with excess sCAR in a 1:180 ratio of virus capsid to receptor. An aliquot was applied to a Quantifoil grid and vitrified in a 50-50 mixture of propane and ethane. The remaining virus-receptor mixture was incubated for 30 min at 37°C prior to vitrification as described for the 4°C sample. Micro-graphs for the two independent data sets were recorded using a FEI Tecnai TF-20 FEG electron microscope operating at 200 kV on Kodak SO-163 film. Micrographs were digitized using a Super Coolscan 9000 with a scan step size of 6.35m/pixel to generate a final pixel size of 1.25 Å/pixel. For each cryo-EM reconstruction, particles were selected using the program EMAN2 and defocus values for the micrographs were measured using the program ctffind3 (37). A random model initiated the icosahedral recon-struction. An amplitude contrast factor of 7% was applied, and phases
FIG 1CVB3 and virus-CAR complex maps. (A) The close-up view of the asymmetric unit of CVB3 shows the topography of the virus surface, including the 5-fold mesa, canyon, and puff. The compass points are used to describe the details of the canyon and the canyon rim. (B) Surface-rendered cryo-EM recon-struction of CVB3-CAR complex formed at 4°C. The map is colored radially according to the key and displayed at a sigma value of 1. One asymmetric unit is outlined in black. The cutaway view shows the interior of the reconstruction with a fully packaged genome (red). (C) Central section of CVB3-CAR complex showing strong density for CAR and labeled 2-, 3-, and 5-fold symmetry axes. (D) Fourier shell correlation versus spatial frequency of the icosahedrally averaged reconstruction indicate resolution of the map where the Fourier shell correlation curve crosses the value of 0.5 (dashed red line). (E) The D1D2 CAR structure (blue) fitted into the difference density (blue mesh) is displayed onto a surface-rendered, radially colored CVB3 map to show CAR binding to the puff region and north canyon rim.
Organtini et al.
on November 7, 2019 by guest
http://jvi.asm.org/
[image:2.585.45.542.65.340.2]were flipped during data processing. The contrast transfer function (CTF) was fully corrected (38) during refinement. Final resolution was deter-mined with maps with full CTF correction where the Fourier shell corre-lation was 0.5. Statistics for the cryo-EM reconstructions are presented in Table 1.
The refined 9.0-Å CVB3-CAR complex reconstruction was mirrored across the x-y plane to “flip” the hand and generate a second map repre-senting the stereoisomer. A calculated map was generated from the CVB3 crystal structure (PDB ID1COV) (6) by mass weighting the atoms to simulate cryo-EM density and assigning a pixel size equal to 1 Å. Correct handedness was assessed by the quality of fit of the calculated map into the two cryo-EM density maps, by measuring correlation coefficients calcu-lated about mean data value (cc) using the Chimera protocol Fit in Map (39). With the correlation about mean option, the correlation can range from⫺1 to 1 as defined by Chimera. The absolute pixel size was deter-mined by the fit that provided the highest correlation in the map of correct handedness.
Difference map and structure fitting of the complex map.A differ-ence map was made by subtracting the density of the calculated map from that of the scaled cryo-EM map of CVB3/28 complexed with sCAR (38). The CAR crystal structures (structural similarity quantified by root mean square deviation [RMSD] of 0.5 Å for the structure of D1) were fitted separately into the difference density and refined (40) (PDB ID1F5W, 1KAC,3MJ7, and3JZ7) (29–32). The coordinates for each structure were superimposed to determine the similarity between structures after fitting, which raised the RMSD value between the structures to 1.2 Å (for D1). The crystal structure of CVB3 (PDB ID1COV) was placed into density corresponding to virus, and the fit was refined (6,40). Atoms that were ⱕ4.0 Å apart and had the correct geometry between the fitted crystal structures of CVB3 and CAR were identified as potential contacts (41). Buried surface was measured using the CCP4 program areaimol (41).
Sequence alignment.All sequences were aligned using CLUSTAL W (42). Sequence sources included the following (codes in parentheses are GenBank accession numbers unless otherwise specified): poliovirus (PDB ID2PLV), CVA21 (PDB ID1Z7Z), HRV14 (PDB ID1RUF), HRV16 (PDB ID1C8M), CVB1 (AFM77200,AFM77201, andAFM77204), CVB2 (AFM77213,AFM77210, andAFM77211), CVB3 (AFD33642,AAA42931, PDB ID1COVand4GB3, andAFM77189), CVB4 (AAB22446,ABF19105, and AAB33885), CVB5 (AFA28144,AEX07779, andAAW71476), and CVB6 (AAF12719andQ9QL88). For the IgSF receptors, the accession numbers are as follows: PVR,AAF69803.1; CAR,P78310.1; and ICAM,1403404A. Virus decay analysis.Virus decay was assessed as previously reported (34). Culture medium (high-glucose Dulbecco modified Eagle medium [DMEM], 10% fetal bovine serum, 0.9 mM glutamine, 90 U/ml of peni-cillin, 90g/ml of streptomycin, and 67g/ml gentamicin; all GIBCO
brand, Life Technologies, Carlsbad, CA) was equilibrated overnight in a 37°C incubator with 6% CO2and refrigerated (4°C) prior to addition of CVB3 and sCAR. The cooled medium was dispensed into sterile 1.5-ml tubes, and sCAR was added to give the final experimental concentration after addition of CVB3/28. Prior to placing the sample into the 37°C 6% CO2incubator, an aliquot was removed and placed into a chilled 1.5-ml tube and frozen at⫺80°C pending TCID50assay. Subsequent samples were taken at timed intervals, placed into chilled 1.5-ml tubes, and stored at⫺80°C until assayed for infectious virus. Total incubation time was limited to no more than 84 h.
TCID50analysis.For the TCID50assay, samples were thawed and kept chilled. The medium for sample dilution was cold (4°C), and 96-well plates were kept on chilled aluminum blocks while the samples were seri-ally diluted and until 20l from each dilution was placed into wells of a 96-well plate containing 100l of medium and RDt3 cells plated the previous day at 3,000 to 4,000 per well. The inoculated plates were placed into the 37°C, 6% CO2incubator, and the microscopic cytopathic effect (CPE) was tallied every 24 h for 72 h. The final tally was used to calculate the TCID50/ml. Data points with ln(Vt/V0) (see below) values greater than ⫺10 were used in the analyses. sCAR carryover into TCID50assays was apparent in the initial dilutions with high concentrations of sCAR but did not alter the TCID50values obtained with sCAR up to 1,000 nM and CVB3/28 atⱖ1.5⫻104TCID
50/ml. Each sample was evaluated twice, and the TCID50/ml results were averaged. Virus decay at each concentration of sCAR was analyzed on two separate occasions.
Kinetic analysis.First-order rate constants were determined by linear regression of the equation ln(Vt/V0) ⫽ ⫺k· t⫹b, where V0is the TCID50/ml at the time of first sampling,Vtis the TCID50/ml at subsequent time points,tis hours elapsed since the initial sample was taken, andkis the first-order rate constant (h⫺1). Slopes at each concentration of sCAR were averaged (weighted by the number of points in the data set); propa-gation of standard errors of regression was calculated per the work of P. R. Bevington (43). Nonzero values for the intercept,b, result from errors in determiningV0. For graphical presentation, data sets were corrected to the equation ln(Vt/V0)⫽ ⫺k·t.
Six experiments were done with no sCAR, two of which were pre-sented in the work of Carson et al. (34). The additional four experiments from this study were used to calculate the average and variance in the previous report. In experiments with sCAR present with the virus, starting concentrations of CVB3 ranged from 1.58⫻108to 1.23⫻109TCID
50/ml (except for one experiment at 2.76⫻106TCID
50/ml). The lowest ratios of sCAR to number of binding sites (60 per virion) were 14.3 and 47.6 in the experiments with sCAR at 1 nM. In all other experiments, [sCAR]/[bind-ing sites]⬎200. For the analyses, [sCAR]free⬃[sCAR]total.
The linear regression analyses of ln(Vt/V0) versus time were done with Pro-Stat v4.1 or PSI-Plot v8.1 for Windows (Poly Software International, Pearl River, NY). Nonlinear models were fit to the data using the Leven-berg-Marquardt algorithm, or Powell’s method, in PSI-Plot.
[image:3.585.38.286.77.135.2]Structure fitting of the A-particle map.The structure of the A-parti-cle of CVA16 (PDB ID4JGY) (44) was fitted into the cryo-EM density map of the CVB3 A-particle using the program Situs (40), treating the protomer as a rigid body and allowing each of the 60 symmetry-related protomers freedom during the fitting process. CVB3 (PDB ID4GB3) (7) was also fitted using the same protocol. The coordinates for the fitted
TABLE 1Cryo-EM statistics
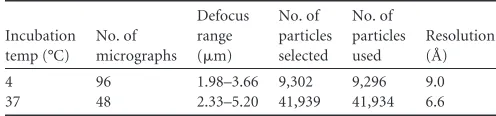
Incubation temp (°C) No. of micrographs Defocus range (m)
No. of particles selected No. of particles used Resolution (Å)
4 96 1.98–3.66 9,302 9,296 9.0
[image:3.585.37.544.646.705.2]37 48 2.33–5.20 41,939 41,934 6.6
TABLE 2Consensus CAR footprint onto virusa
a
The consensus footprint includes all identified contacts. Virus VP1 and VP2 contact residues were predicted by fitting four crystal structures of CAR, listed with single-letter identifiers and aligned to show agreement.
on November 7, 2019 by guest
http://jvi.asm.org/
CVA16 and CVB3 structures were superimposed and an RMSD was de-termined with Chimera (39).
Accession numbers.Cryo-EM maps for the CVB3-sCAR complex and the A-particle are deposited in the EM data bank (www.emdatabank .org/) under accession numbers EMD-5927 and EMD-5928. Fitted struc-tures of CAR PDB ID1F5W,1KAC,3MJ7, and3JZ7are deposited in the PDB under ID3J6L,3J6M,3J6O, and3J6N, respectively.
RESULTS
Virus-receptor complex cryo-EM map.
Cryo-electron
micros-copy (cryo-EM) and image analysis were used to reconstruct a
9.0-Å resolution density map of the CVB3-sCAR complex formed
at 4°C (
Fig. 1B
). The magnitude of the CAR density was nearly
equal to that of the capsid, indicating full occupancy of the
recep-tor binding sites. The virus capsid appeared unchanged, which
was verified when the crystal structure of CVB (PDB ID
1COV
)
was fitted into the corresponding density of the cryo-EM complex
map (
6
). The two human CAR D1 structures (PDB ID
1F5W
and
1KAC
) (
29
,
30
) and the two murine CAR D1D2 structures (PDB
ID
3MJ7
and
3JZ7
) (
31
,
32
) were fitted into the receptor density in
separate experiments (
40
). Each fitted structure was used to
inter-pret virus-receptor interactions, resulting in a consensus footprint
of receptor on the virus (
Table 2
). The predicted CAR interactions
mapped to the puff region of the virus (loop EF, VP2 residues 129
to 180) and to the north rim of the canyon (
Fig. 1
). However, there
were no interactions with the canyon floor, as a separation
be-tween sCAR and the canyon could be distinguished in the 9.0-Å
resolution map of the complex (
Fig. 1E
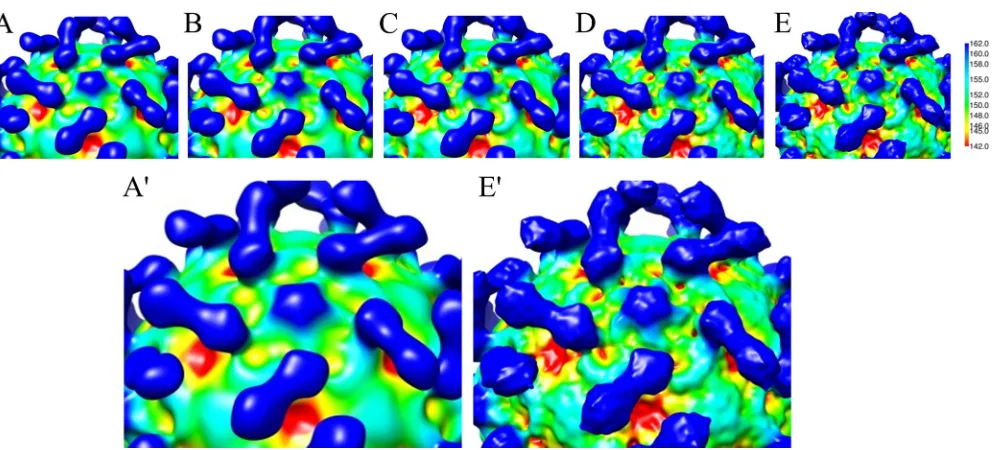
). The distinct separation
between receptor and CVB3 was not discernible at 22 Å (
Fig. 2
),
which was the resolution available in a previously reported map of
the complex (
23
).
Receptor footprint on the virus.
The capsid protein sequence
identity of group B coxsackieviruses is strongly conserved (88 to
100% sequence identity), and all CVBs use CAR as the receptor for
cell entry (
26
,
27
,
45
). The sequence of the VP2 protein, which
comprises the puff region, is somewhat less conserved among
CVBs, ranging from 63 to 100% identity. Members of the B group
of coxsackievirus were aligned to examine conservation of
[image:4.585.46.543.62.287.2]resi-FIG 2Complex reconstruction rendered at various resolutions. (A to E) Maps were limited to resolutions of 22, 18, 15, 10, and 9 Å, respectively. The zoomed-in view (A=and E=) shows that details of the capsid and receptor vary markedly with resolution of the map. With enhanced resolution, the line of demarcation between receptor and virus becomes clearer, structural details are defined, and the canyon appears unfilled.
TABLE 3Sequence conservation within the CVB3-CAR receptor footprinta
a
The virus residues identified to be interacting with CAR were aligned with other members of the B group of coxsackieviruses and with PV, CVA21, and HRV16 (see Materials and Methods). A dash indicates each residue conserved with the CVB3 identity, whereas divergent sequences are identified with the single-letter code.
Organtini et al.
on November 7, 2019 by guest
http://jvi.asm.org/
[image:4.585.38.551.583.707.2]dues identified in the CAR binding site (
Table 3
). Ten of the 20
contact residues are identical across the CVB group. Nine of
those residues are in VP1 and map to the north rim of the
canyon. This result suggests that residues at the north canyon
rim, many of which have been previously identified in
poliovi-rus (PV)-receptor binding studies (
46–48
), make a major
con-tribution to receptor binding (
Table 3
). The CAR contact
res-idues that map to the puff are variable across the B group of
coxsackieviruses and thus might be considered less likely to
affect CAR binding; however, an Asp at VP2 residue 139 is
conserved within the footprint across all the CVBs. VP2 residue
165, which is a known determinant for cardiovirulence and
thought to be involved in receptor recognition (
49
), is also
located within the puff portion of the CAR footprint.
The CAR footprint on CVB3 was compared to the IgSF
recep-tor footprints for PV (
50
), human rhinovirus (HRV) (
24
), and
coxsackievirus A21 (CVA21) (
25
) (
Fig. 3
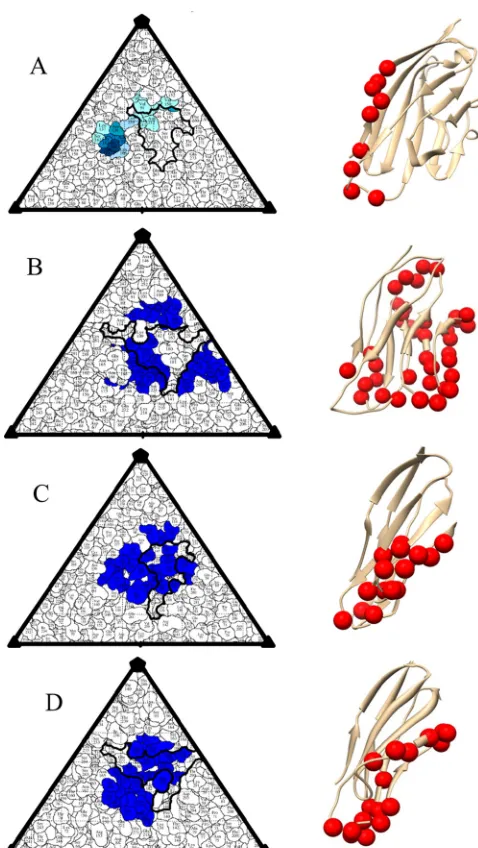
). Each of the four
recep-tors interacts with its respective virus at the puff and north rim of
the canyon; PV and HRV have additional receptor interactions
at the south canyon rim. The common interactions with residues
at the puff were unexpected because the puff is a region of high
sequence variability, even among serotypes, and a known
anti-genic site. To investigate further, known antianti-genic sites for
polio-virus (
51
,
52
,
53
,
54
) and rhinovirus (
55
) were mapped on the
aligned virus sequences (
Fig. 4
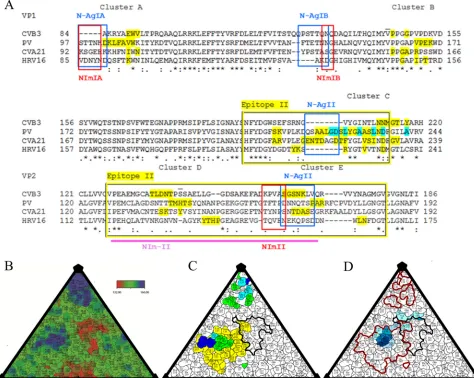
), identifying distinct clusters of
receptor binding residues, three in VP1 and two in VP2 (
Fig. 4A
).
Each of these clusters overlaps with a known antigenic epitope,
except for cluster B, which consists of a group of conserved
resi-dues located at the north rim of the canyon (
Fig. 4
). Across the
four virus species, there is conservation among the north canyon
rim residues within the receptor binding footprints. HRV16 and
CVA21 share more sequence-equivalent amino acids with CVB3
within the receptor footprint region than are found overall within
the VP1 proteins or the VP2 puff regions (
Tables 3
and
4
). PV does
not share this trait of increased amino acid conservation within
the footprints; however, cluster C includes residues believed to be
critical for PV to bind its receptor (
Fig. 4
) (
46
).
The virus footprint on the receptor.
A consensus footprint
was also identified for the CVB3 interaction with the CAR protein.
The nine CAR amino acids predicted to interact with the virus
capsid map to the N-terminal region of CAR (
Table 5
;
Fig. 3A
).
Receptor residues identified as critical for HRV binding map to
the N-terminal region of ICAM-1 (
57
); however, these two
can-yon binding receptors appear to interact differently with their
re-spective viruses (
Fig. 3
). Although the IgSF members share
struc-tural similarities (
Fig. 3
), they have low sequence identity (11 to
13%). Overall, there is more variation among the virus footprints
on each respective receptor than is found in the receptor
foot-prints on each virus (
Fig. 3
).
Kinetic analysis.
Picornavirus binding to IgSF receptors
me-diates conversion to A-particles (
15–17
). The conversion of CVB3
to inactive particles (A-particles), with or without receptor,
pro-ceeded at 37°C with first-order kinetics (
Fig. 5A
to
I
) as described
by equation 1:
dV
⁄
dt
⫽ ⫺
k
1·
V
t⫺
k
2· [
V
R· sCAR] ·
V
t(1)
where
V
tis total concentration of infectious virus at time,
t
,
[
V
R· sCAR] represents the proportion of receptor binding sites
occupied,
k
1is the first-order rate constant without receptor, and
k
2is the maximum achievable rate catalyzed by soluble
mono-meric receptor. In this equation, spontaneous decay and
receptor-mediated decay can be concurrent (i.e., parallel reactions for
which binding receptor does not prevent decay via the mechanism
associated with
k
1). The observed rate constant is as follows:
k
app⫽
k
1⫹
k
2· [sCAR] ⁄ ([sCAR]
⫹
K
)
(2)
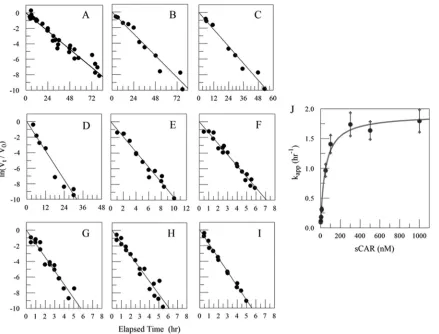
The hyperbolic relationship between k
appand [sCAR] (
Fig. 5J
)
is described by equation 2, where
k
1⫽
0.10
⫾
0.01 h
⫺1(mean
⫾
standard deviation),
k
2⫽
1.81
⫾
0.07 h
⫺1, and
K
⫽
50.4
⫾
8.9 nM
(
k
2and
K
are regression parameters
⫾
standard error). The same
hyperbola is also described by a model in which the
k
1and
k
2FIG 3Comparison of virus-receptor contacts. Road maps of the virus surface are represented as a quilt of amino acids, shown as a projection with the icosahedral asymmetric unit indicated by the triangular boundary (71). For each virus—CVB3 (A), PV (B), HRV16 (C), and CVA21 (D)—the canyon is outlined in black; the receptor footprint is displayed in blue. The corresponding IgSF receptor is shown at the right, with virus contacts as red spheres. The footprints of receptor onto virus are as follows: CAR on CVB3 (A), PVR on PV (50) (B), ICAM on HVR16 (24) (C), and ICAM on CVA21 (25) (D).
on November 7, 2019 by guest
http://jvi.asm.org/
[image:5.585.299.538.63.487.2]mechanisms are mutually exclusive, with a
k
2of 1.90
⫾
0.07 h
⫺1.
Use of [sCAR]
ain equation 2 results in a marginally improved fit
(F test,
P
⬍
0.05; using Powell’s method,
k
2⫽
1.69 h
⫺1,
K
⫽
0.06
⫻
10
⫺9, and
a
⫽
1.39). Values of the empirical exponent,
a
,
greater than 1 suggest positive cooperativity. Of these
mathemat-ical solutions, equation 2 is the simplest, and parallel reactions
have been assumed in analyses of PV-receptor binding (
12
).
Con-sidering the solutions for all three mathematical models,
k
2ranges
from 1.69 to 1.90 h
⫺1, so the maximum sCAR-catalyzed rate is 17
to 19 times higher than the spontaneous rate of virus inactivation
at 37°C. The comparable
k
1for poliovirus was reported as 0.5 h
⫺1,
and with 245 nM soluble poliovirus receptor, the
k
appwas 15.8 h
⫺1 [image:6.585.52.526.69.447.2](
58
,
59
). The half-maximal effect of sCAR on
k
appwas observed at
TABLE 4Percent sequence similarity between the viral capsid proteins of CVB3 and PV, HRV16, and CVA21a
Virus
% Sequence similarity to region in CVB3
VP1
VP1 residues in contact with
receptorb VP2
VP2 residues in the puff regionc
VP2 residues in contact with receptor
PV 44 36 55 14 13
CVA21 39 73 56 18 25
HRV16 37 64 52 8 25
aSequence from the three different poliovirus serotypes (PDB ID2PLV,3EPC, and 3EPF) were also aligned. There are no differences in amino acid identity within the re-ceptor footprint. PDB ID for the viruses listed in the table are as follows:2PLV,1C8M, and1Z7Zfor PV, HRV16, and CVA21, respectively.
bThe VP1 canyon north rim consists of VP1 residues equivalent to CVB3 VP1 residues
89 to 91, 140 to 155, and 211 to 217.
cThe puff consists of VP2 residues equivalent to CVB3 VP2 residues 129 to 180.
FIG 4Conservation of IgSF footprints and the overlap with known antigenic sites. (A) PV, CVA21, CVB3, HRV14, and HRV16 sequences were aligned (CLUSTAL W). Equivalent residues corresponding to antigenic epitopes were plotted as follows: poliovirus epitope II (yellow boxes) and NIm-II (pink line) (52); N-AgIA, N-AgIB, and N-AgII (blue boxes) (51,53,54); and NImIA, NImIB, and NImII (red boxes) (55). Residues interacting with the respective IgSF receptor are highlighted in yellow (24, 25,50). Neutralization escape mutations critical to PVR binding are highlighted in cyan (46). The two overscores identify the sites of suppressing mutations that restore PVR binding to mutant PV (47). Clusters A to C map to the north canyon rim, an important PVR binding region (48). The aligned HRV14 sequence used to map the antigenic sites was removed for ease of viewing. (B to D) Road maps are shown as a surface projection with the canyon outlined (black) (71). (B) The CVB3 surface is displayed by radial height; color key indicates the lowest (red) to highest (blue) surface features. (C) Sequence-equivalent residues that comprise the antigenic epitopes are mapped onto an asymmetric unit of CVB3 with those originating from the PV and HRV antigenic sites shown in green and blue, respectively. Residues described in both N-Ag and NIm epitopes are colored cyan, with epitope II as yellow. (D) The CVB3 CAR footprint with the antigenic epitopes outlined in red defines the overlap between receptor binding and antigenicity. The CAR footprint is displayed in shades of blue representing the consensus of fitting the four different structures of CAR, from dark blue for all four in agreement to light blue for one contact (seeTable 2).
Organtini et al.
on November 7, 2019 by guest
http://jvi.asm.org/
50.4 nM, which is lower than either of the
K
d(dissociation
con-stant) values measured for poliovirus binding its receptor or the
K
dreported for monomeric CAR binding to CVB3 (
12
,
14
).
The A-particle.
Although heating native picornavirus has been
[image:7.585.82.513.76.161.2]an acceptable surrogate for receptor binding to produce the
A-particle (
9
,
60
,
61
), for this structural study, mature CVB3 was
incubated with excess sCAR at 37°C to produce the
receptor-cat-alyzed A-particle. Global structural changes occurred during the
TABLE 5Consensus virus footprint onto CARa
aRed font indicates residues that are disordered in the atomic structure. The structure of 1F5W was truncated (blue font) so that the N terminus was
equivalent in length to that of sCAR. The yellow highlighted residues were identified from fitted CAR atoms no more than 4 Å from the fitted virus structure that had the proper geometry to be considered potential contacts. Red boxes outline the region of CAR that interacts with the virus puff and north canyon rim. The lower correlation coefficients (cc) for the D1-only structures were likely due to the lack of filled D2 density in the CAR difference density map. The four independently fitted CAR structures superimposed with an RMSD of 1.2. The X-ray structures used are from the two human D1 structures, PDB ID1F5W(29) and1KAC(30), and two murine D1D2 structures, PDB ID3MJ7(31) and3JZ7(32). Murine and human CARs share 90% sequence identity.
FIG 5sCAR catalysis of CVB3 inactivation. Loss of infectious CVB3 with time at 37°C is first order in the absence of sCAR (slope⫽ ⫺0.10⫾0.01 h⫺1) (A) and
remains first order in the presence of sCAR from 1 nM (slope⫽ ⫺0.12⫾0.01 h⫺1) (B) to 1,000 nM (slope⫽ ⫺1.80⫾0.19 h⫺1) (I). Other concentrations of
sCAR were 4.7 and 5 nM (slope⫽ ⫺0.18⫾0.02 h⫺1) (C), 10 nM (slope⫽ ⫺0.31⫾0.04 h⫺1) (D), 50 nM (slope⫽ ⫺0.97⫾0.10 h⫺1) (E), 100 nM (slope⫽
⫺1.41⫾0.15 h⫺1) (F), 300 nM (slope⫽ ⫺1.74⫾0.19 h⫺1) (G), and 500 nM (slope⫽ ⫺1.64⫾0.15 h⫺1) (H).V
0is the concentration of infectious virus
determined as TCID50/ml at the start of the 37°C incubation, andVtis the concentration of infectious virus determined as TCID50/ml at each time sampled during
the experiment. The observed first-order rate constant (kapp) varies with the concentration of sCAR (J) and can be described by the equationkapp⫽k1⫹k2·
[sCAR]/([sCAR]⫹K), wherek1is the rate constant in the absence of sCAR.
on November 7, 2019 by guest
http://jvi.asm.org/
[image:7.585.78.517.322.656.2]transition to A-particle that resulted in the loss of CAR binding.
The radial capsid expansion of
⬃
5 Å was comparable to what has
been reported for enterovirus 71 (EV71) (
61
), PV (
62
,
63
), and
HRV (
21
,
56
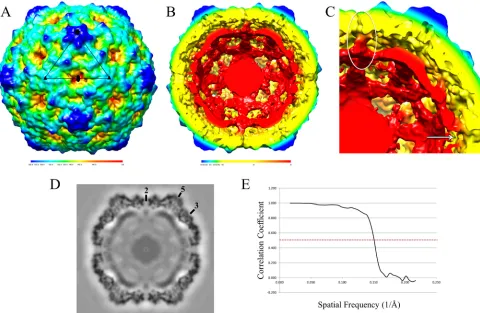
). Notable structural changes include the formation
of large open pores at each 2-fold axis of symmetry, a restructuring
of the packaged RNA, and columns of density connecting the
genomic RNA to the expanded capsid shell (
Fig. 6
). Similar
den-sity columns were reported for the EV71 A-particle structure that
was formed by heat treatment (
61
). In the EV71 A-particle, the
density columns were shown to contain the N terminus of VP1
(
Fig. 6B
and
C
). This location for VP1 was also found in a recent
crystal structure of the A-particle of CVA16 (
44
). Thus, the
A-par-ticle formed by incubation of CVB3 with sCAR shares the
impor-tant features known from studies of A-particles generated by
heat-ing other picornaviruses.
The crystal structure of the CVA16 A-particle (PDB ID
4JGY
)
(
44
) (which shares 42% sequence identity with CVB3) fitted into
our CVB3 A-particle cryo-EM density map with a correlation
co-efficient (cc) of 0.86. Since the protomer has been shown to move
as a rigid body between expanded and nonexpanded forms of
EV71 (
64
), the structure of CVB3 (PDB ID
4GB3
) (
7
) was also
fitted into the A-particle, resulting in a cc of 0.82. The experiment
revealed that the 2-fold pore of the CVB3 A-particle is 20 by 31 Å
in dimension, making it the largest in comparison to CVA16 and
EV71 (
44
,
61
). Current models propose that one of the open pores
at the 2-fold axes may be selected for formation of a unique portal
for release of RNA (
60
,
61
,
64
,
66
). CVB3 residues in the CAR
binding footprint (VP2 residues 136 to 140) align with CVA16
residues within a disordered loop (VP2 residues 137 to 141) (
44
).
This suggests that the conformational changes that occur to form
the A-particle may induce flexibility that precludes receptor
bind-ing. Furthermore, the location of the emerging VP1 N terminus of
the fitted CVA16 A-particle crystal structure maps beneath the
CAR binding site, suggesting that loss of CAR binding is
coinci-dent with egress of VP1.
DISCUSSION
The three-dimensional structures and kinetics of the
receptor-catalyzed conversion are consistent with a model that involves
capsid breathing, a receptor-stabilized transition state, and
con-formational changes that occur on the path to genome delivery to
the host. Icosahedral viruses are dynamic, with various vibrational
modes; transition between antigenically distinct closed and open
states of the capsid during a picornavirus breathing cycle has been
documented both directly and indirectly (
19
,
20
,
67
,
68
). The open
capsid conformation that occurs during the virus breathing cycle
is reversible and exposes segments of VP1 and VP4 that are
inter-nalized in the closed state of the capsid. Only the open-state capsid
FIG 6CAR-catalyzed CVB3 A-particle. (A) CVB3 A-particle is shown surface rendered and colored according to radial height (key beneath map). An asymmetric unit is outlined in black. (B) Cutaway view of the A-particle showing capsid separation from genomic RNA and structural changes that result from the 5% expansion of the capsid. (C) Close-up showing the columns of density connecting the RNA core to the capsid shell (white oval) and the open pores that formed at the 2-fold axes (white arrow). (D) Central section of CAR transitioned A-particle of CVB3 with symmetry axes labeled. (E) Fourier shell correlation versus spatial frequency of the icosahedrally averaged reconstruction. Resolution of the reconstruction is assessed where the Fourier shell correlation curve crosses the value of 0.5 (dotted red line).
Organtini et al.
on November 7, 2019 by guest
http://jvi.asm.org/
[image:8.585.46.526.67.380.2]is capable of binding the receptor with high affinity; therefore, the
CVB3 open capsid is structurally distinct from the A-particle,
which is incapable of high-affinity (or low-affinity) receptor
binding.
According to the working model, when CVB3 encounters an
appropriate CAR-expressing host cell, virus in the closed
confor-mational state can bind to CAR via the low-affinity binding site,
and it is this closed-conformation capsid bound to sCAR that has
been visualized (
Fig. 1
). The open conformation can occur in the
absence of the receptor (
20
), and the open and closed states exist in
a temperature-dependent equilibrium. It is unlikely that the
low-affinity interaction of sCAR with the virus in closed conformation
induces the open conformation. However, this low-affinity
inter-action may allow the virus to acquire the receptor in proximity to
the transient high-affinity site (presumably within the canyon)
that becomes available in the open conformation. CAR
occupa-tion of the high-affinity binding site likely increases the energy
required to return to the closed conformation relative to that
re-quired for conversion to the A-particle. Poliovirus receptor
low-ered the activation energy for virion conversion, whereas ICAM-1
was found to accelerate the decay of HRV without altering the
activation energy (
56
,
58
).
For polymers with multiple ligand binding sites that have
con-formation-dependent affinities, the presence of ligand can shift
the equilibrium toward the high-affinity conformation, often with
cooperativity (
65
). In the current model, the CVB3 open state is an
intermediate between the closed capsid conformation and the
A-particle. If this model is correct, the apparent first-order rate
con-stant,
k
1⫹
k
2· [
R/
(
R
⫹
K
)] (equation 2;
Fig. 5
), changes with sCAR
concentration because the receptor shifts the open-closed
equilib-rium toward the receptor-bound open intermediate. Since it is
presumably the receptor-bound open intermediate that decays to
A-particle, the conversion rate will be
k
· [open state], determined
as (
k
1⫹
k
2· [
R/
(
R
⫹
K
)]) ·
V
t. The
k
appapproaches its maximum
value as the equilibrium is pulled toward the maximum
concen-tration of capsids in the open receptor-bound conformation.
With this interpretation,
K
in equation 2 then does not represent
the
K
dbut should correspond to the concentration of sCAR at
which open and closed capsid conformations are present in equal
concentrations.
The receptor binding site available at low temperature is
con-served within variable regions that are exposed on the virus
sur-face, as has been described for foot-and-mouth disease virus (
69
).
Use of the highly conserved north canyon rim residues is
consis-tent with the canyon hypothesis that states viruses may preserve
receptor binding in areas hidden from immune surveillance (
70
).
The inaccessibility of the high-affinity binding site on the closed
form of the virus indicates that this site is well hidden, perhaps
deep in the canyon. The formation of the high-affinity binding site
appears to be contingent on the conformational changes that take
place when the capsid assumes the open conformation. The
mech-anisms to preserve receptor binding are conserved across species
and suggest that a picornavirus takes advantage of multiple
mech-anisms for conserving two binding sites for the same receptor.
ACKNOWLEDGMENTS
This project is funded, in part, under a grant with the Pennsylvania De-partment of Health using Tobacco CURE Funds. The work was supported by NIH K22 grant A179271 (S.H.) and The Edna Ittner Foundation for Pediatric Research (S.D.C.).
The Pennsylvania Department of Health specifically disclaims respon-sibility for any analyses, interpretations, or conclusions.
L.J.O. and S.D.C. performed research, A.M.M. and J.F.C. collected cryo-EM data, L.J.O. and S.H. processed and analyzed cryo-EM data, S.D.C. processed and analyzed kinetic data, and L.J.O., S.D.C., and S.H. wrote the paper.
REFERENCES
1.Coppieters KT, Wiberg A, von Herrath MG.2012. Viral infections and molecular mimicry in type 1 diabetes. APMIS120:941–949.http://dx.doi .org/10.1111/apm.12011.
2.Moore M, Kaplan MH, McPhee J, Bregman DJ, Klein SW. 1984. Epidemiologic, clinical, and laboratory features of Coxsackie B1-B5 infec-tions in the United States, 1970 –79. Public Health Rep.99:515–522. 3.Tam PE.2006. Coxsackievirus myocarditis: interplay between virus and
host in the pathogenesis of heart disease. Viral Immunol.19:133–146. http://dx.doi.org/10.1089/vim.2006.19.133.
4.Tracy S, Drescher KM.2007. Coxsackievirus infections and NOD mice: relevant models of protection from, and induction of, type 1 diabetes. Ann. N. Y. Acad. Sci.1103:143–151. http://dx.doi.org/10.1196/annals .1394.009.
5.Rossmann MG, Arnold E, Erickson JW, Frankenberger EA, Griffith JP, Hecht HJ, Johnson JE, Kamer G, Luo M, Mosser AG, Rueckert RR, Sherry B, Vriend G.1985. Structure of a human common cold virus and functional relationship to other picornaviruses. Nature 317:145–153. http://dx.doi.org/10.1038/317145a0.
6.Muckelbauer JK, Kremer M, Minor I, Diana G, Dutko FJ, Groarke J, Pevear DC, Rossmann MG.1995. The structure of coxsackievirus B3 at 3.5 Å resolution. Structure3:653– 667.http://dx.doi.org/10.1016/S0969 -2126(01)00201-5.
7.Yoder JD, Cifuente JO, Pan J, Bergelson JM, Hafenstein S.2012. The crystal structure of a coxsackievirus B3-RD variant and a refined 9-ang-strom cryo-electron microscopy reconstruction of the virus complexed with decay accelerating factor (DAF) provide a new footprint of DAF on the virus surface. J. Virol.86:12571–12581.http://dx.doi.org/10.1128/JVI .01592-12.
8.Hogle JM, Chow M, Filman DJ.1985. Three-dimensional structure of poliovirus at 2.9 Å resolution. Science229:1358 –1365.http://dx.doi.org /10.1126/science.2994218.
9.Curry S, Chow M, Hogle JM. 1996. The poliovirus 135S particle is infectious. J. Virol.70:7125–7131.
10. Dove AW, Racaniello VR.1997. Cold-adapted poliovirus mutants bypass a postentry replication block. J. Virol.71:4728 – 4735.
11. Casasnovas JM, Springer TA.1995. Kinetics and thermodynamics of virus binding to receptor. Studies with rhinovirus, intercellular adhesion molecule-1 (ICAM-1), and surface plasmon resonance. J. Biol. Chem.
270:13216 –13224.
12. McDermott BM, Jr, Rux AH, Eisenberg RJ, Cohen GH, Racaniello VR.2000. Two distinct binding affinities of poliovirus for its cellular receptor. J. Biol. Chem.275:23089 –23096.http://dx.doi.org/10.1074/ jbc.M002146200.
13. Xing L, Tjarnlund K, Lindqvist B, Kaplan GG, Feigelstock D, Cheng RH, Casasnovas JM.2000. Distinct cellular receptor interactions in po-liovirus and rhinoviruses. EMBO J.19:1207–1216.http://dx.doi.org/10 .1093/emboj/19.6.1207.
14. Goodfellow I, Evans DJ, Blow DM, Kerrigan D, Miners JS, Morgan BP, Spiller OB.2005. Inhibition of coxsackie B virus infection by soluble forms of its receptors: binding affinities, altered particle formation, and competition with cellular receptors. J. Virol.79:12016 –12024.http://dx .doi.org/10.1128/JVI.79.18.12016-12024.2005.
15. Milstone AM, Petrella J, Sanchez MD, Mahmud M, Whitbeck JC, Bergelson JM.2005. Interaction with coxsackievirus and adenovirus re-ceptor, but not with decay-accelerating factor (DAF), induces A-particle formation in a DAF-binding coxsackievirus B3 isolate. J. Virol.79:655– 660.http://dx.doi.org/10.1128/JVI.79.1.655-660.2005.
16. Crowell RL, Philipson L.1971. Specific alterations of coxsackievirus B3 eluted from HeLa cells. J. Virol.8:509 –515.
17. De Sena J, Mandel B.1977. Studies on the in vitro uncoating of poliovi-rus. II. Characteristics of the membrane-modified particle. Virology78:
554 –566.
18. Fricks CE, Hogle JM. 1990. Cell-induced conformational change in
on November 7, 2019 by guest
http://jvi.asm.org/
poliovirus: externalization of the amino terminus of VP1 is responsible for liposome binding. J. Virol.64:1934 –1945.
19. Lewis JK, Bothner B, Smith TJ, Siuzdak G.1998. Antiviral agent blocks breathing of the common cold virus. Proc. Natl. Acad. Sci. U. S. A.95:
6774 – 6778.http://dx.doi.org/10.1073/pnas.95.12.6774.
20. Li Q, Yafal AG, Lee YM, Hogle J, Chow M.1994. Poliovirus neutraliza-tion by antibodies to internal epitopes of VP4 and VP1 results from re-versible exposure of these sequences at physiological temperature. J. Virol.
68:3965–3970.
21. Xing L, Casasnovas JM, Cheng RH.2003. Structural analysis of human rhinovirus complexed with ICAM-1 reveals the dynamics of receptor-mediated virus uncoating. J. Virol.77:6101– 6107.http://dx.doi.org/10 .1128/JVI.77.11.6101-6107.2003.
22. Belnap DM, McDermott BM, Jr, Filman DJ, Cheng N, Trus BL, Zuccola HJ, Racaniello VR, Hogle JM, Steven AC. 2000. Three-dimensional structure of poliovirus receptor bound to poliovirus. Proc. Natl. Acad. Sci. U. S. A.97:73–78.http://dx.doi.org/10.1073/pnas.97.1.73.
23. He Y, Chipman PR, Howitt J, Bator CM, Whitt MA, Baker TS, Kuhn RJ, Anderson CW, Freimuth P, Rossmann MG.2001. Interaction of coxsackievirus B3 with the full-length coxsackievirus-adenovirus recep-tor. Nat. Struct. Biol.8:874 – 878.http://dx.doi.org/10.1038/nsb1001-874. 24. Kolatkar PR, Bella J, Olson NH, Bator CM, Baker TS, Rossmann MG.
1999. Structural studies of two rhinovirus serotypes complexed with frag-ments of their cellular receptor. EMBO J.18:6249 – 6259.http://dx.doi.org /10.1093/emboj/18.22.6249.
25. Xiao C, Bator-Kelly CM, Rieder E, Chipman PR, Craig A, Kuhn RJ, Wimmer E, Rossmann MG.2005. The crystal structure of coxsackievirus A21 and its interaction with ICAM-1. Structure13:1019 –1033.http://dx .doi.org/10.1016/j.str.2005.04.011.
26. Bergelson JM, Cunningham JA, Droguett G, Kurt-Jones EA, Krithivas AJ, Hong JS, Horwitz MS, Crowell RL, Finberg RW.1997. Isolation of a common receptor for coxsackie B viruses and adenoviruses 2 and 5. Science
275:1320 –1323.http://dx.doi.org/10.1126/science.275.5304.1320. 27. Martino TA, Petric M, Weingartl H, Bergelson JM, Opavsky MA,
Richardson CD, Modlin JF, Finberg RW, Kain KC, Willis N, Gauntt CJ, Liu PP.2000. The coxsackie-adenovirus receptor (CAR) is used by refer-ence strains and clinical isolates representing all six serotypes of coxsacki-evirus group B and by swine vesicular disease virus. Virology271:99 –108. http://dx.doi.org/10.1006/viro.2000.0324.
28. Cohen CJ, Shieh JTC, Pickles RJ, Okegawa T, Hsieh J-T, Bergelson JM.
2001. The coxsackievirus and adenovirus receptor is a transmembrane component of the tight junction. Proc. Natl. Acad. Sci. U. S. A.98:15191– 15196.
29. van Raaij MJ, Chouin E, van der Zandt H, Bergelson JM, Cusack S.
2000. Dimeric structure of the coxsackievirus and adenovirus receptor D1 domain at 1.7 A resolution. Structure8:1147–1155.http://dx.doi.org/10 .1016/S0969-2126(00)00528-1.
30. Bewley MC, Springer K, Zhang YB, Freimuth P, Flanagan JM.1999. Structural analysis of the mechanism of adenovirus binding to its human cellular receptor, CAR. Science286:1579 –1583.http://dx.doi.org/10.1126 /science.286.5444.1579.
31. Verdino P, Witherden DA, Havran WL, Wilson IA.2010. The mo-lecular interaction of CAR and JAML recruits the central cell signal transducer PI3K. Science 329:1210 –1214. http://dx.doi.org/10.1126 /science.1187996.
32. Patzke C, Max KE, Behlke J, Schreiber J, Schmidt H, Dorner AA, Kroger S, Henning M, Otto A, Heinemann U, Rathjen FG.2010. The coxsackievirus-adenovirus receptor reveals complex homophilic and het-erophilic interactions on neural cells. J. Neurosci.30:2897–2910.http://dx .doi.org/10.1523/JNEUROSCI.5725-09.2010.
33. Tu Z, Chapman NM, Hufnagel G, Tracy S, Romero JR, Barry WH, Zhao L, Currey K, Shapiro B.1995. The cardiovirulent phenotype of coxsackievirus B3 is determined at a single site in the genomic 5= nontrans-lated region. J. Virol.69:4607– 4618.
34. Carson SD, Chapman NM, Hafenstein S, Tracy S.2011. Variations of coxsackievirus B3 capsid primary structure, ligands, and stability are se-lected for in a coxsackievirus and adenovirus receptor-limited environ-ment. J. Virol.85:3306 –3314.http://dx.doi.org/10.1128/JVI.01827-10. 35. Cunningham KA, Chapman NM, Carson SD.2003. Caspase-3 activation
and ERK phosphorylation during CVB3 infection of cells: influence of the coxsackievirus and adenovirus receptor and engineered variants. Virus Res.92:179 –186.http://dx.doi.org/10.1016/S0168-1702(03)00044-3. 36. Hafenstein S, Bowman VD, Chipman PR, Bator Kelly CM, Lin F,
Medof ME, Rossmann MG.2007. Interaction of decay-accelerating fac-tor with coxsackievirus B3. J. Virol.81:12927–12935.http://dx.doi.org/10 .1128/JVI.00931-07.
37. Mindell JA, Grigorieff N.2003. Accurate determination of local defocus and specimen tilt in electron microscopy. J. Struct. Biol.142:334 –347. http://dx.doi.org/10.1016/S1047-8477(03)00069-8.
38. Yan X, Sinkovits RS, Baker TS.2007. AUTO3DEM—an automated and high throughput program for image reconstruction of icosahedral parti-cles. J. Struct. Biol. 157:73– 82. http://dx.doi.org/10.1016/j.jsb.2006.08 .007.
39. Pettersen EF, Goddard TD, Huang CC, Couch GS, Greenblatt DM, Meng EC, Ferrin TE.2004. UCSF Chimera—a visualization system for exploratory research and analysis. J. Comput. Chem.24:1605–1612.http: //dx.doi.org/10.1002/jcc.20084.
40. Wriggers W.2010. Using Situs for the integration of multi-resolution structures. Biophys. Rev.2:21–27.http://dx.doi.org/10.1007/s12551-009 -0026-3.
41. Winn MD, Wilson KS.2011. Overview of the CCP4 suite and current developments. Acta Crystallogr. D Biol. Crystallogr.67:235–242.http://dx .doi.org/10.1107/S0907444910045749.
42. Thompson JC, Higgins DG, Gibson TJ.1994. CLUSTAL W: improving the sensitivity of progressive multiple sequence alignment through se-quence weighting, position-specific gap penalties and weight matrix choice. Nucleic Acids Res.22:4673– 4680.http://dx.doi.org/10.1093/nar /22.22.4673.
43. Bevington PR.1969. Data reduction and error analysis for the physical sciences. McGraw-Hill, New York, NY.
44. Ren J, Wang X, Hu Z, Gao Q, Sun Y, Li X, Porta C, Walter TS, Gilbert RJ, Zhao Y, Axford D, Williams M, McAuley K, Rowlands DJ, Yin W, Wang J, Stuart DI, Rao Z, Fry EE.2013. Picornavirus uncoating inter-mediate captured in atomic detail. Nat. Commun.4:1929.http://dx.doi .org/10.1038/ncomms2889.
45. Tomko RP, Xu R, Philipson L.1997. HCAR and MCAR: the human and mouse cellular receptors for subgroup C adenoviruses and group B cox-sackieviruses. Proc. Natl. Acad. Sci. U. S. A.94:3352–3356.http://dx.doi .org/10.1073/pnas.94.7.3352.
46. Colston E, Racaniello VR.1994. Soluble receptor-resistant poliovirus mutants identify surface and internal capsid residues that control interac-tion with the cell receptor. EMBO J.13:5855–5862.
47. Colston EM, Racaniello VR.1995. Poliovirus variants selected on mutant receptor-expressing cells identify capsid residues that expand receptor recognition. J. Virol.69:4823– 4829.
48. Harber J, Bernhardt G, Lu HH, Sgro JY, Wimmer E.1995. Canyon rim residues, including antigenic determinants, modulate serotype-specific binding of polioviruses to mutants of the poliovirus receptor. Virology
214:559 –570.http://dx.doi.org/10.1006/viro.1995.0067.
49. Knowlton KU, Jeon ES, Berkley N, Wessely R, Huber S. 1996. A mutation in the puff region of VP2 attenuates the myocarditic phenotype of an infectious cDNA of the Woodruff variant of coxsackievirus B3. J. Virol.70:7811–7818.
50. Zhang P, Mueller S, Morais MC, Bator CM, Bowman VD, Hafenstein S, Wimmer E, Rossmann MG.2008. Crystal structure of CD155 and electron microscopic studies of its complexes with polioviruses. Proc. Natl. Acad. Sci. U. S. A.105:18284 –18289. Epub 12008 Nov 18214.http: //dx.doi.org/10.1073/pnas.0807848105.
51. Murdin AD, Wimmer E.1989. Construction of a poliovirus type 1/type 2 antigenic hybrid by manipulation of neutralization antigenic site II. J. Virol.63:5251–5257.
52. Minor PD, Ferguson M, Evans DM, Almond JW, Icenogle JP.1986. Antigenic structure of polioviruses of serotypes 1, 2 and 3. J. Gen. Virol.
67(Part 7):1283–1291.
53. Fiore L, Ridolfi B, Genovese D, Buttinelli G, Lucioli S, Lahm A, Ruggeri FM.1997. Poliovirus Sabin type 1 neutralization epitopes recognized by immunoglobulin A monoclonal antibodies. J. Virol.71:6905– 6912. 54. Page GS, Mosser AG, Hogle JM, Filman DJ, Rueckert RR, Chow M.
1988. Three-dimensional structure of poliovirus serotype 1 neutralizing determinants. J. Virol.62:1781–1794.
55. Sherry B, Mosser AG, Colonno RJ, Rueckert RR.1986. Use of mono-clonal antibodies to identify four neutralization immunogens on a com-mon cold picornavirus, human rhinovirus 14. J. Virol.57:246 –257. 56. Casasnovas JM, Springer TA.1994. Pathway of rhinovirus disruption by
soluble intercellular adhesion molecule 1 (ICAM-1): an intermediate in which ICAM-1 is bound and RNA is released. J. Virol.68:5882–5889. Organtini et al.
on November 7, 2019 by guest
http://jvi.asm.org/
57. Register RB, Uncapher CR, Naylor AM, Lineberger DW, Colonno RJ.
1991. Human-murine chimeras of ICAM-1 identify amino acid residues critical for rhinovirus and antibody binding. J. Virol.65:6589 – 6596. 58. Tsang SK, McDermott BM, Racaniello VR, Hogle JM.2001. Kinetic
analysis of the effect of poliovirus receptor on viral uncoating: the receptor as a catalyst. J. Virol.75:4984 – 4989.http://dx.doi.org/10.1128/JVI.75.11 .4984-4989.2001.
59. Tsang SK, Danthi P, Chow M, Hogle JM.2000. Stabilization of polio-virus by capsid-binding antiviral drugs is due to entropic effects. J. Mol. Biol.296:335–340.http://dx.doi.org/10.1006/jmbi.1999.3483.
60. Levy HC, Bostina M, Filman DJ, Hogle JM.2010. Catching a virus in the act of RNA release: a novel poliovirus uncoating intermediate character-ized by cryo-electron microscopy. J. Virol.84:4426 – 4441.http://dx.doi .org/10.1128/JVI.02393-09.
61. Shingler KL, Yoder JL, Carnegie MS, Ashley RE, Makhov AM, Conway JF, Hafenstein S.2013. The enterovirus 71 A-particle forms a gateway to allow genome release: a cryoEM study of picornavirus uncoating. PLoS Pathog.9:e1003240.http://dx.doi.org/10.1371/journal.ppat.1003240. 62. Belnap DM, Filman DJ, Trus BL, Cheng N, Booy FP, Conway JF, Curry
S, Hiremath CN, Tsang SK, Steven AC, Hogle JM.2000. Molecular tectonic model of virus structural transitions: the putative cell entry states of poliovirus. J. Virol.74:1342–1354.http://dx.doi.org/10.1128/JVI.74.3 .1342-1354.2000.
63. Bubeck D, Filman DJ, Cheng N, Steven AC, Hogle JM, Belnap DM.
2005. The structure of the poliovirus 135S cell entry intermediate at 10-angstrom resolution reveals the location of an externalized polypeptide that binds to membranes. J. Virol.79:7745–7755.http://dx.doi.org/10 .1128/JVI.79.12.7745-7755.2005.
64. Wang X, Peng W, Ren J, Hu Z, Xu J, Lou Z, Li X, Yin W, Shen X, Porta C, Walter TS, Evans G, Axford D, Owen R, Rowlands DJ, Wang J, Stuart DI, Fry EE, Rao Z.2012. A sensor-adaptor mechanism for entero-virus uncoating from structures of EV71. Nat. Struct. Mol. Biol.19:424 – 429.http://dx.doi.org/10.1038/nsmb.2255.
65. Hermans J, Lentz B.2013. Equilibria and kinetics of biological macro-molecules. John Wiley and Sons, Hoboken, NJ.
66. Bostina M, Levy H, Filman DJ, Hogle JM.2011. Poliovirus RNA is released from the capsid near a twofold symmetry axis. J. Virol.85:776 – 783.http://dx.doi.org/10.1128/JVI.00531-10.
67. Dykeman EC, Sankey OF.2010. Normal mode analysis and applications in biological physics. J. Phys Condens. Matter22:423202.http://dx.doi .org/10.1088/0953-8984/22/42/423202.
68. Lin J, Cheng N, Chow M, Filman DJ, Steven AC, Hogle JM, Belnap DM.
2011. An externalized polypeptide partitions between two distinct sites on genome-released poliovirus particles. J. Virol.85:9974 –9983.http://dx .doi.org/10.1128/JVI.05013-11.
69. Jackson T, Sharma A, Ghazaleh RA, Blakemore WE, Ellard FM, Sim-mons DL, Newman JW, Stuart DI, King AM.1997. Arginine-glycine-aspartic acid-specific binding by foot-and-mouth disease viruses to the purified integrin alpha(v)beta3 in vitro. J. Virol.71:8357– 8361. 70. Rossmann MG.1989. The canyon hypothesis. Hiding the host cell
recep-tor attachment site on a viral surface from immune surveillance. J. Biol. Chem.264:14587–14590.
71. Xiao C, Rossmann MG.2007. Interpretation of electron density with stereographic roadmap projections. J. Struct. Biol.158:182–187.http://dx .doi.org/10.1016/j.jsb.2006.10.013.
on November 7, 2019 by guest
http://jvi.asm.org/