Microaggregation Sorting Framework for
K-Anonymity Statistical Disclosure Control in
Cloud Computing
Md Enamul Kabir1 Abdun Naser Mahmood2 Abdul K Mustafa3 Hua Wang4
Abstract
In cloud computing, there have led to an increase in the capability to store and record personal data
(microdata) in the cloud. In most cases, data providers have no/little control that has led to concern
that the personal data may be beached. Microaggregation techniques seek to protect microdata in such
a way that data can be published and mined without providing any private information that can be
linked to specific individuals. An optimal microaggregation method must minimize the information loss
resulting from this replacement process. The challenge is how to minimize the information loss during
the microaggregation process. This paper presents a sorting framework for Statistical Disclosure Control
(SDC) to protect microdata in cloud computing. It consists of two stages. In the first stage, an algorithm
sorts all records in a data set in a particular way to ensure that during microaggregation very dissimilar
observations are never entered into the same cluster. In the second stage a microaggregation method
is used to create k-anonymous clusters while minimizing the information loss. The performance of the
proposed techniques is compared against the most recent microaggregation methods. Experimental results
using benchmark datasets show that the proposed algorithms perform significantly better than existing
associate techniques in the literature.
Index Terms
1
School of Agricultural, Computational and Environmental Sciences, University of Southern Queensland, Toowoomba, QLD
4350, Australia, e-mail: [email protected],2
School of Engineering and Information Technology, University of New South Wales,
Australian Defence Force Academy, Canberra, ACT 2600, Australia, email: [email protected],3Humber College,
Toronto, ON M9W 5L7, Canada, email: [email protected], and4
Centre for Applied Informatics, College of
Engineering & Science, Victoria University, VIC 8001, Australia, e-mail: [email protected].
Part of this work has been published in ICDM conference paper [27]. In this revised paper substantially new material has
Privacy, Microaggregation, Microdata protection,k-anonymity, Disclosure control
I. INTRODUCTION
In recent years, the phenomenal technological developments in information technology have led to an
increase in the capability to store and record personal data (microdata) of individuals in the cloud. This
has led to concerns that the personal data may be misused for a variety of purposes. In order to alleviate
these concerns, a number of techniques have been recently proposed in cloud computing in order to
perform data mining tasks that are privacy-preserving. Thus the microdata protection in cloud computing
has seen rapid advances in recent years and led to increased concerns about privacy. Existing laws and
regulations require that the dissemination of microdata information needs to avoid the propagation of
confidential information. In other words, microdata should be published in such a way that preserves the
privacy of individuals. Due to this reason privacy and anonymity have been intensively studied in recent
years in various fields [2], [3], [4], [34], [35], [36], [37], [38], [39], [40]. Microaggregation for Statistical
Disclosure Control (SDC) is a family of methods to protect microdata from individual identification.
SDC seeks to protect microdata in such a way that can be published and mined without providing any
private information that can be linked to specific individuals. Thus, the microdata protection in SDC can
be addressed from the viewpoint of privacy preserving in cloud computing.
To protect personal data from individual identification, SDC is often applied before the data are released
for analysis [5], [30]. The purpose of microdata SDC is to alter the original microdata in such a way
that the statistical analysis from the original data and the modified data are similar and the disclosure
risk of identification is low [5]. As SDC requires suppressing or altering the original data, the quality of
data and analysis results can be damaged. Hence, SDC methods must find a balance between data utility
and personal confidentiality.
Various methods for Microaggregation have been proposed in the literature for protecting microdata
[6], [7], [10], [11], [16], [17], [25], [26]. The basic idea of microaggregation is to partition a dataset
into mutually exclusive groups of at leastkrecords prior to publication, and then to publish the centroid
over each group instead of individual records. The resulting anonymized dataset satisfies k-anonymity
[14], [15], [23], requiring each record in a dataset to be identical to at least (k−1) other records
in the same dataset. As releasing microdata about individuals poses privacy threat due to the
privacy-related attributes, called quasi-identifiers, bothk-anonymity and microaggregation only consider the
quasi-identifiers. Microaggregation is traditionally restricted to numeric attributes in order to calculate the
In this paper we propose a microaggregated method that is restricted to numeric values.
The effectiveness of a microaggregation method is measured by calculating its information loss. A
lower information loss implies that the anonymized dataset is less distorted from an original dataset, and
thus provides better data quality for analysis. The SDC research community still relies on k- anonymity
[22], [23] as in the context of SDC, it provides sufficient protection of personal confidentiality of
microdata, while ensuring the quality of an anonymized dataset. Because of anonymization, an effective
microaggregation method should incur as little information loss as possible. In order to be useful in
practice, the dataset should keep as much informative as possible. Hence, it is necessary to seriously
consider the tradeoff between privacy and information loss. To minimize the information loss due to
microaggregation, all records are partitioned into several groups such that each group contains at leastk
similar records, and then the records in each group are replaced by their corresponding mean such that
the values of each variable are the same. Such similar groups are known as clusters. In the context of
data mining, clustering is a useful technique that partitions records into groups such that records within
a group are similar to each other, while records in different groups are more distinct from one another.
Thus, microaggregation can be seen as a clustering problem with constraints on the size of the clusters.
Many microaggregation methods derive from traditional clustering algorithms. For example,
Domingo-Ferrer and Mateo-Sanz [6] proposed univariate and multivariate k-Ward algorithms that extend the
agglomerative hierarchical clustering method of Ward et al. [28]. Domingo-Ferrer and Torra [9], [10]
proposed a microaggregation method based on the fuzzyc-means algorithm [1], and Laszlo and Mukherjee
[18] extended the standard minimum spanning tree partitioning algorithm for microaggregation [31]. All
of these microaggregation methods build all clusters gradually but simultaneously. There are some other
methods for microaggregation that have been proposed in the literature that build one/two cluster(s) at a
time. Notable examples include Maximum Distance [20], Diameter-based Fixed-Size microaggregation
and centroid-based Fixed-size microaggregation [18], Maximum Distance to Average Vector (MDAV)
[11], MHM [12] and the Two Fixed Reference Points method [32]. Most recently, Lin et al. [33] proposed
a density-based microaggregation method that forms clusters by the descending order of their densities,
and then fine-tunes these clusters in reverse order. The present work is done mainly in the context of
SDC microaggregation following norms within computer science community.
The reminder of this paper is organized as follows. We introduce the problem of microaggregation
in Section II. Section III introduces the basic concept of microaggregation. Section IV reviews previous
microaggregation methods. We propose a new sorting framework for microaggregation methods, explained
methods. Finally, concluding remarks are included in Section VII.
II. PROBLEM STATEMENT
The algorithms for microaggregation works by partitioning microdata into groups, where within groups
the records are homogeneous but between groups the records are heterogeneous so that information loss
is low. Similar groups are also called clusters. The level of privacy required is controlled by a security
parameter k, the minimum number of records in a cluster. In essence, the parameter k specifies the
maximum acceptable disclosure risk. Once a value forkhas been selected by the data protector, the only
job left is to maximize data utility. Maximizing utility can be achieved by microaggregating optimally,
i.e. with minimum within-groups variability loss. So the main challenge in microaggregation is how to
minimize the information loss during a clustering process. Although plenty of work has been done, to
maximize the data utility by forming clusters, this is not yet sufficient in terms of information loss. So
more research needs to be done to form the clusters such that the information loss is as low as possible.
This paper analyses the problem with sorting frameworks such that the information loss is minimal.
Observing this challenge, this work presents a sorting-based framework for microaggregation. The
proposed framework consists of two stages. In the first stage, a sorting algorithm sorts the data in a
particular way so that records in the two extreme end of the sorted list are dissimilar based on the
sorting technique. In the second stage two distant clusters are made simultaneously in a systematic way
using the first and last records of the sorted dataset. For the first stage, two sorting algorithms have
been proposed: the first based on multi-dimensional sorting, and the second based on distance from the
centroid (explained in Section V). In the second stage, a pairwise systematic microaggregation algorithm
forms a cluster with the first record and its (k−1) nearest records and another cluster with the last
record and its (k−1) nearest records. Next, it sorts the remaining records ((n−2k), if dataset containsn
records) by using the same sorting algorithm and recursively builds pair-clusters simultaneously by using
the first and the last record as seeds. Thus all clusters produced in this way containkrecords except the
last cluster that may contain at most(2k−1) records. Performance of the proposed methods is compared
against the most recent widely used microaggregation methods. The experimental results show that the
proposed microaggregation methods outperform the recent methods in the literature.
III. BACKGROUND
Microdata protection through microaggregation has been intensively studied in recent years. Many
techniques and methods have been proposed to deal with this problem. In this section we describe some
When we microaggregate data we should keep in mind two goals: data utility and preserving privacy
of individuals. In order to preserve the data utility, we should introduce as little noise as possible into the
data and private data should be sufficiently modified in such a way that it is difficult for an adversary to
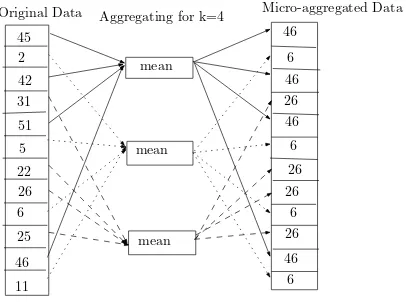
re-identify the corresponding individuals. Figure 1 shows an example of microaggregated data where the
individuals in each cluster are replaced by the corresponding cluster mean. The figure shows that after
aggregating the chosen elements, it is impossible to distinguish them, so that the probability of linking
any respondent is inversely proportional to the number of aggregated elements.
5 2
11 6 25 22 31
26 45 42 51
46
6
6 6 6 26
26 26
26 46 46 46
46 mean
mean
mean
[image:5.595.206.409.277.428.2]Original Data Aggregating for k=4 Micro-aggregated Data
Fig. 1. Example of Microaggregation using mean
Consider a microdata set T withp numeric attributes andn records, where each record is represented
as a vector in a p-dimensional space. For a given positive integer k ≤ n, a microaggregation method
partitions T into g clusters, where each cluster contains at least krecords (to satisfy k-anonymity), and
then replaces the records in each cluster with the centroid of the cluster. Let ni denote the number of
records in theith cluster, andxij,1≤j≤ni, denote the jth record in the ith cluster. Then,ni ≥k for
i= 1 to g, andPgi=1ni=n. The centroid of the ith cluster, denoted by x¯i is calculated as the average
vector of all the records in the ith cluster.
In the same way, the centroid of T, denoted by x¯, is the average vector of all the records in T.
Information loss is used to quantify the amount of information of a dataset that is lost after applying
a microaggregation method. In this paper we use the most common definition of information loss by
Domingo-Ferrer and Mateo-Sanz [6] as follows:
IL= SSE
SST (1)
record xij to the average valuex¯i as follows:
SSE= g
X
i=1 ni
X
j=1
(xij −x¯i) ′
(xij−x¯i) (2)
and SST is the sum of squared error within the entire datasetT, calculated by summing the Euclidean
distance of each record xij to the average valuex¯ as follows:
SST = g
X
i=1 ni
X
j=1
(xij−x¯) ′
(xij −x¯) (3)
For a given dataset T, SST is fixed regardless of how T is partitioned. On the other hand, the SSE
varies among different partitions of a dataset. In essence, SSE measures the similarity of the records in a
cluster. The lower the SSE, the higher the within-cluster homogeneity and the higher the SSE, the lower
the within-cluster homogeneity. If all records in a cluster are the same, then the SSE is zero indicating
no information is lost. On the other hand, if all the records in a cluster are more diverse, SSE is large
indicating more information loss. In this paper, we used SSE as a measure of similarity. Therefore, the
microaggregation problem can be enumerated as a constraint optimization problem as follows:
Definition 1 (Microaggregation problem) Given a datasetT ofnelements and a positive integer k,
find a partitioning G={G1, G2, ..., Gg} ofT such that
1) Gi∩Gj = Φ, for all i6=j= 1,2, ..., p,
2) ∪pi=1Gi =T,
3) SSE is minimized,
4) for all Gi ∈T, |Gi|≥k for anyGi ∈G.
The microaggregation problem stated above can be solved in polynomial time for a univariate dataset
[17] but has been shown to be NP hard for multivariate dataset [19]. It is a natural expectation thatSSE
is low if the number of clusters is large. Thus the number of records in each cluster should be kept close
to k. Domingo-Ferrer and Mateo-Sanz [6] showed that no cluster should contain more than (2k−1)
records since such clusters can always be partitioned to further reduce information loss.
IV. PREVIOUS MICROAGGREGATION METHODS
Previous microaggregation methods have been roughly divided into two categories, namely fixed-size
and data-oriented microaggregation [6], [12]. For fixed-size microaggregation, the partition is done by
k and (2k−1), depending on the total number of records n and the anonymity parameter k. For the
data-oriented microaggregation, the partition is done by allowing all clusters with sizes between k and
(2k−1). Intuitively, fixed-size methods reduce the search space, and thus are more computationally
efficient than data-oriented methods [33]. However, data-oriented methods can adapt to different values
ofkand various data distributions and thus may achieve lower information loss than fixed-size methods.
Domingo-Ferrer and Mateo-Sanz [6] proposed a multivariate fixed-size microaggregation method, later
called the Maximum Distance (MD) method [20]. The MD method repeatedly locates the two records that
are most distant to each other, and forms two clusters with their respective(k−1) nearest records until
fewer than2k records remain. If at leastkrecords remain, it then forms a new cluster with all remaining
records. Finally when there are fewer than krecords not assigned to any cluster yet, this algorithm then
individually assigns these records to their closest clusters. This method has a time complexity ofO(n3 )
although it can easily fixed to have a runtime of O(n2
). This method works well for some datasets as
when the dataset is large, microaggregation is normally combined with blocking; the most usual way is
to block by one of the attributes whose semantics is appropriate for blocking. Laszlo and Mukherjee [18]
modified the last step of the MD method such that each remaining record is added to its own nearest
cluster and proposed Diameter-based Fixed-size microaggregation. This method is however not a fixed
size method because it allows more than one cluster to have more thank records.
The MDAV method is the most widely used microaggregation method [11]. MDAV is the same as
MD except in the first step. MDAV finds the record r that is furthest from the current centroid of the
dataset and the record s that is furthest from r instead of finding the two records that are most distant
to each other, as is done in MD. Then form a cluster with r and its (k−1) nearest records and form
another cluster withsand its (k−1) nearest records. For the remaining records, repeat this process until
fewer than 2k records remain. If between k and (2k−1) records remain, MDAV simply forms a new
group with all of the remaining records. On the other hand, if the number of the remaining records is
below k, it adds all of the remaining records to their nearest cluster/clusters. So MDAV is a fixed size
method. Lin et al. [33] proposed a modified MDAV, called MDAV-1. The MDAV-1 is similar to MDAV
except when the number of the remaining records is between k and (2k−1), a new cluster is formed
with the record that is the furthest from the centroid of the remaining records, and its (k−1) nearest
records. Any remaining records are then added to their respective nearest cluster/clusters. Experimental
results indicate that MDAV-1 incurs slightly less information loss than MDAV [33]. Another variant of
the MDAV method, called MDAV-generic, is proposed by Solanas [20], where by the threshold 2k is
centroid of the remaining records and form a cluster with r and its (k−1) nearest records and another
cluster with the remaining records. Finally when fewer than2krecords remain, this algorithm then forms
a new cluster with all the remaining records.
Laszlo and Mukherjee [18] proposed another method, called Centroid-based Fixed-size
microaggrega-tion that is also based on a centroid but builds only one cluster during each iteramicroaggrega-tion. This algorithm first
find a recordr that is furthest from the current centroid of the dataset and then find a cluster withr and
its (k−1) nearest records. For the remaining records repeat the same process until fewer thank records
remain. Finally add each remaining record to its nearest clusters. This method is not a fixed-size method
as more than one cluster has more than k records. Solanas et al. [21] proposed a variable-size variant
of MDAV, called V-MDAV. V-MDAV first builds a new cluster of krecords and then tries to extend this
to up to (2k−1)records based on some criteria. V-MDAV adopts a user-defined parameter to control
the threshold of adding more records to a cluster. Chang et al. [32] proposed the Two Fixed Reference
Points (TFRP) method to accelerate the clustering process of k-anonymization. During the first phase,
TFRP selects two extreme points calculated from the dataset. Let Nmin andNmax be the minimum and
maximum values over all attributes in the datasets, respectively, then one reference point G1 has Nmin
as its value for all attributes, and another reference pointG2 has Nmax as its value for all attributes. A
cluster ofkrecords is then formed with the record r that is the furthest from G1 and the (k−1) nearest
records to r. Similarly another cluster of k records is formed with the recordsthat is the furthest from
G2 and (k−1) nearest records to s. These two steps are repeated until fewer than k records remain.
Finally, these remaining records are assigned to their respective nearest clusters. This method is quite
efficient asG1 andG2 are fixed throughout the iterations. When all clusters are generated, TFRP applies
a enhancement step to determine whether the records of a cluster should be retained or decomposed and
added to other clusters.
Lin et al. [33] proposed a density-based algorithm (DBA) for microaggregation. The DBA has two
dif-ferent scenarios. The first state of DBA (DBA-1) repeatedly builds a new cluster using thek-neighborhood
of the record with the highest k-density among all records that are not yet assigned to any cluster until
fewer than k unassigned records remain. These remaining records are then assigned to their respective
nearest clusters. The DBA-1 partitions the dataset into some clusters, where each cluster contains no
fewer than k records. The second state of DBA (DBA-2) attempts to fine-tune all clusters by checking
whether to decompose a cluster and merge its content with other clusters. Notably, all clusters are checked
during the DBA-2 by the reverse of the order that they were added to clusters in the DBA-1. After several
may contain more than (2k−1) records. At the end of the DBA-2, the MDAV-1 algorithm is applied to
each cluster with size above (2k−1) to reduce the information loss. This state is finally called MDAV-2.
Experimental results show that the DBA attains a reasonable dominance over the latest microaggregation
methods.
All of the microaggregation methods described above repeatedly choose one/ two records according to
various heuristics and form one/two cluster(s) with the chosen records and their respective (k−1) other
records. However there are other microaggregation methods that build all clusters simultaneously and
work by initially forming multiple clusters of records in the form of trees, where each tree represent a
cluster. The multivariatek-Ward algorithm [6] first finds the two records that are furthest from each other
in the dataset and build two clusters from these two records and their respective (k−1) nearest records.
Each of the remaining record then forms its own cluster. These clusters are repeatedly merged until all
clusters have at least k records. Finally the algorithm is recursively applied to each cluster containing
2k or more records. Domingo-Ferrer et al. [13] proposed a multivariate microaggregation method called
µ-Approx. This method first builds a forest and then decomposes the trees in the forest such that all trees
have sizes between kand max(2k−1,3k−5). Finally, for any tree with size greater than (2k−1), find
the node in the tree that is furthest from the centroid of the tree. Form a cluster with this node and its
(k−1) nearest records in the tree and form another cluster with the remaining records in the tree.
Hansen an Mukherjee [17] proposed a microaggregation method for univariate datasets called HM.
After that Domingo-Ferrer et al. [12] proposed a multivariate version of the HM method, called MHM.
This method first uses various heuristics, such as nearest point next (NPN), maximum distance (MD) or
MDAV to order the multivariate records. Steps similar to the HM method are then applied to generate
clusters based on this ordering. Domingo-Ferrer et al. [10] proposed a microaggregation method based
on fuzzyc-means algorithm (FCM) [1]. This method repeatedly runs FCM to adjust the two parameters
of FCM (one is the number of clusters c and another is the exponent for the partition matrix m) until
each cluster contains at leastkrecords. The value ofcis initially large (and mis small) and is gradually
reduced (increased) during the repeated FCM runs to reduce the size of each cluster. The same process
is then recursively applied to those clusters with 2k or more records.
V. THEPROPOSEDAPPROACH
This section presents sorting algorithms and a pairwise systematic technique for microaggregation that
attempts to minimize the information loss and satisfies the k-anonymity requirement.
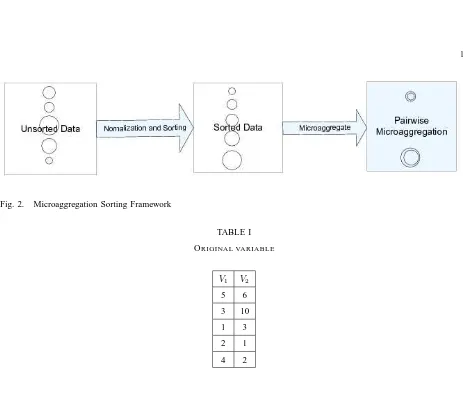
Fig. 2. Microaggregation Sorting Framework
TABLE I
ORIGINAL VARIABLE
V1 V2
5 6
3 10
1 3
2 1
4 2
data is first normalized and then sorting functions are applied to sort them. Then a P-S microaggregation
technique is applied to the sorting data in order to protect individual identification. It has been observed
that the reason of existing techniques have high information loss is due to some clusters containing
very different records which increase the information loss of a cluster. However, a random initial choice
of cluster elements may lead to a sub-optimal microaggregation (of dissimilar records) in the same
cluster, resulting in higher Information Loss. The proposed techniques solve this problem by creating
initial clusters in such a way so that the records in cluster are very dissimilar to the records in another
cluster. This can be achieved by applying sorting techniques and choosing extreme elements as part
of two different clusters. This process is explained in the following sections (Section V-B and Section
V-C). Next, a pairwise systematic method takes this sorted dataset to create two clusters repeatedly by
minimizing information loss and observingk-anonymity. The algorithm is described in Section V-D. The
comparative results of the two techniques against existing techniques in the literature is given in Section
A. Normalization of data
To avoid attribute bias, data should be normalized before applying microagggregation methods. In this
paper, the following normalization formulae is used in order to adjust values measured on different scales
to a notionally common scale:
X′ = X−Xmin
Xmax−Xmin
(4)
This unity-based normalization carried out in order to bring all values into the range [0,1].
B. Multi-Dimensional Sorting Technique
Before describing the sorting technique, first, consider a simple example. Consider Table I which
consists of two variables V1 and V2. Rank (R)/Index arranges each of the variables in ascending order
individually and creates a table where the columns indicates the value position in the original data (Table
I). For example, the first rank (3) of column 1 in Table IIA indicates the position of smallest value of the
first variable (1) in Table I. Similarly, the second (4) and third (2) ranks indicate the positions of second
smallest (2) and third lowest (3) values respectively. The second column is also created in the same way.
Now sum the positions of each rank. For example, in Table IIB rank 1 comes from the positions of5th
row of first column and4th row of second column, rank 2 comes from the positions of third row of first
column and fifth row of second column and so on, i.e.,1(9),2(8),3(4),4(3),5(6), where first number is
the rank and the number in bracket is the sum of respective positions. The last column is the rank of the
sum-values in bracket of the previous column. For example, 4(3) is ranked 1, since 3 is the smallest sum
in9,8,4,3,6. Thus according to this sorting algorithm, the first record in the sorted table (see Table III)
should be the 4th row, the second record should be third row of original table in Table I and so on. The
sorted table is presented in Table III. The algorithm of this sorting technique is presented in Table 1.
TABLE II
A.RANK OF SORTED VALUESB.SUM OFRANKS AND FINAL POSITIONS
R1 R2
3 4
4 5
2 3
5 1
1 2
Rank Sum R
1(5+4)=1(9) 5
2(3+5)=2(8) 4
3(1+3)=3(4) 2
4(2+1)=4(3) 1
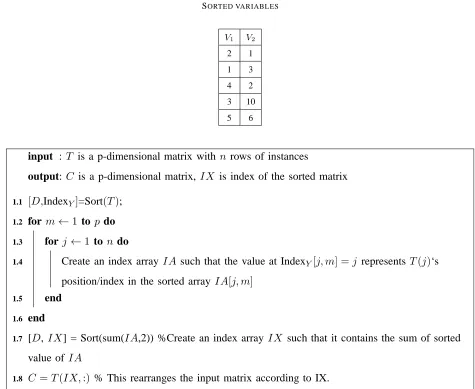
TABLE III
SORTED VARIABLES
V1 V2
2 1
1 3
4 2
3 10
5 6
input : T is a p-dimensional matrix with nrows of instances
output: C is a p-dimensional matrix, IX is index of the sorted matrix
1.1 [D,IndexY]=Sort(T);
1.2 form←1 top do
1.3 forj ←1 ton do
1.4 Create an index array IAsuch that the value at IndexY[j, m] =j representsT(j)‘s
position/index in the sorted array IA[j, m]
1.5 end
1.6 end
1.7 [D, IX] = Sort(sum(IA,2)) %Create an index array IX such that it contains the sum of sorted
value ofIA
1.8 C=T(IX,:) % This rearranges the input matrix according to IX.
Algorithm 1: Multi-Dimensional Sorting Algorithm
According to the next phase algorithm in Table 2, it is expected that the first record and the last record
are distant from each other, so that the first record and the last record are not included in the same cluster.
C. Mean-based Sorting Technique
The mean-based sorting technique simply defines a way to calculate the distance between a point and
the centroid of the dataset, and sorts these points based on this distance. Consider a microdata setT with
p numeric attributes, namely Y1, Y2, ..., Yp andnrecords. Thus each record is represented as a vector in
a p-dimensional space. To sort all the records with respect to the numeric attributes, we define the jth
TABLE IV
MEAN-SORTING TECHNIQUE
y1 y2 Pp
i=1(yij−y¯i) R
5 6 3.6 4
3 10 5.6 5
1 3 -3.4 2
2 1 -4.4 1
4 2 -1.4 3
SFj = p
X
i=1
(yij−y¯i), j= 1,2..., n. (5)
where, yij is thejth record of theith attribute and y¯i is the centroid of theith attribute. The SF stated
above measures the distance between the records and their corresponding centroid. In this study, the SF
is arranged in ascending order indicating records that are arranged in order of magnitude. The lower
the values of SF, the more the records are below their respective centroid and the higher the values of
SF, the more the records are above their respective centroid. Thus the records in the dataset T, sorted
in ascending order based on the SF and the first and the last record, are most distant among all other
records in the dataset T.
To illustrate the Meansort algorithm, consider Table IV in which the columns represent the two data
variables y1 and y2, their SF values (calculated using Equation 5), and the ranking of the SF values.
Therefore, according to the example in Table IV row 2 (5.6) and row 4 (-4.4) are the two farthest
instances hence they occupy the top and bottom positions in Table V which represents the sorted data.
As mentioned earlier, this sorted table is used by the next technique (P-S algorithm) to systematically
create two clusters at a time that minimizes the information loss and satisfiesk-anonymity.
D. Pairwise-Systematic (P-S) microaggregation algorithm
Based on the information loss measure in Equation (1), the sorting process in Algorithm 1, the sorting
function in Equation (5), and the definition of the microaggregation problem, the Pairwise-Systematic
(P-S) microaggregation algorithm are as follows:
According to this method, first sorts all records of n in the dataset T in ascending order using the
Algorithm 1 and Equation 5. Thus in the sorting dataset, the first record and the last record are the most
TABLE V
SORTED VARIABLES
y1 y2
2 1
1 3
4 2
5 6
3 10
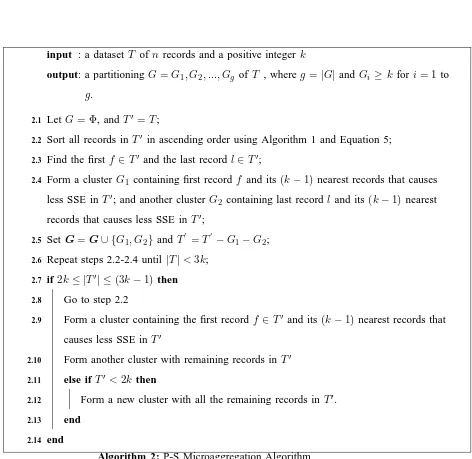
input : a datasetT ofn records and a positive integer k
output: a partitioning G=G1, G2, ..., Gg ofT , whereg=|G|and Gi ≥k for i= 1 to
g.
2.1 LetG= Φ, and T′ =T;
2.2 Sort all records in T′ in ascending order using Algorithm 1 and Equation 5;
2.3 Find the first f ∈T′ and the last record l∈T′;
2.4 Form a cluster G1 containing first record f and its (k−1) nearest records that causes
less SSE in T′; and another clusterG
2 containing last recordl and its (k−1) nearest
records that causes less SSE inT′;
2.5 Set G=G∪ {G1, G2} andT ′
=T′
−G1−G2;
2.6 Repeat steps 2.2-2.4 until|T|<3k;
2.7 if 2k≤ |T′| ≤(3k−1) then
2.8 Go to step 2.2
2.9 Form a cluster containing the first record f ∈T′ and its (k−1) nearest records that
causes less SSE in T′
2.10 Form another cluster with remaining records in T′
2.11 else if T′ <2kthen
2.12 Form a new cluster with all the remaining records in T′.
2.13 end
2.14 end
repeatedly builds pair clusters using the first record and the last record in the sorting dataset and their
corresponding(k−1) nearest records until fewer than3k records remain (see steps 2.2-2.6 of Algorithm
2). The nearest records in a cluster are chosen in such a way that the inclusion of these records causes
less SSE than the other records in the dataset. If between 2k and (3k−1) records remain, then sort
these records in ascending order by using the same sorting process in Algorithm 1, and sorting function
in Equation 5 and then find the first record f. Form a cluster with f and its (k−1) nearest records that
causes less SSE, and another cluster with the remaining records (see step 2.7 of Algorithm 2). Moreover,
if fewer than 2k records remain, then form a new cluster with all remaining records (see step 2.9 of
Algorithm 2).
The proposed algorithm stated above endeavours to repeatedly build two clusters simultaneously in
a systematic way. As the records in the dataset T are arranged in ascending order and the first record
and the last record are most distant to each other, building clusters in this systematic way, the algorithm
easily captures if there are any extreme values in the dataset. The algorithm is similar to MDAV-generic
but the selection process of two most distant points are different, as well as how clusters are built based
SSE.
VI. EXPERIMENTALRESULTS
This section presents the experimental results and compares the results with several existing techniques.
The objective of this experiment is to investigate the effectiveness of the proposed algorithms in terms
of measured information loss of represented cluster data. The following three datasets [12], which have
been used as benchmarks in previous studies to evaluate various microaggregation methods, were adopted
in the experiments.
1) The “Tarragona” dataset contains 834 records with 13 numerical attributes.
2) The “Census” dataset contains 1,080 records with 13 numerical attributes.
3) The “EIA” dataset contains 4,092 records with 11 numeric attributes (plus two additional categorical
attributes not used here).
To accurately evaluate our approach, the performance of the proposed algorithms (MultiDSort+PS and
Meansort+PS) are compared in this section with various microaggregation methods. Tables VI-VIII show
the information losses of these microaggregation methods. Data representing the proposed techniques for
TABLE VI
INFORMATION LOSS COMPARISON USINGTARRAGONA DATASET
Method k= 3 k= 4 k= 5 k= 10
MDAV-MHM 16.9326 22.4617 33.1923
MD-MHM 16.9829 22.5269 33.1834
CBFS-MHM 16.9714 22.8227 33.2188
NPN-MHM 17.3949 27.0213 40.1831
M-d 16.6300 19.66 24.5000 38.5800
µ-Approx 17.10 20.51 26.04 38.80
TFRP-1 17.228 19.396 22.110 33.186
TFRP-2 16.881 19.181 21.847 33.088
MDAV-1 16.93258762 19.54578612 22.46128236 33.19235838
MDAV-2 16.38261429 19.01314997 22.07965363 33.17932950
DBA-1 20.69948803 23.82761456 26.00129826 35.39295837
DBA-2 16.15265063 22.67107728 25.45039236 34.80675148
MultiDSort 9.86 12.17 18.52 32.23
Meansort 5.49 8.34 10.89 17.00
TABLE VII
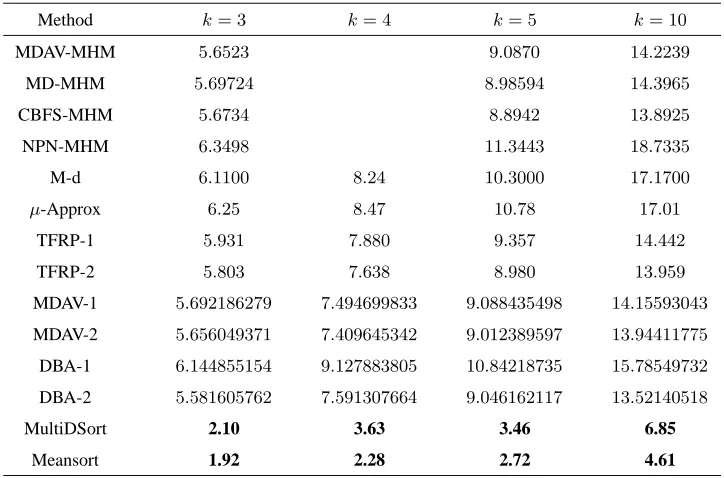
INFORMATION LOSS COMPARISON USINGCENSUS DATASET
Method k= 3 k= 4 k= 5 k= 10
MDAV-MHM 5.6523 9.0870 14.2239
MD-MHM 5.69724 8.98594 14.3965
CBFS-MHM 5.6734 8.8942 13.8925
NPN-MHM 6.3498 11.3443 18.7335
M-d 6.1100 8.24 10.3000 17.1700
µ-Approx 6.25 8.47 10.78 17.01
TFRP-1 5.931 7.880 9.357 14.442
TFRP-2 5.803 7.638 8.980 13.959
MDAV-1 5.692186279 7.494699833 9.088435498 14.15593043
MDAV-2 5.656049371 7.409645342 9.012389597 13.94411775
DBA-1 6.144855154 9.127883805 10.84218735 15.78549732
DBA-2 5.581605762 7.591307664 9.046162117 13.52140518
MultiDSort 2.10 3.63 3.46 6.85
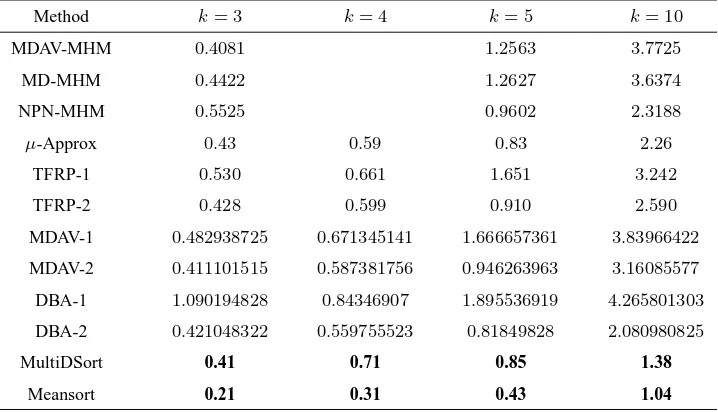
TABLE VIII
INFORMATION LOSS COMPARISON USINGEIADATASET
Method k= 3 k= 4 k= 5 k= 10
MDAV-MHM 0.4081 1.2563 3.7725
MD-MHM 0.4422 1.2627 3.6374
NPN-MHM 0.5525 0.9602 2.3188
µ-Approx 0.43 0.59 0.83 2.26
TFRP-1 0.530 0.661 1.651 3.242
TFRP-2 0.428 0.599 0.910 2.590
MDAV-1 0.482938725 0.671345141 1.666657361 3.83966422
MDAV-2 0.411101515 0.587381756 0.946263963 3.16085577
DBA-1 1.090194828 0.84346907 1.895536919 4.265801303
DBA-2 0.421048322 0.559755523 0.81849828 2.080980825
MultiDSort 0.41 0.71 0.85 1.38
Meansort 0.21 0.31 0.43 1.04
of methods DBA-1, DBA-2, MDAV-1 and MDAV-2 are quoted from [33]; the information losses of
methods MDAV-MHM, MD-MHM, CBFS-MHM, NPN-MHM and M-d (for k = 3,5,10) are quoted
from [12]; the information losses of methods µ-Approx and M-d (for k = 4) are quoted from [13],
and the information losses of methods TFRP-1 and TFRP-2 are quoted from [32]. TFRP is a two-stage
method and its two stages are denoted as TRFP-1 and TRFP-2 respectively. The TFRP-2 is similar to
the DBA-2 but disallows merging a record to a group of size over(4k−1).
Tables VI-VIII show the information loss for several values of k and the Tarragona, Census and for
the EIA datasets respectively. As mentioned above, the information loss of the proposed algorithms
is compared with the latest microaggregation methods listed above. Information loss is measured as SSE
SST ×100, where SST is the total sum of the squares of the dataset (see Equation 3). Note that the
within-groups sum of squares SSE is never greater than SST, therefore, the reported information loss
measure takes values in the range [0,100]. Tables VI-VIII illustrate that in all of the test situations, the
proposed algorithms incurs significantly less information loss than any of the microaggregation methods
listed in the table. Therefore, the experimental results validate that proposed sorting based systematic
microaggregation techniques offer better utility than the compared techniques.
Analysis: Both techniques outperform the existing techniques by a fair margin. It also shows that the
Meansort technique consistently achieves a lower information loss compared to MultiDSort in all datasets.
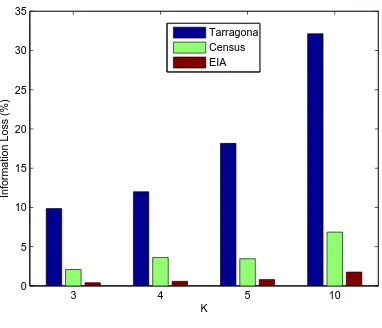
3 4 5 10 0
5 10 15 20 25 30 35
K
Information Loss (%)
[image:18.595.208.399.129.293.2]Tarragona Census EIA
Fig. 3. Information Loss vskfor MultiDSort-based Microaggregation on Tarragona, Census, and EIA datasets
distances from the centroid, MultiDSort only generates a partial order of the instances so that the top and
bottom instances are far from each other without exhaustively compared to other instances. Consequently,
MultiDSort does not rely on a single reference point to measure the distance of each instance, instead it
relies on the relative values of the variables of the instance vector so that instances with lower attribute
values appear at the top and the ones with higher attribute values appear at the bottom. Indeed, MultiDSort
can be extended to generate a matrix with all possible distance-pairs to identify which two instances are
farthest from each other. This is planned as a future work and extension to the present work.
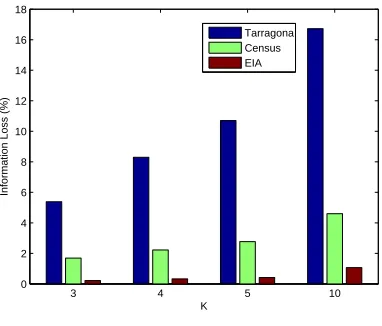
Figure 3 and Figure 4 illustrate how the information loss values changes withkfor each dataset. Results
indicate that information loss increases with k. This is obvious since the higher number of records in
each cluster results in higher sum-of-squared-error (SSE) values due to the fact that each cluster now has
more observations and possibly larger variance. Interestingly, there is little correlation between overall
information loss of a dataset and its size as evident from the fact that the information loss for EIA dataset
(containing 4092 instances) is much lower than the information loss for Tarragona dataset (containing
1082 instances). This may be due to the lower variance in EIA dataset resulting in clusters with lower
SSE, hence lower information loss.
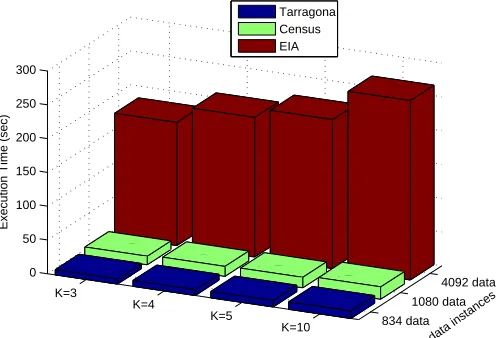
Figure 5 and Figure 6 show how the execution time varies with k and different file sizes. Again,
results show that the execution time depends on the value ofk. It shows that the execution time increases
slightly due to the increased number of permutations that need to be calculated for each cluster for the
higher k. Furthermore, as expected the execution is also related to a file size. As expected, it takes the
3 4 5 10 0
2 4 6 8 10 12 14 16 18
K
Information Loss (%)
[image:19.595.208.399.130.293.2]Tarragona Census EIA
Fig. 4. Information Loss vskfor Meansort-based Microaggregation on Tarragona, Census, and EIA datasets
834 data 1080 data
4092 data K=3
K=4 K=5
K=10 0
50 100 150 200 250 300
data instances
Execution Time (sec)
Tarragona Census EIA
Fig. 5. Execution time vsk(MultiDSort)
census dataset (834 instances).
VII. CONCLUSION
Microdata protection in cloud computing is a challenging task in privacy preserving. Microaggregation
is an effective method in SDC for protecting privacy in microdata and has been extensively used
world-wide. This paper proposed new microaggregation methods in SDC that can be applied in cloud computing
where the level of privacy required is controlled by a parameterk, often called the anonymity parameter.
Fork-anonymization,kis basically the minimum number of records in a cluster. Once the value ofkhas
[image:19.595.199.429.346.506.2]834 data 1080 data
4092 data K=3
K=4
K=5
K=10 0
50 100 150 200 250 300
data instances
Execution Time (sec)
[image:20.595.187.436.131.300.2]Tarragona Census EIA
Fig. 6. Execution time vsk(Meansort)
work has presented new sorting frameworks for numerical attributes to minimize the information loss.
The new methods consists of two stages. In the first stage it sorts all the records in the dataset so that
the first and the last record are very different, and in the second stage it describes a pairwise systematic
clustering algorithm that builds clusters with minimum information loss. A comparison has been made
of the proposed algorithms with the most widely used microaggregation methods using the three most
popular benchmark datasets (Tarragona, Census and the EIA). The experimental results show that the
proposed algorithm outperforms all the tested microaggregation methods with respect to information loss.
Thus the proposed method is very effective in preserving the privacy microdata sets and can be used as
an effective privacy preserving k-anonymization method for Statistical Disclosure Control.
REFERENCES
[1] Bezdek, J.C.: Pattern recognition with fuzzy objective function algorithms. Academic Publishers, Norwell (1981).
[2] Bhargava, B., Singh, N., Sinclair, A.: Privacy in Cloud Computing Through Identity Management. International Conference
on Advances in Computing and Communication (ICACC), pp. 1-6, Hamirpur (2011)
[3] Cormode, G., Procopiuc, C.M., Shen, E., Srivastava, D., Yu, T.: Empirical privacy and empirical utility of anonymized data.
ICDE Workshops, pp. 77-82, Brisbane (2013)
[4] Clifton,C., Tassa, T.: On syntactic anonymity and differential privacy. ICDE Workshops, pp. 88-93, Brisbane (2013)
[5] Domingo-Ferrer, J., Torra, V.: Privacy in data mining. Data Mining and Knowledge Discovery. 11 (2), 117–119 (2005)
[6] Domingo-Ferrer, J., Mateo-Sanz, J.: Practical data-oriented microaggregation for statistical disclosure control. IEEE
[7] Domingo-Ferrer, J., Torra, V.: Extending microaggregation procedures using defuzzification methods for categorical variables.
In: 1st international IEEE symposium on intelligent systems, pp. 44–49. Verna (2002)
[8] May, P., Ehrlich, H.C., Steinke, T.: ZIB Structure Prediction Pipeline: Composing a Complex Biological Workflow through
Web Services. In: Nagel, W.E., Walter, W.V., Lehner, W. (eds.) Euro-Par 2006. LNCS, vol. 4128, pp. 1148–1158. Springer,
Heidelberg (2006)
[9] Domingo-Ferrer, J., Torra, V.: Towards fuzzyc-means based microaggregation. In: Grzegorzewski, P., Hryniewicz, O., Gil, A.
(eds.) Soft methods in probability, statistics and data analysis. Advances in soft computing, vol. 16, pp. 289-294. Heidelberg:
Physica-Verlag (2002)
[10] Domingo-Ferrer, J. and Torra, V.: Fuzzy microaggregation for microdata protection. Journal of Advanced Computational
Intelligence and Intelligent Informatics. 7(2), 153-159 (2003)
[11] Domingo-Ferrer, J., Torra, V.: Ordinal, continuous and heterogeneous kanonymity through microaggregation. Data Mining
and Knowledge Discovery. 11(2), 195-212 (2005)
[12] Domingo-Ferrer, J., Martinez-Balleste, A., Mateo-Sanz, J.M., Sebe, F.: Efficient multivariate data-oriented microaggregation.
The VLDB Journal. 15(4), 355-369 (2006)
[13] Domingo-Ferrer, J., Sebe, F., Solanas, A.: A polynomial-time approximation to optimal multivariate microaggregation.
Computer and Mathematics with Applications. 55(4), 714-732 (2008)
[14] Gionis, A., Mazza, A., Tassa, T.: k-Anonymization Revisited. ICDE, pp. 744-753, Maxico (2008)
[15] Ghinita,G., Karras, P., Kalnis, P., Mamoulis, N.: A framework for efficient data anonymization under privacy and accuracy
constraints. ACM Transaction on Database System. 34(2), Article 9 (2009)
[16] Han, J.-M., Cen, T.,-T., Yu, H.-Q., Yu, J.: A multivariate immune clonal selection microaggregation algorithm. IEEE
international conference on granular computing. pp. 252–256. Hangzhou (2008)
[17] Hansen, S., Mukherjee, S.: A polynomial algorithm for optimal univariate microaggregation. IEEE Transactions on
Knowledge and Data Engineering. 15(4), 1043-1044 (2003)
[18] Laszlo, M., Mukherjee, S.: Minimum spanning tree partitioning algorithm for microaggregation. IEEE Transactions on
Knowledge and Data Engineering. 17(7), 902-911 (2005)
[19] Oganian, A., Domingo-Ferrer, J.: On the complexity of optimal microaggregation for statistical disclosure control. Statistical
Journal of the United Nations Economic Commission for Europe. 18, 345-354 (2001)
[20] Solanas, A.: Privacy protection with genetic algorithms. In: Yang, A. Shan, Y., Bui, L.T. (eds.) Success in evolutionary
computation. Studies in Computional Intelligence, vol. 92, pp. 215-237. Heidelberg: Springer (2008)
[21] Solanas, A., Martinez-Balleste, A., Domingo-Ferrer, J.:V−M DAV: A multivariate microaggregation with variable group
size. In: 17th COMPSTAT Symposium of the IASC. Rome (2006).
[22] Samarati, P.: Protecting respondent’s privacy in microdata release. IEEE Transactions on Knowledge and Data Engineering.
13(6), 1010–1027 (2001)
[23] Sweeney, L.:k-Anonymity: A model for protecting privacy. International Journal on Uncertainty, Fuzziness and
Knowledge-based Systems. 10(5), 557-570 (2002)
[24] Torra, V.: Microaggregation for categorical variables: A median based approach. In: Domingo-Ferrer, J., Torra, V. (eds.)PSD
2004. LNCS, vol. 3050, pp. 162-174. Heidelberg: Springer , (2004)
[25] Kabir, M.E., Wang,H.: Systematic Clustering-based Microaggregation for Statistical Disclosure Control. In: IEEE
[26] Kabir, M.E., Wang, H.: Microdata Protection Method Through Microaggragation: A Median Based Approach. Information
Security Journal: A Global Perspective, 20(1), 1–8 (2011)
[27] Kabir, M.E., Wang, H., Zhang, Y.: A Pairwise-Systematic Microaggregation for Statistical Disclosure Control. ICDM 2010:
266-273 (2010)
[28] Ward, J.H.J.: Hierarchical grouping to optimize an objective function. Journal of the American Statistical Association, 58
(301), 236-244 (1963)
[29] Wang, H., Zhang, Y., Cao, J.: Effective collaboration with information sharing in virtual universities. IEEE Transactions
on Knowledge and Data Engineering, 21(6), 840–853 (2009)
[30] Willenborg, L., Waal, T.D.: Elements of statistical disclosure control. Lecture notes in statistics. 155 (2001)
[31] Zahn, C.T.: Graph-theoretical methods for detecting and describing gestalt clusters. IEEE Transactions on Computers,C-20
(1), 68-86 (1971).
[32] Chang, C.-C., Li, Y.-C., Huang, W.-H.: TFRP: An efficient microaggregation algorithm for statistical disclosure control.
Journal of Systems and Software, 80 (11), 1866–1878 (2007)
[33] Lin, J.-L., Wen, T.-H., Hsieh, J.-C., Chang, P.-C.: Density-based microaggregation for statistical disclosure control. Expert
Systems with Applications, 37(4), 3256–3263 (2010)
[34] B. Agir, T.G. Papaioannou, R. Narendula, K. Aberer and J.-P. Hubaux, Adaptive Personalized Privacy in Participatory
Sensing, Presented at: 5th ACM Conference on Security and Privacy in Wireless and Mobile Networks, Tucson, Arizona,
USA, April 16-18, (2012).
[35] Sen-ching Samson Cheung, Deepa Kundur, Andrew Senior: Enhancing Privacy Protection in Multimedia Systems.
EURASIP J. Information Security 2009: (2009)
[36] Shipra Agrawal, Jayant R. Haritsa, B. Aditya Prakash: FRAPP: a framework for high-accuracy privacy-preserving mining.
Data Min. Knowl. Discov. 18(1): 101-139 (2009)
[37] Yan Sun, Thomas F. La Porta, Parviz Kermani: A Flexible Privacy-Enhanced Location-Based Services System Framework
and Practice. IEEE Trans. Mob. Comput. 8(3): 304-321 (2009)
[38] Joshi, C.-C. Jay Kuo: Security and privacy in online social networks: A survey. ICME 2011: 1-6 (2011)
[39] Mauro Barni, Pierluigi Failla, Riccardo Lazzeretti, Ahmad-Reza Sadeghi, Thomas Schneider: Privacy-Preserving ECG
Classification With Branching Programs and Neural Networks. IEEE Transactions on Information Forensics and Security
6(2): 452-468 (2011)
[40] Tanya Ignatenko, Frans M. J. Willems: Information leakage in fuzzy commitment schemes. IEEE Transactions on