Patterns of secondary forest recovery in two soil types
202
0
0
Full text
(2) PATTERNS OF SECONDARY FOREST RECOVERY IN TWO SOIL TYPES. PhD Thesis. Claudia Pandolfo Paz. James Cook University. August, 2016. i.
(3) Patterns of secondary forest recovery in two soil types. By Claudia Pandolfo Paz. BSc (Biological Sciences), Vale do Rio dos Sinos University, Unisinos, Brazil. MSc (Ecology), National Institute of Amazonian Research, INPA, Brazil. A thesis Presented to the College of Marine and Environmental Sciences James Cook University (Cairns, Australia) in Partial Fulfillment of the Requirements for the Degree of Doctor of Philosophy. ii.
(4) “Passava os dias ali, quieto, no meio das coisas miúdas. E me encantei” Manoel de Barros, Brazilian poet. iii.
(5) Dedication. I dedicate this thesis to my parents Roberto and Rosa and my brothers Chico and Álvaro.. iv.
(6) Acknowledgments. Many people have contributed to the completion of this PhD thesis, in many ways. This work was possible thanks to my principal supervisor Dr Susan Laurance. She gave me the opportunity to come to Australia for my doctorate studies. During the entire time, she has trusted me and she has given me enough liberty to follow my ideas. Nonetheless, she has been watching my steps and guiding me to better pathways. I really appreciate her honesty and generosity. Dr Miriam Goosem has been absolutely crucial for the completion of my thesis, professionally and personally. Her kindness and hard work are endless. A big thank you also to Dr Sandra Abell, who accepted to collaborate in one of the chapters, becoming a great advisor for the whole process. I thank Michael Bird for being available when I needed and for providing relevant guidance in the early stages of this project. Other people have also contributed to field and laboratory work, statistics, discussion and insights – a big thank you to Steve Goosem, Noel Preece, Steve McKenna, Joe Holtum, Paul Nelson, Segun Osunkoya, Bill Laurance, Steve Turton, Peter Whitehead, Maarja Öpik, Jon Lloyd and Beto Quesada. I would also like to thank Leanne Shillitoe for the great job in the Department’s office and Kylie Brown for making sure we are all safe during lab and fieldwork. I am also grateful for all the people that have helped, in different moments, with field or lab work - Martha Karafir, Gabriel Coimbra, Yoko Ishida, Andrew Hunter, Jamie Huther, Alana Valero and Loïc Cecilio Rebola. I am also deeply grateful to the landowners on the Tablelands who gave us permission to work on their properties. Special thanks to Mr. Gibson for the cookies with tea and stories. Another huge thanks to Penny and Richard McIntosh for not only being around in a very scary moment but also for opening their house and providing the best shelter in the rainy & chilly nights in Tarzali.. v.
(7) Life is meaningless without friends. I am very glad I have met such lovely people to be my family away from home. Some of these people have contributed directly to my work, but more importantly, provided priceless support and care. Thanks to David Tng, Deborah Apgaua. Kaylene Bransgrove, Janet Gagul and Susan Nuske, who are not only dear friends, but guided and inspired me through the plant and fungi world with immense passion and knowledge. Thanks to Ana Palma, Lucas Cernusak, and Alex Cheesman for always being there for a good chat over cold drinks. Thanks to Cristina Rodrigues, Dagmar Meyer Steiger, Mason Campbell, Nandini Velho, Edison Salas and all the fellow PhD students for companionship during the good and the difficult moments of this journey. Finally, I thank my dear family for the unlimited love and encouragement to follow my dreams.. vi.
(8) Patterns of secondary forest recovery in two soil types. Claudia Pandolfo Paz, PhD Candidate James Cook University, 2016. Supervisors: Susan G.W Laurance Miriam Goosem Michael Bird. vii.
(9) Statement of contribution. Chapters 2-5 included in this thesis have been prepared for submission or are currently in review in ecological journals. Different researchers have made contributions to this thesis.. Chapter 2 in this thesis is a literature review on the patterns of woody community regeneration in secondary forest. This chapter is being prepared to be published in collaboration with Susan Laurance. Claudia P. Paz conceived the main idea and reviewed the literature. Susan Laurance and Claudia P. Paz analysed the data and wrote the manuscript.. Chapter 3 is my first data chapter where I investigate the woody plant community change in the secondary forests. This manuscript has been prepared for submission in Plant Ecology and Diversity as: “Paz CP, Goosem M, Tng D, Fensham RJ, Goosem S, Preece ND and Laurance SGW. Does soil type affect woody plant community recovery during secondary forest succession?” Claudia P. Paz, Susan Laurance and Miriam Goosem conceived the main ideas and carried out fieldwork. David Tng provided the species list with their functional traits and helped discussion and editing on early drafts. Claudia P. Paz analysed the data and wrote the manuscript with contributions from Susan Laurance and Miriam Goosem. Miriam Goosem analysed satellite images and historical photographs to determine site ages. Rod Fensham, Steve Goosem and Noel Preece, helped with discussions and editing the manuscript.. Chapter 4 is focused on the arbuscular mycorrhizal communities in secondary and mature forests. This chapter had been prepared for submission in Oecologia as: “Paz CP, Abell S, Goosem M, Öpik M, Fensham RJ, Goosem S, Preece ND and Laurance SGW. The effects of soil types on arbuscular mycorrhizal communities during tropical forest succession”. Claudia P. Paz,. viii.
(10) Sandra Abell, Susan Laurance and Miriam Goosem conceived the main idea and carried out fieldwork. Maarja Öpik discussed ideas and performed molecular analysis. Claudia P. Paz analysed the data and wrote the manuscript with Susan Laurance, Sandra Abell and Miriam Goosem. Rod Fensham, Steve Goosem and Noel Preece helped with discussions and in editing the manuscript.. Chapter 5 investigates the accumulation of soil organic carbon in active pastures, secondary and mature forests. This chapter has been submitted to Forest Ecology and Management as: “Paz CP, Goosem M, Bird M,, Preece ND, Goosem S, Fensham RJ and Laurance SGW. Soil types influence soil carbon stock recovery in tropical secondary forests”. Claudia P. Paz developed the idea, conducted fieldwork, analysed the data and wrote the manuscript. Miriam Goosem and Susan Laurance helped with developing the idea, they collected vegetation data, and assisted with writing and editing the manuscript. Michael Bird, Rod Fensham, Steve Goosem and Noel Preece helped in discussing, editing and writing the manuscript. Susan G W Laurance guided all the work that made this thesis possible and read the entire thesis. Miriam Goosem and Michael Bird also read and helped with editing all the chapters.. I, Claudia P. Paz, was granted the James Cook University Postgraduate Research Scholarship. Funding for my research came from the ARC Linkage Grant LP110201093 awarded to Susan GW Laurance, Rod Fensham, William Laurance, Steve Goosem, and Noel Preece from the Australian Research Council, Queensland Herbarium, Wet Tropics Management Authority and Biome5 Pty Ltd. Field and laboratory work was also supported by a Wet Tropics Management Authority Student Research Grant to Claudia P. Paz.. ix.
(11) General Abstract. Tropical forests are biologically diverse and vital for their contribution to global biogeochemical cycles. However, agricultural expansion has led to the devastation of more than half of forests worldwide. In order to accelerate forest regeneration to provide habitat and ecosystem services, we need to observe what limits natural recovery in order to understand the regeneration process. In that context, secondary forests provide a means to increase forested area. Here, I refer to secondary forests as the spontaneous regrowth of vegetation after major disturbances without human intervention. By studying the regeneration of degraded lands, ecologists should be able to observe patterns of changes, make predictions and determine the potential for recovery and, if necessary, propose interventions to accelerate the recovery process. Soil condition is one major factor expected to limit forest recovery. However, the resilience of different types of soil to disturbance is still a matter of uncertainty. Chemical, physical and biological alteration could result in negative impacts on plant growth, as well the structure and composition of plant communities, with potential consequences for pathways of secondary forest recovery. In this context, my doctoral thesis investigates the patterns of secondary forest recovery in two contrasting soil types nearby the Australian Wet Tropics bioregion. Along a total 45 sites (33 secondary forest, 6 pastures and 6 mature forest sites), I documented changes in soil properties, woody plant vegetation, soil organic carbon stocks and arbuscular mycorrhizal communities and asked whether the different substrates affect the pathways of secondary forest recovery. To achieve my goals, I prepared a literature review where I observed that numbers of species in long chronosequences (>40 years) tended to plateau following a rapid increase in the first 20 years after land abandonment, but found only nine. x.
(12) chronosequences that were older than 45 years that fitted the selection criteria. Even though the number of species tended to increase with forest age, more than half of the studies (56%) reported low floristic similarity between the oldest secondary forest and mature phase forests. Soil fertility and parent material were only directly investigated in four studies, indicating the scarcity of evidence on the relationship between soil properties and secondary forest regeneration. To answer my research questions, I collected extensive field data to address questions on the above- and below-ground changes in the biophysical environment after pasture abandonment. Firstly, I used as response variables, nine measures of woody vegetation recovery, representing structural, functional and compositional parameters to demonstrate that species diversity and species dominance showed distinct patterns of recovery in the two soil types. The community composition was also significantly different between basalt and granite soils. I conclude that time since abandonment is crucial for secondary forest recovery, however, soil types may influence the composition of the community that is able to reestablish. Spatial distribution of surrounding mature forest may also affect the rate of recovery. Contrary to my expectation, the poorer and sandier granite-based soil showed faster rates of species recovery compared with the more nutrient-rich basalt soils. Increasing woody species diversity was associated with increasing dominance, which may indicate a positive effect of the early establishment of dominant species on later successional species. The effect of soil type suggested that soil condition was important for the rate of forest recovery, yet in needs to be considered in context with the greater landscape as in a parallel study my collaborators and I found that distance to mature forests was also important for the forest recovery rates. Secondly, I was interested in the below-ground recovery of secondary forests, with a special focus on the most common plant mutualist: the arbuscular mycorrhizal fungi. In this chapter, I investigated changes in the arbuscular mycorrhizal fungi (AMF) community of. xi.
(13) secondary forests and their association with edaphic and vegetation properties. Despite the importance of AMF for plant nutrition and soil structure, little is known about their diversity in successional forests and the environmental factors that shape AMF communities during succession. I found that mature forest on the poorer soil had significantly higher AMF richness than mature forests on the more fertile soil. However, secondary forests on the more fertile soil tended to present higher AMF richness compared to the secondary forests on the poorer soils. The relatively greater species richness in mature forest on granite derived soils agrees with predictions that plant communities in less fertile soils are more dependent on mycorrhizal associations, however in secondary forests the trend did not hold. Soil pH and total phosphorous were the best environmental predictors of AMF richness and community composition. Thirdly, I investigated another below ground component, which represents an important ecosystem function played by forest soils: the soil organic carbon stocks. For this study, I estimated soil carbon stocks in the two soil types to allow comparisons before and after pasture abandonment. Secondary forests around the world have been found to recover aboveground biomass stocks relatively fast compared with species diversity and composition. However, soil organic carbon stocks do not always replicate stand age or above-ground biomass accrual. I asked whether soil and vegetation parameters are better predictors of soil carbon stocks than secondary forest age and if soil type influenced these relationships. I found that, in comparison with basalt soils, granite soils tend to accumulate SOC stocks and recover their isotopic composition at faster rates during forest succession. However, basalt soils tend to maintain higher SOC stocks after pasture abandonment. SOC variation was best explained by a model that included soil pH, woody species diversity and soil type, with significant changes mostly driven by sites on granitic soils. These results support the idea that predictions of SOC stocks can be improved with the inclusion of basic information on vegetation cover and soil type.. xii.
(14) To summarise, I found that nutritional and textural differences between soil types remain during forest succession, indicating that the major edaphic properties of some parent materials remain little or unaffected after long-term agricultural use. As expected, woody plant communities, mycorrhizal fungi, and soil carbon stocks seem to respond to such soil type differences at local scales, even though the variability within sites and successional categories suggest a strong idiosyncratic nature to secondary forest regeneration processes. Continued investigation of the interactions of plants, fungi and the mechanisms that stabilise C in the soil will likely produce further theoretical and practical ecological evidence to improve the understanding of secondary forest regeneration. Although primary forests may be irreplaceable, abandoned lands have a great capacity to become biologically and functionally rich systems again.. xiii.
(15) Table of contents. Dedication ................................................................................................................................................... iv Acknowledgments ........................................................................................................................................v Statement of contribution ........................................................................................................................ viii General Abstract .......................................................................................................................................... x Table of contents....................................................................................................................................... xiv List of tables .............................................................................................................................................. 16 List of figures ............................................................................................................................................. 18 CHAPTER 1 ................................................................................................................................................. 21 GENERAL INTRODUCTION ................................................................................................................................. 21 1.1 Thesis scope and structure ................................................................................................................... 22 1.2 Summary of Chapter 2 ......................................................................................................................... 25 1.3 Summary of Chapter 3 ......................................................................................................................... 26 1.4 Summary of Chapter 4 ......................................................................................................................... 28 1.5 Summary of Chapter 5 ......................................................................................................................... 28 1.6 Summary of Chapter 6 ......................................................................................................................... 29 CHAPTER 2 ................................................................................................................................................. 30 SECONDARY FOREST REGENERATION ACROSS THE TROPICS: SUCCESSIONAL PATHWAYS AND DRIVERS ................................ 30 Abstract...................................................................................................................................................... 30 Keywords: literature review, regrowth forest, plant diversity, forest succession ...................................... 31 2.1 Introduction ......................................................................................................................................... 31 2.2 Methods ............................................................................................................................................... 34 2.3 Results .................................................................................................................................................. 35 2.4 Discussion............................................................................................................................................. 42 2.5 Conclusion ............................................................................................................................................ 47 CHAPTER 3 ................................................................................................................................................. 49 DOES SOIL TYPE AFFECT WOODY PLANT COMMUNITY RECOVERY DURING SECONDARY FOREST SUCCESSION? ...................... 49 Abstract...................................................................................................................................................... 49 Keywords: rainforest regeneration, parent material, chronosequence, successional pathways. .............. 50 3.1 Introduction ......................................................................................................................................... 50 3.2 Methods ............................................................................................................................................... 52 3.3 Results .................................................................................................................................................. 57 3.4 Discussion............................................................................................................................................. 68 3.5 Conclusion ............................................................................................................................................ 72. xiv.
(16) CHAPTER 4 ................................................................................................................................................. 82 THE EFFECTS OF SOIL TYPES ON ARBUSCULAR MYCORRHIZAL COMMUNITIES DURING TROPICAL FOREST SUCCESSION ............ 82 Abstract...................................................................................................................................................... 82 Keywords: rainforest succession, plant-fungi interaction, parent material, abandoned pasture .............. 83 4.1 Introduction ......................................................................................................................................... 83 4.2 Methods ............................................................................................................................................... 85 4.3 Results .................................................................................................................................................. 90 4.4 Discussion........................................................................................................................................... 101 4.5 Conclusion .......................................................................................................................................... 107 4.6 Supporting material ........................................................................................................................... 108 CHAPTER 5 ............................................................................................................................................... 113 SOIL TYPES INFLUENCE PREDICTIONS OF SOIL CARBON STOCK RECOVERY IN TROPICAL SECONDARY FORESTS...................... 113 Abstract.................................................................................................................................................... 113 Keywords: Soil organic carbon (SOC); regrowth forests; abandoned pastures; Wet Tropics; Australia . 114 5.1 Introduction ....................................................................................................................................... 114 5.2 Methods ............................................................................................................................................. 114 5.3 Results ................................................................................................................................................ 124 5.4 Discussion........................................................................................................................................... 132 5.5 Conclusion .......................................................................................................................................... 136 5.6 Supporting material ........................................................................................................................... 138 CHAPTER 6 ............................................................................................................................................... 144 GENERAL CONCLUSION................................................................................................................................... 144 REFERENCES ............................................................................................................................................. 150 APPENDIX ................................................................................................................................................ 176. xv.
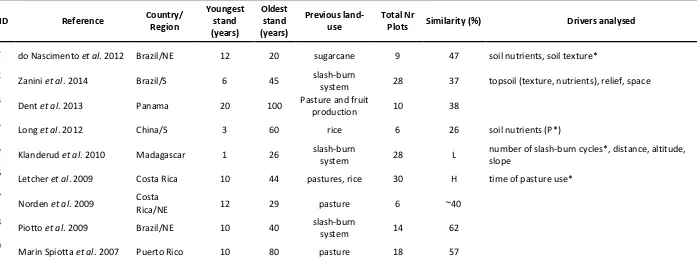
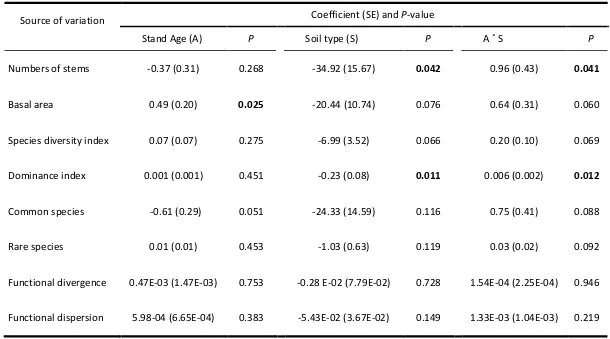
(17) List of tables. Table 1. List of studies included in the literature review on chronosequences (space-for-time substitution approach) of secondary forests in tropical and subtropical regions. Full citations are provided in References. Species similarity refers to tree community similarities between oldest secondary forests and reference sites (e.g. mature forest). Drivers analysed refers to environmental drivers other than stand age (years since land abandonment) that were investigated in each study. Drivers with an asterisk indicate the ones that were considered as relevant/significant for secondary forest regeneration. ‘L’ refers to ‘low similarity’ and ‘H’ refers to ‘high similarity…………….38 Table 2. Generalised linear mixed models of species diversity (Fisher’s α), species dominance (Simpson’s index), numbers of stems, number of rare species, relative abundance of common species, functional divergence and functional dispersion in relation to forest age, soil types and distance from remnant forest fragment in NE Queensland, Australia. P-values significant at α = 0.05 are in bold. Degrees of freedom for all models = 15….…………………………………………………………………………………………………………61 Table 3. Permutational ANOVA comparisons of woody community composition (count-based) in secondary forest sites in NE Queensland, Australia as a function of stand age (years), soil types, distance from forest remnant and the interactions between these factors. Three subsets of the data were considered separately: the complete community, which includes all 141 woody species; a sub-group of common species, which includes only species with more than 50 individuals in total; and a sub-group of rare species, which includes only species that had less than 5 individuals. P-values in bold are significant at α = 0.05…………………………………………………………… ………………..67 Table 4. Linear model analysis comparing mean numbers of arbuscular mycorrhizal fungi (AMF) virtual taxa (VT) between soil types (basalt vs granite) and forest categories younger secondary forest (<30 years since pasture abandonment), older secondary forests (>31 years) and mature forest (uncleared) in North Queensland, Australia. Power transformation (Box Cox) was applied to numbers of taxa………………………….91. 16.
(18) Table 5. Comparison of each family of arbuscular mycorrhizal fungi across secondary and mature forests in two soil types. Values correspond to frequency of taxa in each case (percentage), total number of taxa in each family and Pearson’s Chi quare tests. Bonferroni’s correction for multiple comparisons was applied. Significance at alpha= 0.006 (in bold). B= basalt, G= granite, Y= young secondary forest, O= old secondary forest, M= mature rainforest, na= not applicable.………………………………………….……….94 Table 6. Effects of forest category (young secondary forest <30 years since pasture abandonment, old secondary forests >31 years, mature uncleared forest) and soil types (basalt and granite) on arbuscular mycorrhizal fungi community composition (Permutational ANOVA) in North Queensland, Australia………………………………………..95 Table 7. Mean (±1 standard deviation) for soil organic carbon (SOC) stock values estimated for soil from 0-30 cm depth and δ 13C (0-10 cm depth) from four vegetation types (VT): active pastures (AP), two categories of secondary forest (SF1 <30 years, SF2 ≥ 31 years) and mature forest (MF) in two soil types (basalt and granite) from the Atherton Tablelands (Northeast Queensland, Australia). ANOVA type II was used to compare vegetation and soil types. Generalised linear models were used to compare secondary forests sites only, with stand age as continuous variable. P-values ≤ 0.05 are in bold…………………………………………………………………………………………………………….124 Table 8. Comparison of four alternative multiple linear models to explain variations in soil organic carbon (SOC) stocks from 0-30 cm depth in secondary forests on the Atherton Tablelands (Northeast Queensland, Australia). The first three models are presented sequentially from lowest to highest corrected Akaike Information Criteria (AICc) values. Only models with ΔAICc (difference between one estimated AICc and the lowest AICc) lower than 4 are shown. The final model (Mod1) shows the full model with all soil and vegetation predictors included…..………………………………….129. 17.
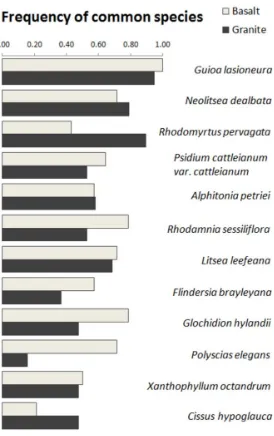
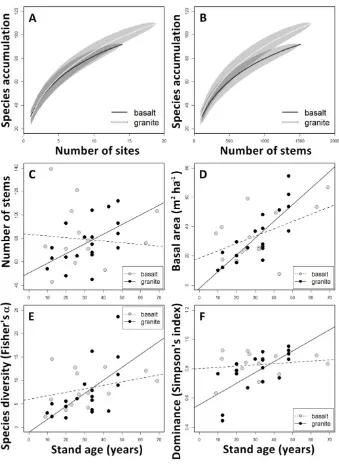
(19) List of figures. Figure 1. Distribution of study sites in the landscape and overview of active pastures and secondary forests at different successional stages in Atherton Tableland, Northeastern Queensland, Australia. Photo: CP Paz.......................................................... 24 Figure 2. Soil samples (10- 30 cm depth) from secondary forest sites on basalt soil (top row) and granite (bottom row) in Atherton Tableland, North-eastern Queensland, Australia. Samples are organized by stand age, whereas the last three samples in each row are from mature forest stands. Photo: CP Paz. ......................................... 25 Figure 3. Interior of secondary forests at different successional stages. From 12.5 years since pasture abandonment (A), 20 years (B and C), 34 years (D-F), 41 years (G) to mature phase, forests (H and I) in Atherton Tableland, North-eastern Queensland, Australia. Photo: CP Paz ............................................................................................................ 27 Figure 4. Number of tree species in relation to secondary forest stand age (years since land abandonment) in chronosequences across tropical and subtropical regions. Numbers in the legends refer to identification codes according to Table 1 – each number is a different study considered in the review. Chronosequences were separated according to criteria for inclusion of stems (dbh= diameter at breast height). Solid lines refer to circles and dashed lines refer to triangles from the respective color. ........................................................................................................ 39 Figure 5. Number of tree species in relation to secondary forest stand age (years since land abandonment) and old-growth reference sites (OG) in chronosequences across tropical and subtropical region. Numbers in the legends refer to identification codes according to Table 1 – each number is a different study considered in the review. Solid lines refer to circles and dashed lines refer to triangles from the respective color. ......................................................................................................................... 40 Figure 6. Frequency of studies that explored the relationship between woody plant species recovery and (A) environmental parameter (study may include one or more drivers) and (B) the environmental parameters with significant association ........................ 41 Figure 7. Frequency of the most common species from both soil types. Frequency= 1 indicates that a species occurred in all sites. ........................................................................... 59 Figure 8. (A) Site-based and (B) individuals-based species accumulation curves for secondary forest on two soil types (shaded area is 95% confidence interval). (C) Number of. 18.
(20) woody stems, (D) Basal area (m2 ha-1) (E) Species diversity (Fisher’s α) and (F) Species dominance (Simpson’s index) across secondary forest age (years since pasture abandonment) on two soil types in northeast Queensland, Australia. ....... 62 Figure 9. Number of (A) stems of the twelve most frequent species and (B) rare species (species with less than 5 individuals in total) in relation to secondary forest stand age on two soil types in NE Queensland, Australia................................................... 63 Figure 10. Relationships between functional diversity components in relation to secondary forest age (years since land abandonment) on two soil types in NE Queensland, Australia. ................................................................................................................... 64 Figure 11. Community composition analyses based on nonmetric multidimensional scaling ordinations (2D) for (A) entire woody plant community; (B) commonspecies and (C) Rare species, in secondary forests in NE Queensland, Australia. Arrows next to ordination axes indicate the direction of increase in distance from forest remnant or stand age when they were significantly correlated with the axis. ....................... 66 Figure 12. Mean numbers of virtual taxa of arbuscular mycorrhizal (AM) fungi in forest categories: young secondary forest (<30 years since pasture abandonment), old secondary forest (>31 years) and mature forest (never cleared). Species (virtual taxa) rarefaction curves according to B: number of DNA sequence reads and C: number of forest sites in two soil types (basalt and granite) in North Queensland, Australia. ................................................................................................................... 93 Figure 13. Distribution of the community of arbuscular mycorrhizal (AM) fungi (presenceabsence) from secondary and mature forest site in the two main constrained axes from CAP (Constrained Analysis of Principal Coordinates). (A) AMF taxa are colored according to taxonomic family. (B) Distribution of study sites in AMF species space. Arrows indicate the direction of change in distance from forest fragment (Dist), clay content, soil pH, soil nutrients (total N, P and K), leaf-litter mass, number of woody species (Veg), woody species dominance (Dom) and basal area (BA) of woody stems >2.5 cm dbh in soil types in North Queensland, Australia. Sites on basalt soil are in gray and granite in black. Different shapes represent successional stages: squares = young secondary forest (<30 years), diamonds= old secondary forest (>31 years) and circles = mature forest. ...................................................................................... 97 Figure 14. Patterns of arbuscular mycorrhizal fungi (AMF) virtual taxa (VT) richness change according to environmental predictors in two soil types in North Queensland, Australia. R2 represents the fitness of the full model; ‘v’ indicates the regression estimate and significance of the environmental predictor of the linear model in 19.
(21) question; ‘st’ indicates the estimate and significance of soil type; ‘v x st’ indicates the estimates and significance of the interaction between environmental predictor and soil type. * P<0.05, ms= marginally significant (P<0.07), ns=not significant at α=0.05. ...................................................................................................................... 99 Figure 15. Non-metric multidimensional scaling (NMDS, k=2) ordination plot showing similarity (distances between points) in basalt and granite soils. Symbols that are closer together have greater similarity in community composition. Lines between symbols connect the paired arbuscular mycorrhizal fungi (AMF) and woody plant communities at each site (young secondary forests were <30 years since pasture abandonment, old secondary forests were >31 years and mature forests were never cleared). ........................................................................................................ 101 Figure 16. Map indicating study site location, site type (active pastures, secondary forests and reference mature forest), soil derivation of each site (basaltic or granitic parent material) and the area of secondary forest and remnant mature rainforest. ........ 120 Figure 17. (A) Soil organic carbon (SOC) stocks at 0-30 cm depth and (B) δ 13C at 0-10 cm depth from active pastures (AP, diamond symbols), secondary forest (circles) and mature forest (MF, triangles) in basalt (gray symbols) and granite (black symbols) soil types. Active pasture and mature forests were not included in the regression model. ... 127 Figure 18. Partial regression of best supported variables that affect SOC stock variation in secondary forests. Variables were selected based on corrected Akaike’s Criterion Information (AICc and ΔAICc) from multiple regression models. ........................... 131. 20.
(22) Chapter 1. General Introduction. Tropical forests are biologically diverse and vital for their contribution to global biogeochemical cycles (Bunker et al. 2005, McGroddy and Silver 2011). However, increasing human populations and the need for agricultural expansion have led to the devastation of more than half of forest ecosystems worldwide (Blaser et al. 2011). Deforestation is the main driver of habitat loss and contributes to the elevated rates of CO2 emissions in the atmosphere. This has raised concerns globally for the future of forests especially in the light of global climate change (Laurance et al. 2012, FCCC 2015). Currently, primary forests comprise approximately 50% of their original area in the tropics, with degraded and logged forests rapidly dominating the landscapes (Blaser et al. 2011). Understanding regeneration processes becomes, therefore, crucial to overcoming the ecological and economic issues related to forest loss (Lamb et al. 2005, Chazdon 2008, 2014). Secondary forests play a key role in recovering habitats and providing essential ecosystem services. By definition, secondary forest refers to the spontaneous regrowth of vegetation after major disturbances (e.g. forest clearing or agricultural use), and such forests are proliferating as land abandonment increases (Corlett 1994, Cramer et al. 2008). A common cause of land abandonment is a reduction in soil productivity (Munroe et al. 2013). In the tropics soils tend to be highly weathered and less fertile, which can lead to land abandonment after only a few years of use (Benayas et al. 2007, Verheye 2008). This shifting cultivation results in more forest clearing as farmers move to new areas with more fertile soils. Continuous forest clearing and abandonment have contributed to the expansion of secondary forests, which currently occupy an estimated 5 hundred million hectares across the tropics. 21.
(23) (ITTO 2002, Chazdon 2014). Despite increasing interest in secondary forests, successional changes in these forests are rarely studied over the long term, and this applies particularly to soils (Chazdon et al. 2007, Marín-Spiotta and Sharma 2013, Poorter et al. 2016) and to the Australasian region. Alterations in soil condition are one of the factors that can limit forest recovery (Hooper et al. 2005, Holl et al. 2000, Cramer et al. 2008, Flynn et al. 2010). However, despite evidence showing that forest clearing and agriculture alter soil fertility and structure (Lal 2004, Defries et al. 2004, Cameron and Moir 2013), the resilience of different types of soil to disturbance is still a matter of uncertainty (Holl 1999, Fortini et al. 2010). The negative effects of a degraded soil could continue to influence plant growth from seed to adulthood. For instance, high soil compaction reduces soil porosity and moisture holding capacity, which can be detrimental for nutrient cycles and root penetration, affecting plant establishment and growth (O´Sullivan and Simota 1995, Greacen and Sands 1980). At the community level, alterations in soil moisture and nutrients affect the balance of competition and facilitation between and within species (Callaway and Walker 1997, Connell and Slatyer 1977) with potential consequences for pathways of secondary forest recovery (Cramer et al. 2008).. 1.1 Thesis scope and structure. This doctoral thesis investigates the patterns of secondary forest recovery in two contrasting soil types within the Wet Tropics bioregion of Australia, much of which has been listed as a World Heritage Area (Fig. 1), as a hotspot for conservation (Mittermeier et al. 2011, Goosem et al. 1999). Along secondary forest chronosequences, I have documented changes in soil properties, woody plant vegetation, soil organic carbon stocks and arbuscular mycorrhizal communities. Due to the occurrence of two major soil types (Fig. 2), I have queried whether different substrates affect pathways of secondary forest recovery (Fig. 3). Based on ecological. 22.
(24) theory and empirical data I believe my research will contribute to a deeper understanding of natural succession of secondary forests and some of the factors related to this process. This thesis is organized into six chapters: this introduction, a literature review, three empirical chapters that have been prepared for submission to peer-reviewed ecological journals, and a general conclusion chapter. The data chapters have been planned as stand-alone manuscripts for publication and may contain some repetition in methods. Supplementary data or results are presented at the end of each chapter, when necessary, whereas the appendix contains the copies of previously published work that used part of the data from this thesis. Below, I present a synthesis of the major findings of each chapter.. 23.
(25) Figure 1. Distribution of study sites in the landscape and overview of active pastures and secondary forests at different successional stages in Atherton Tableland, North-eastern Queensland, Australia. Photo: CP Paz. 24.
(26) Figure 2 Soil samples (10- 30 cm depth) from secondary forest sites on basalt soil (top row) and granite (bottom row) in Atherton Tableland, North-eastern Queensland, Australia. Samples are organized by stand age, whereas the last three samples in each row are from mature forest stands. Photo: CP Paz.. 1.2 Summary of Chapter 2: Secondary forest regeneration across the tropics: successional pathways and drivers. This chapter is a literature review on secondary forest chronosequences across the tropics to be submitted for publication. Chronosequences, also known as space-for-time substitution approach, have been a useful tool to investigate secondary forest dynamics (Walker et al. 2010). My main goal was to review published studies that have documented patterns of woody plant changes after land abandonment taking into account the rate of species accumulation, convergence in floristic composition and factors that were found to influence the patterns of regeneration. The review highlighted some important ecological patterns and also detected gaps in our understanding of rainforest succession that could be explored in the future. Based on the 25.
(27) data from 17 publications, selected by specific criteria, I found that the majority (88%) of chronosequence studies were located in the Neotropics, indicating several gaps in knowledge, including the Australian tropical forests.. 1.3 Summary of Chapter 3: Does soil type affect woody plant community recovery during secondary forest succession?. This is an original data chapter that has been prepared for submission to Plant Ecology and Diversity. Two collaborative publications were generated using part of the dataset from this chapter (Tng et al. 2015, Goosem et al. 2016; copies of the full articles in Appendix). This chapter presents novel information on the research of secondary forest recovery patterns, where the effects of soil types and their properties are explored. My aim was to investigate secondary forest recovery patterns in the two dominant, contrasting soil types in the study area (basalt- and granite- derived soils). I have analysed nine measures of woody vegetation recovery, representing structural, functional and compositional parameters to examine the influences of soil type and stand age on secondary forest recovery.. 26.
(28) Figure 3. Interior of secondary forests at different successional stages. From 12.5 years since pasture abandonment (A), 20 years (B and C), 34 years (D-F), 41 years (G) to mature phase, forests (H and I) in Atherton Tableland, North-eastern Queensland, Australia. Photo: CP Paz. 27.
(29) 1.4 Summary of Chapter 4: The effects of soil types on arbuscular mycorrhizal communities during tropical forest succession. In the next two chapters, I shift the focus away from vegetation recovery to explore two aspects of below-ground recovery in secondary forests. In this fourth chapter, I investigate changes in the arbuscular mycorrhizal fungi community of secondary forests and their association with edaphic and vegetation properties. This is an original data chapter that has been prepared for submission to Oecologia. Despite the ecological importance of AMF, little is known about their diversity in successional forests and the environmental factors that shape AMF communities during succession (Davison et al. 2015).. 1.5 Summary of Chapter 5: Soil types influence soil carbon stock recovery in tropical secondary forests. In the last data chapter, I investigate an important ecosystem function played by forest soils: the sequestration of organic carbon. For this study, I estimated soil carbon stocks in the two soil types to allow comparisons before and after pasture abandonment. A version of this original data chapter is in review at Forest Ecology and Management. Tropical forests are major carbon (C) sinks both above- and below-ground. Secondary forests have been found to recover above-ground biomass stocks to historical levels in a few decades (Poorter et al. 2016). However, changes in soil organic carbon (SOC) stocks do not consistently follow stand age or above-ground biomass accrual (Marin-Spiotta and Sharma 2013). I asked whether soil organic carbon (SOC) stocks and dynamics change with secondary forest age in two contrasting soil types analysing soil and vegetation parameters (e.g. soil texture and acidity, woody species diversity and basal area) to determine the best predictors of SOC stock changes.. 28.
(30) 1.6 Summary of Chapter 6: General conclusion. In this last chapter I summarise and integrate the main findings from the data chapters. Based on my own data and previous studies I discuss some of the implications of this research for forest management and suggest future directions for investigation.. 29.
(31) Chapter 2. Secondary forest regeneration across the tropics: successional pathways and drivers. Abstract. Secondary forests are now a dominant feature of tropical landscapes with approximately 500 million ha distributed globally. These regenerating forest communities are expected to recover to mature forests, however, despite numerous studies, the time and trajectories to recovery are still unpredictable, and may depend upon many biotic and abiotic factors. Here I review the published literature to provide an overview of our current knowledge on the regeneration of woody plant species in secondary forests with respect to the rate of species accumulation, convergence in floristic composition and factors found to influence the patterns of regeneration. I searched for articles that documented woody species accumulation in secondary forests with different ages since land abandonment and compared them with local mature phase forests. I focused on the following study characteristics, which was also the criteria to include articles in my review: secondary forest ages, location, number of sites/replicates, sampling criteria for vegetation inclusion (i.e. all trees ≥ 10 cm dbh), number of woody species per forest age category, floristic similarity between older secondary and reference forests as well as the biotic and abiotic factors that were found to be affecting woody species recovery. From 211 published articles which mentioned these factors, I considered 67 and included 17 publications that met all criteria. Secondary forest chronosequences (‘space-for-time substitution’ approach) ranged in length from 8 to 80 years. 30.
(32) with the majority (88%) located in the Neotropics. The number of woody plant species increased with time in most forest chronosequences, regardless of the type of previous landuse, the initial number of woody species in the youngest stand or the length of chronosequence age. Species gain in long chronosequences (>40 years) tended to plateau following a rapid increase in the first 20 years after land abandonment. However, only nine selected chronosequences were older than 45 years. More than half of the studies (56%) reported low floristic similarity between the oldest secondary forest and reference sites. The environmental drivers of such patterns remain less well explored in these studies, as only 47% analysed changes through time. Distance from forest fragment was the most-studied factor, showing a small influence on species number increase and community composition convergence. Although often mentioned as influential factors, environmental features, such as soil fertility (e.g. nutrient limitation) or the soil type (e.g. parent material) were directly investigated in only four studies. This gap in the understanding of rainforest succession should be explored in the future.. Keywords: literature review, regrowth forest, plant diversity, forest succession. 2.1 Introduction. Secondary forests are dominating the tropical landscape. Currently, over 60% of tropical forest area (ca. 500 million ha) is regenerating from different forest disturbances, such as logging, clearing and agricultural use, which are likely to affect their patterns of recovery (ITTO 2002, Blaser et al. 2011). For instance, forest clearings and abandoned agricultural fields are known to cause larger negative impacts as they transform the ecosystem completely, by removing the native vegetation and introducing foraging or crop species (Corlett 1994). The eventual abandonment of lands plays a crucial role for the recovery of above- and belowground carbon stocks, the recuperation of water and nutrient cycles and return of biodiversity.. 31.
(33) However, while some of these ecosystem components can be predicted across regions (e.g. above-ground biomass), the recovery of plant communities may follow different trajectories, as they are influenced by a range of environmental and biological factors (Johnson et al. 2001, Martin et al. 2013). It is broadly accepted that once cleared lands are abandoned, it is possible that the vegetation community may not return to the original composition, remaining in alternative or arrested states (Cramer et al. 2008, Lindenmayer et al. 2008, Lugo and Helmer 2004, Lugo 2009). The type of land use and its management intensity are legacies of human land use that have been identified as important drivers of successional trajectories (Cramer et al. 2008, Buschbacher et al. 1988; Nepstad et al. 1991, Uhl 1987, Mesquita et al. 2001, Norden et al. 2011). Mesquita et al. (2001) made an important contribution in this field by determining that fire management of tropical pastures in central Amazon, significantly influenced the different regeneration pathways of pioneer species in secondary forests. Abandoned pastures that were unburnt were initially dominated by pioneer trees of the genus Cecropia, whereas burned pastures were dominated by Vismia spp. (Mesquita et al. 2001). These early differences in forest regeneration subsequently influenced recovery trajectories with the Cecropiadominated forests accruing plant species at faster rate than Vismia-dominated forests (Mesquita et al. 2001, Norden et al. 2011). Despite taking different trajectories over time, these forests could in the long-term converge to a similar composition and become ecologically comparable to surrounding mature forest. Secondary forest recovery can also be influenced by the area and distance to mature rainforest (Holl 2000, Chazdon 2008; Hooper et al. 2005, 2004, Dalling and Denslow 1998, Standish et al. 2007, Wijdeven and Kuzee 2000). The majority of plant species in rainforests are vertebrate-dispersed. Hence the capacity of these vertebrates to move through cleared landscapes can be a severe obstacle to seed dispersal and recruitment. As a result, a faster. 32.
(34) rate of recovery has been observed in secondary forests close to larger areas of mature forest compared with secondary forests farther from mature forests (Sloan et al. 2015). Soil alterations due to forest conversion and land-use can transform habitats by causing nutrient limitation, susceptibility to drought stress (Tilman, 1987) and low survival of the soil seed bank (Guariguata and Ostertag 2001). Cultivation practices can have different long-term responses on soil C and nutrient accumulation, which may reflect in the time required for forest biomass to recover (Fernandes and Sanford 1995, Hughes et al. 1999, Smith et al. 1999, Silver et al. 2000). A degraded soil condition caused by physical and chemical alteration together with invasion of exotic species can be highly negative for secondary forest regeneration (Peltzer et al. 2010). Dominance of exotic species, particularly grasses, at early stages of abandonment is expected to cause either successional delays or arrest the recovery process (Goldsmith et al. 2011). Exotic grass species are often highly competitive because they can be efficient resource users and they have escaped their natural predators (Bakker and Wilson 2004, Mitchell et al. 2006). These characteristics provide advantages that allow nonnative species to grow, reproduce and suppress native species (Peltzer et al. 2010). Non-native trees, however, may be different, as Lugo (2004) reported that non-native trees can be essential for land regeneration where otherwise abandoned pastures remain in an arrested state of succession. Lugo suggests that often exotic species can tolerate the altered soil condition and therefore their establishment can facilitate the recruitment of late-successional native species. Native and non-native species may then coexist and develop a new category of ecosystem called ‘novel ecosystems’ (Hobbs et al. 2006, Cramer et al. 2008 Lugo 2009). Despite increasing understanding of the local mechanisms driving secondary succession, the trajectories and final outcomes of community regeneration are still unpredictable. It is unclear whether environmental drivers have been satisfactorily explored in order to demonstrate strong association with such changes. In this context, secondary forest chronosequences (space-for-time substitution) have been used worldwide and offer a good. 33.
(35) opportunity to investigate forest successional pathways when long-term monitoring plots are not available (Prach and Walker 2011). To evaluate trends in secondary forest succession research and detect knowledge gaps, I performed a review of publications on secondary forest chronosequences across tropical and subtropical regions. To my knowledge, this is the first attempt to systematically examine the empirical evidence available from secondary forest changes in tree communities, taking into account the successional pathways and drivers that have been considered relevant. More specifically I asked three questions: (1) What are the patterns of woody plant species accumulation in secondary forests? (2) Are woody plant communities converging towards a mature forest composition? and (3) Which environmental drivers are associated with accumulation of woody plant species in secondary forests?. 2.2 Methods. I searched for peer-reviewed indexed publications from the last 30 years (1985 to 2015) on Web of Science (www.webofknowledge.com) using keywords that would capture the maximum number of studies across the wet/moist tropics. Combinations of keywords included the following terms: ‘secondary forest’, ‘regrowth forest’, ‘successional forests*’, ‘tropic*’, ‘recovery’, ‘succession*’, ‘pathway’, ‘trajectory’ and ‘chronosequence’. As my questions were related to patterns of woody plant species accumulation and community convergence, I systematically reviewed the publications that reported in their abstract some ecological measure of these parameters, such as species number, species richness and comparisons among community assemblages. Once selected the articles, I took note of the length of the chronosequence, region/country, criteria for inclusion of vegetation (e.g. all trees ≥ 10 cm dbh), number of sites/replicates, number of tree species per age category, floristic similarity between older secondary forests and mature forests as well as the factors that were found to be affecting tree species recovery. I also recorded the environmental factors that were 34.
(36) considered to be driving such changes in tree species accumulation, convergence or similarities in floristic composition. Studies that included other measures of forest development (e.g. above-ground biomass accumulation) were considered, however only species number/richness was reported, as variables of interest for this review. For this review we did not include studies on tree plantations or enriched secondary forests, regeneration in forest gaps or regeneration from low impact forest disturbances (Lamb 2011). To address my first question on the patterns of accumulation of woody plant species through time, I determined species richness at each secondary forest stand or category, based on the time (years) since land abandonment. Number of species was standardized by stem number and when data were extracted directly from rarified species curves, the smallest number of stems was used. When secondary forest sites were classified into age categories I used the mean age for each category, otherwise I considered the actual stand age. I plotted number of species against time since abandonment and compared fitted curves among forest chronosequences. To investigate the woody plant community convergence during the regeneration process, my second question, I asked whether the oldest secondary forest sites were similar to reference forests (referred to in these studies as mature forest, primary forest or old-growth forest). I sought indices of dis/similarity or percentage of shared species to obtain a quantitative measure of community convergence. When a similarity value was not accessible, I obtained a “low” or “high” similarity/convergence index, based on the authors’ interpretation. To answer the third question about the environmental factors that could be influencing accumulation of woody plant species, I noted the type of predictor/driver in question and whether it was positive, negative or neutrally associated with the response variable in question.. 2.3 Results. 35.
(37) From 211 articles selected by the keywords I selected to review 67 papers and included 17 publications to my final analysis. Three of the publications had analysed two distinct chronosequences, which were considered separately in my comparisons. The length of secondary forest chronosequence (difference between the youngest and oldest secondary forest sites) ranged from 8 to 80 years. Most of the published research was undertaken in the regions of South and Central America (88.2%, n=15). Secondary forest chronosequences occurred predominantly on abandoned lands that were used as grazed pastures (64.7%), or sugarcane, rice, beans and corn, which were mostly cultivated in slash-and-burn systems (Table 1).. 36.
(38) Table 1. List of studies included in the literature review on chronosequences (space-for-time substitution approach) of secondary forests in tropical and subtropical regions. Full citations are provided in References. Species similarity refers to tree community similarities between oldest secondary forests and reference sites (e.g. mature forest). Drivers analysed refers to environmental drivers other than stand age (years since land abandonment) that were investigated in each study. Drivers with an asterisk indicate the ones that were considered as relevant/significant for secondary forest regeneration. ‘L’ refers to ‘low similarity’ and ‘H’ refers to ‘high similarity’.. ID 1 2 3 4 5 6 7 8 9. Reference. Country/ Region. Youngest stand (years). Oldest stand (years). Previous landuse. Total Nr Plots. Similarity (%). sugarcane. 9. 47. soil nutrients, soil texture*. 28. 37. topsoil (texture, nutrients), relief, space. 10. 38. Drivers analysed. do Nascimento et al. 2012. Brazil/NE. 12. 20. Zanini et al. 2014. Brazil/S. 6. 45. Dent et al. 2013. Panama. 20. 100. Long et al. 2012. China/S. 3. 60. rice. 6. 26. Klanderud et al. 2010. Madagascar. 1. 26. slash-burn system. 28. L. number of slash-burn cycles*, distance, altitude, slope. Letcher et al. 2009. Costa Rica. 10. 44. pastures, rice. 30. H. time of pasture use*. Norden et al. 2009. Costa Rica/NE. 12. 29. pasture. 6. ~40. Piotto et al. 2009. Brazil/NE. 10. 40. slash-burn system. 14. 62. Marin Spiotta et al. 2007. Puerto Rico. 10. 80. pasture. 18. 57. slash-burn system Pasture and fruit production. 37. soil nutrients (P*).
(39) 10 11 12 13 14 15 16 17. Howorth et al. 2006. Venezuela. 10. 35. beans, corn. 8. 66. Muniz Castro et al. 2006. Mexico. Peña-Claros et al. 2003. 0.25. 80. pasture. 17, 17. -. Bolivia/W. 2. 40. agriculture. 7, 7. L. Chinea et al. 2002. Puerto Rico. 7. 66. pastures, sugarcane. 33. L. Aide et al. 2000. Puerto Rico. 52. 77. pasture. 28, 22. L. Pascarella et al. 2000. Puerto Rico/SE. 4. 80. pastures. 7. L. land-use history, elevation, distance from remnant forest. Aide et al. 1996. Puerto Rico. 9.5. 60. pasture. 28. L. elevation, distance, soil type. Kappelle et al. 1995. Costa Rica. 8. 32. grazing pasture. 12. 64. 38. land-use types distance from remnant edge. substrate types (parent material).
(40) In general, secondary forest chronosequences showed increasing trends in woody plant richness with time, but the trajectories varied (Fig. 4). Chronosequences with more than 40 years (considered here as long chronosequences) showed logarithmic trends of woody plant species accumulation (Fig. 4). In long chronosequences the highest rate of species accumulation occurred in the first 20 years after land abandonment, followed by a diminishing rate of species accumulation from 20 to 30 years and stabilization or even minor declines in species richness after around 40 years (Fig. 4). Shorter chronosequences (<40 years of age) were more variable. Exponential and linear trends in species accumulation were more likely to be detected in short chronosequences (Fig. 4). When I included reference sites, most chronosequences showed a plateau pattern of species accumulation (Fig. 5). Only one chronosequence demonstrated a slight decreasing tendency in species accumulation, where secondary forests contained a higher number of species than reference sites (Fig 5, case 17).. Figure 4. Number of tree species in relation to secondary forest stand age (years since land abandonment) in chronosequences across tropical and subtropical regions. Numbers in the legends refer to identification codes according to Table 1 – each number is a different study 39.
(41) considered in the review. Chronosequences were separated according to criteria for inclusion of stems (dbh= diameter at breast height). Solid lines refer to circles and dashed lines refer to triangles from the respective color.. Figure 5. Number of tree species in relation to secondary forest stand age (years since land abandonment) and old-growth reference sites (OG) in chronosequences across tropical and subtropical region. Numbers in the legends refer to identification codes according to Table 1 – each number is a different study considered in the review. Solid lines refer to circles and dashed lines refer to triangles from the respective color.. Floristic convergence between old secondary forest and reference sites was reported in most studies. In most (77%) chronosequences studies, authors indicated that the woody plant communities of secondary forests were becoming more similar to reference sites with time. However, only around half of the studies had quantified convergence in floristic composition with some type of similarity index. Woody community similarity between old secondary forests and reference sites ranged from 26 to 66 %, in a variety of measures that may not be totally comparable including: Sorensen index, Chao-Jaccard similarity indicator, Horn similarity or simply by percentage of shared species. In cases where quantitative comparison was not available, floristic convergence was either interpreted as the presence of. 40.
(42) late successional taxa, or the presence of typical primary or endemic species in older secondary forests. Despite being considered convergent, in more than half of the chronosequences (94%, n=16), woody community recovery was considered slow. Secondary forest age was the only parameter used in 41% of the chronosequence studies . Forest age (usually described as the number of years since land abandonment) was in all cases considered a good predictor of woody species increase and community turnover from early successional to mature forest communities. The second most commonly studied factor that could influence woody community recruitment was distance from mature forests (Fig. 6). Yet, distance was a significant predictor in only one study which found it had a surprisingly negative effect on plant species accumulation. This may be due to the distances involved as some of the study sites were highly isolated at >2 km from mature forests. . In the other studies where distance from forest was not significant, the secondary forests were located in close proximity (<300m) to reference forests.. Figure 6. Frequency of studies that explored the relationship between woody plant species recovery and (A) environmental parameter (study may include one or more drivers) and (B) the environmental parameters with significant association. 41.
(43) Topography (e.g. terrain slope, altitude) and soil fertility (e.g. soil nutrients) were investigated in five and three of the studies, respectively. Topography was important in explaining species community changes in one study, while soil fertility was significantly associated with changes in tree communities in two studies. The effects of prior land-use were analysed in three studies (17.6%), whereas land-use intensity and invasion by non-native species were analysed in two studies (11.8%). Land-use type was found to significantly affect the number of species and floristic convergence in two cases, while evidence for land-use intensity was only observed on one chronosequence. The influence of the type of substrate (e.g. parent material) was only evaluated in two chronosequences; with significant effects of these factors in one study each (Fig. 6).. 2.4 Discussion. 2.4.1 Short term studies may overestimate the rate of recovery in secondary forests. Patterns and predictability of changes in woody plant richness appear to be influenced by the length of the secondary forest chronosequence. My review indicates that asymptotic patterns are more likely to be observed in chronosequences longer than 40 years. This finding supports the conclusions of Chazdon et al. (2007), who found that vegetation dynamics within the first 30 years of succession cannot be accurately interpreted in Neotropical secondary forests. Yet it is likely that debates will continue on the rate of recovery in secondary forests because it is challenging to access long chronosequences whilst controlling for land-use types, soil types and distances from remnant mature forests. Hence, our research in secondary forests is constrained by the reality of the available landscape parameters. The age of secondary forest stands comprises the most common way to investigate processes related to forest regeneration. Although the space-for-time approach has been criticized in chronosequence studies because of uncertainty about chronological links 42.
(44) between sites and ages or the ability to replicate successional stages, for the moment it remains the best method available to investigate long-term changes in regrowth communities (Feldpausch et al., 2007). Research using secondary forest chronosequence have demonstrated almost universal trends in the accumulation of biomass and species, reduction in soil erosion and improvement of overall ecosystem quality with forest age (Finegan 1996, Guariguata and Ostertag 2001, Williams-Linera 1983). My review shows that tropical secondary forest chronosequences tend to accumulate woody species with time in quite similar patterns, regardless of the type of prior land-use, the relative number of species or the vegetation size class included. This trend agrees with the equilibrium model of forest succession, where tree species colonization is benefited by changing ecosystem properties, such as increases in shading, moisture and soil organic matter (Bazzaz 1979). Yet, the convergence of plant community composition seems to be low, even after eight decades of land abandonment.. 2.4.2 Limited evidence of floristic convergence during forest succession. My comparisons of older secondary and mature forests show that there is still low resemblance in tree community composition and structure, even after 40 years of succession. The time needed for secondary forests to reach similar floristic composition to mature undisturbed forests has been estimated as low as 70 years (Kappelle et al. 1995), and as high as several centuries (Aide et al. 1996). Accordingly, Gibson et al. (2011) suggested that primary rainforests would, in most cases, be irreplaceable, as typical mature forest communities are not able to establish in secondary forests – at least not in the first century of succession. It is unlikely that we will find a general answer to this question of how long it takes for tropical forest to recover from clearing. First, because there are limitations in different sampling methods and data analysis within secondary and mature forests studies which hinder. 43.
(45) comparisons (Chinea et al. 2002, Howorth et al. 2006). Second, mature rainforests globally differ enormously in floristic diversity and the demographic composition of tree communities (Condit et a.l 2006) which should influence succession rates and recovery time. For example, the hyper-diverse forests of central Amazon and Asia are characterised by a community of mostly late successional species whereas the low diversity communities of Australia and Africa are comprised of many more early successional species (Slik et al. 2015, Condit et al. 2006, Malhi et al. 2013). Biogeographical history and climatic disturbance have played an important role in the demographic characteristics of these species’ pools and as a result we should not expect that convergence rates in secondary and mature forests will coincide. Regional species pools may differ up to an order of magnitude (Slik et al. 2015), and as a result the sampling designs should also differ in order to accurately estimate community composition. Therefore, it is challenging to predict the pathways of plant community succession and to determine when, if ever, they will reassemble to the historical state (Leps and Rejmanek 1991, Cramer et al. 2008). Slow convergence in succession could be explained by multiple factors that could delay the species turnover. Besides seed and recruitment limitation, it has been shown that certain dominant species produce conditions (e.g. thick leaf litter layer, close canopies or abnormal soil acidity) that could help maintaining the growth of the dominant populations (native or non-native) hampering the establishment of successional species (Sarmiento 1997, Ehrenfeld et al. 2005). Most studies in this review reported the presence of non-native species, but testing such reciprocal process has proven challenging. To assume soil condition is limiting for the germination and establishment of recruits is not straightforward, as the increase content of soil organic matter, nitrogen or phosphorus may not directly indicate increasing in soil fertility, therefore higher growth rates (Siddique et al. 2010). In some cases as shown by Siddique et al. (2010), nitrogen and phosphorus fertilization stimulated growth of few pioneer species that rapidly dominated the site reducing species accumulation though time.. 44.
(46) 2.4.3 Environmental drivers of forest successional pathways in long chronosequences. The interest in ecological processes that drive natural forest regeneration has increased as the area of secondary forest increase globally in comparison with mature forest, even though, the landscape changes are not uniform worldwide. Based on the analysis of long chronosequences I observed that distance from mature forests, soil properties, land-use type and intensity were more commonly listed as drivers to explain forest recovery pathways. In order to trace some parallels, I have limited this discussion to chronosequences that are older than 40 years and have included environmental parameters to explain the patterns found (Long et al. 2012, Muniz-Castro et al. 2006, Chinea et al. 2002, Pascarella et al. 2000, Aide et al. 1996). Distance from mature forests has been assumed to influence species accumulation rates. However, we did not find evidence of the influence of distance probably because almost all studied secondary forests were located relatively close to mature forest edges: at or within 50 m (Muniz-Castro et al. 2006, Aide et al. 1996) and within 200 m (Pascarella et al. 2000). Distances from mature forest of more than 500 m were uncommon and often they are not included as a driver of secondary forest recovery. Distances of up to 500 m may be important as 70% of the 11,000 ha of secondary forest in a tropical Australian landscape was within 500 m of mature forests (Sloan et al. 2015). The maximum distance reported in the reviewed literature was 2420 m, and this distance appeared to have a negative effect on the ability of late successional species seeds to arrive at those pastures (Chinea et al. 2002). The effect of distance from mature forests on secondary forest recovery needs to be considered carefully. Secondary forest cover has been observed very high within 200m of a mature forest and declining sharply over the next 800 m in negative exponential pattern (Sloan et al. 2015). Hence, in order to detect how distance influences recovery rates experimental. 45.
Figure


+7


Outline
Related documents
This access door is also used to have access at the potentiometer (manual controller) and electrical supply.. valve pic.1
For occasions when you just don't get the context or at times when you can be more causal you can use the phrase “jag fattar inte” which is somewhat equivalent to the English “I
The document which you are holding in your hands constitutes a multifunction- al guide for the basic services and the ways by which you can benefit from the Helpdesks for
Trans people of color, trans people with disabilities, trans people who are poor or homeless, trans youth, and trans immigrants are particularly vulnerable, especially because
The pith: The pith is relatively narrow of parenchymatous cells contain scattered calcium oxalate clusters, starch granules, and showing also isodiametric stone cells or
The CodeBroker system addresses the cognitive challenges in software reuse: being aware of the existence of reusable components as well as being able to locate the needed
When calculating optimal replacement rates, we use these expected values rather than their actual values since optimal (non-pension, non-social-security) wealth is computed
Insurance companies subject to these rules must establish an anti-money laundering program and start filing Suspicious Activity Reports 180 days after the date of the publication
