This is a repository copy of
Multi-modal signal evolution in birds: re-examining a standard
proxy for sexual selection
.
White Rose Research Online URL for this paper:
http://eprints.whiterose.ac.uk/137965/
Version: Accepted Version
Article:
Cooney, C.R. orcid.org/0000-0002-4872-9146, MacGregor, H.E.A., Seddon, N.
orcid.org/0000-0002-1880-6104 et al. (1 more author) (2018) Multi-modal signal evolution
in birds: re-examining a standard proxy for sexual selection. Proceedings of the Royal
Society B: Biological Sciences, 285 (1889). ISSN 0962-8452
https://doi.org/10.1098/rspb.2018.1557
[email protected] https://eprints.whiterose.ac.uk/
Reuse
Items deposited in White Rose Research Online are protected by copyright, with all rights reserved unless indicated otherwise. They may be downloaded and/or printed for private study, or other acts as permitted by national copyright laws. The publisher or other rights holders may allow further reproduction and re-use of the full text version. This is indicated by the licence information on the White Rose Research Online record for the item.
Takedown
If you consider content in White Rose Research Online to be in breach of UK law, please notify us by
Multi-modal signal evolution in birds: re-examining a standard
1
proxy for sexual selection
2
3
Christopher R. Cooney
1,2*, Hannah E. A. MacGregor
1,3, Nathalie Seddon
1†& Joseph A.
4
Tobias
1,4†5
6
1
Department of Zoology, University of Oxford, South Parks Road, Oxford OX1 3PS, UK.
7
2
Department of Animal and Plant Sciences, University of Sheffield, Western Bank, Sheffield
8
S10 2TN, UK.
9
3
School of Biological Sciences, University of Bristol, Bristol BS8 1TQ, UK.
10
4
Department of Life Sciences, Imperial College London, Silwood Park, Buckhurst Road,
11
Ascot, Berkshire, SL5 7PY, UK.
12
†
Equal contribution
13
14
15
*
Author for correspondence:
[email protected]
16
17
Article type:
Research article
18
Running head
: Sexual dichromatism and song divergence in birds
19
Number of words in abstract
: 200
20
Total number of words in main text
: 3992
21
Number of figures
: 3 (10 in Supplementary Information)
22
Number of tables
: 0 (12 in Supplementary Information)
23
Number of references
: 77
24
25
Author contributions:
C.R.C., J.A.T and N.S
developed the conceptual framework. C.R.C,
26
J.A.T and H.E.A.M collected data. C.R.C conducted the analyses. C.R.C wrote the
27
manuscript, with input from all authors.
Abstract
29
Sexual selection is proposed to be an important driver of speciation and phenotypic diversification in
30
animal systems. However, previous phylogenetic tests have produced conflicting results, perhaps
31
because they have focused on a single signalling modality (visual ornaments), whereas sexual
32
selection may act on alternative signalling modalities (e.g. acoustic ornaments). Here we compile
33
phenotypic data from 259 avian sister species pairs to assess the relationship between visible
34
plumage dichromatism¾a standard index of sexual selection in birds¾and macroevolutionary
35
divergence in the other major avian signalling modality: song. We find evidence for a strong negative
36
relationship between the degree of plumage dichromatism and divergence in song traits, which
37
remains significant even when accounting for other key factors, including habitat type, ecological
38
divergence and interspecific interactions. This negative relationship is opposite to the pattern
39
expected by a straightforward interpretation of the sexual selection-diversification hypothesis,
40
whereby higher levels of dichromatism indicating strong sexual selection should be related to greater
41
levels of mating signal divergence regardless of signalling modality. Our findings imply a ‘trade-off’
42
between the elaboration of visual ornaments and the diversification of acoustic mating signals, and
43
suggest that the effects of sexual selection on diversification can only be determined by considering
44
multiple alternative signalling modalities.
45
46
Keywords: birds, dichromatism, divergence, plumage, sexual selection, song, trade-off
47
48
49
50
Introduction
52
Previous studies have provided theoretical and empirical evidence that sexual selection can stimulate
53
the rapid divergence of traits involved in mate choice and species recognition [1, 2], supporting the
54
longstanding view that sexual selection is an important driver of speciation and lineage diversification
55
[3-6]. However, direct support for this hypothesis is relatively weak and inconsistent among taxa [7],
56
with a series of studies finding no evidence of significant correlations between sexual selection and
57
either species richness or speciation rate when studied across birds [8-11], mammals, butterflies and
58
spiders [12], and certain fish taxa [13]. Although these observations suggest that sexual selection has
59
limited effects on diversification at macroevolutionary scales, an alternative possibility is that standard
60
comparative analyses are simply ineffective because they rely on crude phenotypic proxies to
61
estimate variation in sexual selection across species.
62
To quantify the intensity of sexual selection, most existing large-scale studies in birds have
63
used visible sex-differences in plumage colouration [e.g. 2, 8, 9, 10, 14, 15]. This metric¾usually
64
termed ‘plumage dichromatism’¾has become a standard proxy for sexual selection because it is
65
easily measured and positively correlated with other indices of sexual selection such as testes size,
66
the degree of polygyny, and the frequency of extra-pair paternity [16-19]. Nonetheless, the extent to
67
which plumage dichromatism provides an accurate and consistent estimate of the overall intensity of
68
sexual selection across all lineages remains uncertain, not least because it focuses on a single sexual
69
signalling modality, whereas many taxa engage in multimodal signalling [5]. Indeed, if the intensity of
70
sexual selection targeted at one signalling modality (e.g. visual signals) trades off or is negatively
71
correlated with the intensity of sexual selection targeted at another (e.g. acoustic signals) [3, 20], then
72
such interactions could lead to a breakdown in the relationship between the underlying intensity of
73
sexual selection across species and the visual traits used as proxies for sexual selection, therefore
74
obscuring the true relationship between sexual selection and diversification [2, 8].
75
Progress in resolving this question has been slow because previous studies investigating the
76
macroevolutionary consequences of sexual selection have generally focused exclusively on visual
77
signalling traits [2, 21], leaving open the possibility that comparisons across different sexual signalling
78
modalities may reveal contrasting patterns. Furthermore, most studies have failed to address the role
79
of other important selection pressures potentially shaping the evolution of signal phenotypes, such as
80
habitat differences, ecological divergence and interspecific interactions [22, 23], and have typically
81
focused on geographically, taxonomically and/or ecologically restricted datasets, rather than sampling
82
more broadly across major clades.
83
Here we address these issues by compiling data for a global sample of 259 avian species
84
pairs from 33 passerine families to test the relationship between visible plumage dichromatism—used
85
as a standard proxy for sexual selection in birds and other animals [7]—and macroevolutionary
86
divergence in the other major avian signalling modality: song. We focus on birds because they offer
an unequivocal example of multimodal sexual signalling in which both traits¾avian plumage
88
colouration (a visual ornament) and song (an acoustic ornament)¾are known to function in inter- and
89
intra-sexual selection in many avian taxa [5, 24-27]. In addition, the availability of complementary
90
species-level data on avian morphological traits, ecology, biogeography and phylogeny allows us to
91
assess the importance of plumage dichromatism in relation to a suite of key variables known to
92
influence patterns of signal evolution.
93
Our analyses can be divided into three stages. First, we use published song recordings to
94
estimate the extent of song divergence within species pairs. Second, we assess the relationship
95
between sexual dichromatism and degree of song divergence across pairs. Third, we use multiple
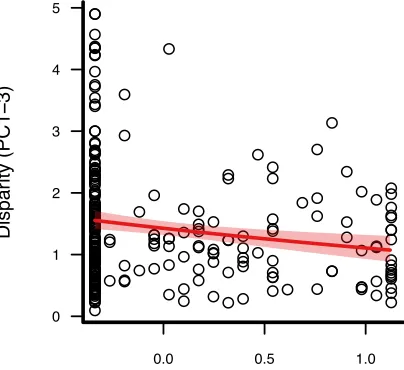
96
regression combined with model averaging techniques to assess the relative association between
97
dichromatism and song divergence in relation to other factors. If sexual selection has reinforcing or
98
independent effects on traits from different signalling modalities [28], we expect the relationship
99
between plumage dichromatism and song divergence to be positive, or non-significant, respectively.
100
Conversely, if the effects of sexual selection on traits in different signalling modalities are negatively
101
correlated, we expect a negative relationship between plumage dichromatism and song divergence
102
across species pairs.
103
104
Methods
105
SPECIES SAMPLING AND PHYLOGENETIC FRAMEWORK
106
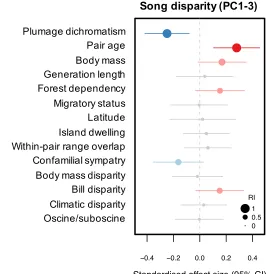
We used published molecular phylogenies to select a sample of passerine species pairs for which
107
high quality song recordings were available [see 2, 8]. Each pair consisted of sister species, i.e. pairs
108
of lineages that represent each other’s closest relative. We note that a few of our study pairs contain
109
species that are not true sisters, both because of incomplete sampling in published phylogenies, and
110
because we included some near-sisters in which one member of the pair belonged to a sister clade
111
(or both species from a polytomy). This approach is based on the assumption that comparisons
112
between near-sisters are informative about phenotypic divergence during recent evolutionary history
113
[2]. Overall, our sample contained 518 species from 259 species pairs (including 243 sister species
114
and 13 near-sisters) widely distributed across the passerine radiation (Fig. S1). For full details, see
115
the supplementary online material. To provide a phylogenetic framework for our analyses, we
116
sampled 1000 molecular-only trees from www.birdtree.org [29], which were pruned to include only
117
the species included in our dataset. We then used TreeAnnotator [30] to generate a maximum clade
118
credibility (MCC) tree, which was then pruned so that each pair was represented by a single tip.
119
120
SONG DIVERGENCE
121
To quantify the extent of song divergence within species pairs, we downloaded songs for all species
122
from the Macaulay Library of Natural Sounds (www.macaulaylibrary.org) and the online database
Xeno Canto (www.xeno-canto.org). We digitized sound files in Raven Pro v1.4 using standard
124
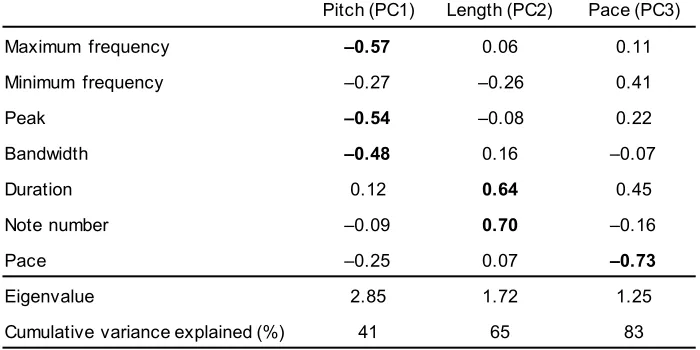
settings, then measured seven key temporal and spectral traits that together capture important
125
interspecific differences in overall signal structure [for full details see 31, 32]: (i) maximum frequency
126
(kHz), (ii) minimum frequency (kHz), (iii) peak frequency (kHz; frequency in the signal with the greatest
127
amplitude), (iv) bandwidth (kHz; maximum frequency minus minimum frequency), (v) signal duration
128
(s), (vi) number of notes and (vii) pace (number of notes s−1). For each species, at least three
high-129
quality recordings were measured (mean 4.8 recordings per species), providing a total sample of
130
2476 songs. To reduce the dimensionality of the dataset, we conducted a principal components (PC)
131
analysis on the covariance matrix of individual (log-transformed) song measurements. The first three
132
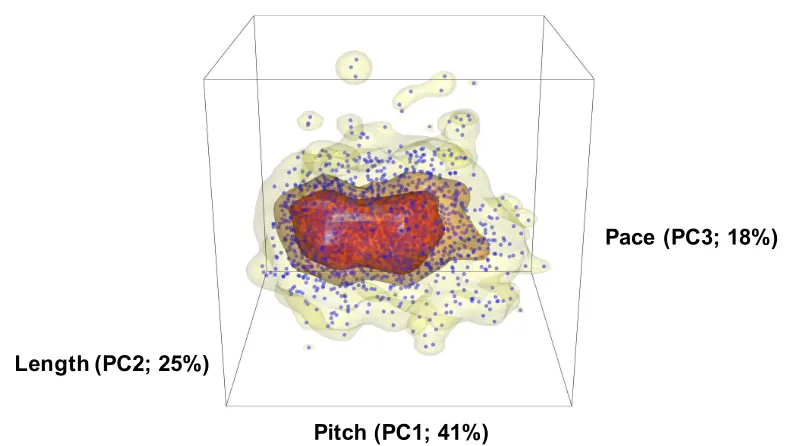
PCs from this analysis accounted for over 83% of the variance in the original acoustic dataset, with
133
each PC capturing a distinct component of overall signal structure (Table S1). Specifically, PC1 (41%)
134
loaded heavily with variables related to song pitch, PC2 (24%) loaded heavily with variables related
135
to song length, and PC3 (18%) primarily loaded with song pace. We therefore interpreted these PCs
136
as axes of variation in song pitch (PC1), length (PC2) and pace (PC3), respectively, with variation in
137
overall song structure captured by position in this three-dimensional acoustic space (Fig. S2). Using
138
these PCs, we estimated within-pair song disparity for all pairs as the Euclidean distance between
139
species’ mean PC scores in terms of overall song structure (PC1-3), and in terms of song pitch, length
140
and pace separately (Fig. 1). To assess the sensitivity of our results, we also generated an alternative
141
version of our dataset in which within-species song disparity estimates were corrected for observed
142
levels of intraspecific variation (see Appendix S1 for full details).
143
144
SEXUAL DICHROMATISM
145
To quantify the degree of sexual dichromatism within pairs, we used published [8] species-level
146
scores of dichromatism estimated by eye from handbook illustrations (see Appendix S1 for
147
justification). Briefly, we used standard methodology [17, 33] to score the difference in plumage
148
colouration between the sexes over five body regions (head, nape-rump-back, throat-belly, tail, and
149
wings) for each species in our sample. Each region was scored separately using three scores: 0, no
150
difference between the sexes; 1, difference between the sexes only in shade or intensity of colour; 2,
151
difference in colour or pattern between the sexes. The dichromatism scores for all five body regions
152
were then summed to give species-specific scores of plumage dichromatism on a scale from 0
153
(monochromatic) to 10 (maximum dichromatism).
154
155
ADDITIONAL PREDICTORS OF SONG DIVERGENCE
156
To explore the role of other factors known to influence estimates of phenotypic (particularly song)
157
divergence in birds, we collected data for a suite of additional explanatory variables including
158
divergence time [34], life history and allometric effects [35], migration status [36], habitat [37, 38],
159
breeding latitude and insularity [39, 40], interspecific interactions [41], niche divergence [42-44] and
song learning [45]. Because the key habitat attribute linked to song evolution in birds is vegetation
161
density [32] we used a score of forest dependency (i.e. degree of association with densely forested
162
habitat). See Appendix S1 for full details of methods, data and data sources.
163
164
STATISTICAL ANALYSES
165
Estimating phylogenetic signal of song divergence
166
We used a generalised least squares (GLS) approach to test the phylogenetic signal of song
167
divergence in our dataset. This approach, implemented in the R package caper [46], estimates a
168
maximum likelihood (ML) value for phylogenetic signal (λ) [47], which typically varies between zero
169
(trait variance is independent of phylogeny) and one (trait variance follows a Brownian motion model
170
of evolution). In the context of analysing song divergence, a value of λ = 0 indicates that extent of
171
song divergence within pairs is random with respect to phylogeny, whereas a value of λ = 1 implies
172
that closely related pairs have more similar levels of song disparity than would be expected by chance.
173
We found that ML values of λ were zero for all four measures of song divergence, with values of λ =
174
1 (i.e. a Brownian motion model of evolution) significantly rejected in all cases (Table S2). Results
175
were qualitatively similar for an alternative dataset corrected for observed levels of intraspecific
176
variation (Table S2), indicating that variation in the extent of within-pair song divergence in our dataset
177
is unrelated to phylogeny. This allowed us to use non-phylogenetic regression techniques with more
178
flexible error structures than currently possible in a statistical phylogenetic comparative framework,
179
which was necessary for our dataset (see below).
180
181
Testing the relationship between predictors and extent of song divergence
182
To model the observed variation in estimates of within-pair song divergence, accounting for the
right-183
skewed distribution of disparity estimates (Fig. S3), we used generalised linear models (GLMs) with
184
a gamma error distribution and log link. Using this approach, we (i) examined the relationship between
185
song disparity and degree of plumage dichromatism, (ii) tested for an interaction effect between
186
dichromatism and habitat type (forest dependency) and (iii) assessed the combined influence of all
187
predictor variables on the extent of song disparity using single and multi-predictor regression and
188
Akaike information criterion-based model averaging [48] corrected for small sample sizes (AICc).
189
To perform model averaging, following [49] and [50], we fitted models encompassing all
190
possible additive combinations of our predictor variables (see above), including a null (intercept-only)
191
model, calculating the AICc score of each model. We then calculated the relative importance (RI) for
192
each predictor variable as the sum of relative Akaike weights for models in which they appear. RI
193
values scale from 0 to 1, where a variable with a score of 0 is associated with very low Akaike weights
194
(i.e. low importance) and 1 is consistently associated with high weights (i.e. high importance). We
195
also calculated model-averaged estimates of regression parameters and standard error values,
196
calculated as the sum of the parameter estimates for each model including that predictor, multiplied
by the relative Akaike weight of each of those models. To give further insight into the relative
198
importance of predictor variables, we also identified the variables included in the top-ranked (i.e. best
199
fitting) model in each case. We used this procedure to assess the effect of predictors on response
200
variables, including overall song disparity (PC1-3), as well as separate estimates of disparity in pitch
201
(PC1), length (PC2) and pace (PC3) separately. For multipredictor models, we restricted the dataset
202
to include only those species pairs for which complete data for all predictors were available (246 of
203
259 pairs) and pseudo-R2 values for GLMs were estimated using the method of [51]. Pair age,
204
generation length, body mass disparity and beak disparity were ln-transformed prior to analysis and
205
models were inspected to ensure they complied with modelling assumptions (e.g. normality of
206
residuals). We also checked for issues related to collinearity among predictors, which we found were
207
unlikely to affect our results (see Appendix S1 for details). To improve the interpretability of regression
208
coefficients, predictor variables were centered and standardised prior to model fitting [52]. All
209
analyses were conducted in R version 3.3.1 and model averaging was performed using the R package
210
MuMIn [53].
211
212
Results
213
RELATIONSHIP BETWEEN DICHROMATISM AND EXTENT OF SONG DIVERGENCE
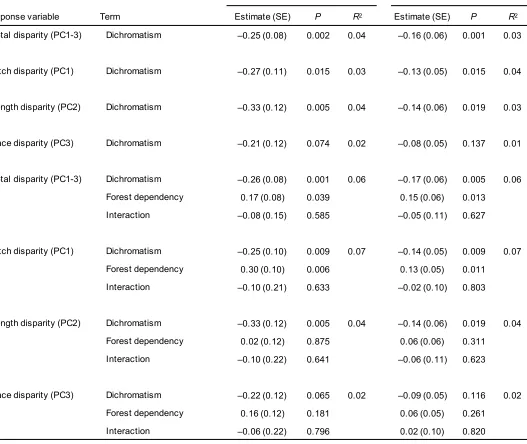
214
Our models revealed that plumage dichromatism was significantly negatively correlated with overall
215
song divergence between species (Table S3). Species pairs with a greater degree of plumage
216
dichromatism tended to have less divergent songs than more monochromatic species pairs (Fig. 2).
217
Analysing patterns of divergence in each song trait separately revealed that the overall effect of
218
dichromatism was primarily driven by significant negative relationships with divergence in song pitch
219
(PC1) and length (PC2), with more marginal effects on song pace (PC3) (Table S3). Furthermore,
220
including an interaction effect with forest dependency in these models revealed no significant
221
statistical support for the hypothesis that the relationship between dichromatism and song divergence
222
is mediated by variation in habitat type across taxa (Table S3). Rerunning analyses correcting for
223
observed levels of intraspecific variation produced highly similar results (Table S3).
224
225
ADDITIONAL PREDICTORS OF SONG DIVERGENCE
226
Single predictor regression models focused on our additional predictors of song divergence identified
227
several variables that were individually correlated with variation in song disparity across pairs (Fig.
228
S4-S7). In terms of total song disparity (PC1-3), the strongest individual predictor was pair age (Table
229
S4). Furthermore, variation in overall song disparity was also significantly correlated with disparity in
230
beak morphology, with more marginal effects detected for several other variables, including forest
231
dependency and mass disparity (Table S4). We also detected additional significant correlations
232
between individual predictors and estimates of disparity in specific components of song structure
233
(Table S5).
We then assessed the relative importance of all predictors using AICc model averaging
235
techniques (Fig. 3). The best-supported predictor of total song disparity (PC1-3) was pair age (RI =
236
0.99), which exhibited a strong and highly significantly positive relationship with disparity (Table S6).
237
However, even after accounting for this relationship, the negative effect of dichromatism remained
238
strong (RI = 0.98) (Fig. 3). The AICc best model for total song disparity accounted for 17% of the total
239
variation, and retained these two variables plus mean pair body mass, forest dependency and
within-240
pair beak disparity mass as positive effects, and confamilial sympatry as a negative effect (Fig. 3;
241
Table S6).
242
Analysing relationships in each component song trait separately revealed that predictor
243
variables had contrasting effects depending on the axis considered (Fig. S8; Table S7). On the one
244
hand, divergence in song pitch (PC1) was best predicted by significant effects of dichromatism (RI =
245
0.97), pair age (RI = 0.96), body mass (RI = 0.93), confamilial sympatry (RI = 0.92) and forest
246
dependency (RI = 0.89), whereas divergence in song length (PC2) was best explained by significant
247
effects of only pair age (RI = 0.92) and dichromatism (RI = 0.91). In contrast, the only significant
248
predictor of divergence in song pace (PC3) was a positive effect of within-pair beak disparity (RI =
249
0.82). Overall, AICc top models for these variables accounted for 22%, 12% and 6% of the total
250
variation in disparity in song pitch, length and pace, respectively (Table S8). Rerunning models
251
accounting for intraspecific variation produced qualitatively similar results (Table S9-S11).
252
253
Discussion
254
Our analyses reveal that the degree of sexual dichromatism is negatively related to the extent of
255
divergence in song structure among closely related bird species, a pattern that remained strong after
256
accounting for a suite of potentially correlated or confounding variables, as well as for intraspecific
257
trait variation. This contrasts with the findings of previous studies reporting evidence for significant
258
positive correlations between indictors of sexual selection and signal divergence in birds, supporting
259
the view that sexual selection can drive parallel divergence across multiple signals [2, 21]. However,
260
these studies assessed patterns of divergence in visual signalling traits (i.e. plumage colouration),
261
using proxies for the intensity of sexual selection derived from the same signalling modality (e.g.
262
dichromatism). In contrast, we have focused across major avian signalling modalities, finding the
263
opposite relationship: that dichromatism (a visual signal) is negatively associated with divergence in
264
song (an acoustic signal). Our results are therefore incompatible with a straightforward interpretation
265
of the sexual selection-diversification hypothesis, whereby higher levels of dichromatism indicating
266
strong sexual selection should be related to greater levels of mating signal divergence regardless of
267
signalling modality. Instead, our findings are consistent with the alternative view that negative
268
interactions between alternative signalling modalities play an important role in shaping
269
macroevolutionary patterns of signal evolution in birds.
One intuitive explanation for the negative correlation between plumage dichromatism and
271
song divergence is that it reflects an underlying link between sexual selection and acoustic signal
272
divergence in species that do not rely on visual signals. This makes sense because single-species
273
studies have demonstrated an important role for female choice and/or male-male competition in
274
shaping many aspects of avian acoustic signal design [24], and many avian taxa with drab or
275
monochromatic plumage are known to possess highly elaborate acoustic signals which often provide
276
the best means of differentiating among lineages (e.g. Old World leaf warblers; Phylloscopidae) [54].
277
Thus, increased sexual selection on acoustic traits relative to visual traits in monochromatic taxa
278
provides a plausible explanation for a negative relationship between plumage dichromatism and song
279
disparity at broad macroevolutionary scales.
280
A key challenge facing this interpretation is to explain why, within species, selection would
281
favour signals from one rather than multiple signalling modalities, thus generating negative
282
relationships across modalities at a macroevolutionary scale. It is possible that the relative costs and
283
benefits of signalling via a given sensory modality are shaped by the prevailing environmental
284
conditions [38], such that ecological differences among species should play a role in determining the
285
relative prominence of one signal type over another [27]. In line with this idea, bird species inhabiting
286
dense habitats such as reedbeds, thickets, and the understorey of forests often have more elaborate
287
songs than visual signals. However, our models including forest dependency as an interaction term
288
provided no support for the idea that the relationship between plumage dichromatism and song
289
divergence is mediated by broad-scale habitat differences among taxa.
290
An alternative explanation is that our findings reflect the signature of evolutionary trade-offs
291
between alternate signalling modalities. Under a resource- or cost-based trade-off scenario—such as
292
that envisaged by Darwin [3] and later termed the ‘transfer hypothesis’ [20]—constraints on sexual
293
selection within species make it costly for males to signal in (or females to choose between) multiple
294
signalling modalities [55, 56], generating the potential for interspecific trade-offs in ornament
295
elaboration (and diversification) between alternate signalling modalities [57]. This explanation relies
296
on the assumption that investment in one signalling modality constrains investment in another, which
297
is plausible given that avian plumage and song traits may both be costly to produce [58]. However,
298
the energetic costs of signal production may be relatively low [59] and potentially offset by differences
299
in how such signals are produced and displayed [27]. A different trade-off scenario is suggested by
300
the concept of ‘redundancy’ among alternate signal types. Under a redundancy-based model, the
301
spread of an attractive signal in one modality leads simultaneously to increased selection for detecting
302
the novel signal and a weakening of selection for elaborate signals in alternate modalities, which
303
occurs not because of costs associated with producing or maintaining multiple sexual signals, but
304
because sexual selection on the latter trait is weak or non-existent, due to redundancy [60]. Such
305
redundancy-based trade-offs can theoretically occur in the absence of any habitat differences among
306
taxa, or resource limitation underlying the production of signalling traits. Thus, whether selection
favours one signal type (e.g. song) over another (e.g. plumage) largely depends on which signal type
308
evolved first, which may largely be due to historical contingencies [61-63].
309
310
CONTRIBUTORY FACTORS
311
In addition to variation in the strength and targets of sexual selection, our results support a role for
312
several other factors in shaping patterns of acoustic signal divergence in birds. We found strong
313
evidence for a positive relationship between species pair age and degree of song disparity, in line
314
with previous studies [e.g. 2, 39, 64, 65], as well as the general consensus that patterns of phenotypic
315
divergence are primarily dictated by the time available for trait differences to evolve [34, 66]. Body
316
mass also emerged as a significant predictor of song divergence, in line with previous studies
317
indicating positive relationships between body mass and patterns of signal evolution in birds [2, 19].
318
Furthermore, we found support for links between song divergence and both habitat and the degree
319
of confamilial sympatry. First, we found evidence for increased pitch disparity in species pairs with
320
higher levels of forest dependency, consistent with the idea of stronger (divergent) selection on
321
acoustic traits in taxa signalling in densely vegetated habitats [37, 38]. Second, we found that pairs
322
which co-occurred with a greater proportion of confamilial species had lower levels of song divergence
323
than those with lower levels of overlap. This accords with the view that interactions among related
324
species can constrain phenotypic divergence [67], in part because acoustic communities appear to
325
‘partition’ finite aspects of acoustic signalling space [31, 68-70]. Finally, we found that divergence in
326
song pace was significantly positively correlated with disparity in species’ beak morphology. Previous
327
studies have found evidence of correlated evolution of morphology and vocal signal structure in
328
particular clades (e.g. Darwin's finches, Neotropical woodcreepers) [43, 71, 72], presumably because
329
biophysical constraints on song production generate correlated evolution between songs and beaks.
330
Our results in relation to beak morphology support this view, and imply that this effect holds across
331
passerines more generally. Nonetheless, even when we accounted for these significant effects in
332
statistical models, the strong negative association between song divergence and dichromatism was
333
retained.
334
335
IMPLICATIONS FOR COMPARATIVE STUDIES
336
Our finding that dichromatism is negatively related to song divergence across a broad sample of avian
337
species pairs has important implications for studies testing macroevolutionary hypotheses related to
338
sexual selection. Most importantly, it implies that plumage dichromatism provides a relatively
339
ineffective proxy for the intensity of sexual selection in taxa primarily using non-visual signals. This
340
potential limitation of dichromatism has previously been proposed [2, 8] with reference to bird species
341
such as the common nightingale (Luscinia megarhynchos), common whitethroat (Sylvia communis)
342
and sedge warbler (Acrocephalus schoenobaenus), passerine species with largely monomorphic
343
plumage colouration, elaborate song traits and strong sexual selection [73-75]. Our results provide
broad-scale empirical support for this view, and indicate that dichromatism will underestimate sexual
345
selection in these taxa, potentially being negatively related to the intensity of sexual selection in
346
samples dominated by non-visual signallers. Thus, the underlying effect of sexual selection may often
347
be obscured in comparative studies based solely on dichromatism, perhaps helping to explain the
348
weak or non-existent correlations between dichromatism and speciation rates in birds and other taxa
349
with multimodal signalling [7-11].
350
351
CONCLUSIONS
352
Taken together, our findings are consistent with the view that sexual selection plays a major role in
353
shaping sexual signal evolution, in conjunction with ecological factors [23, 76, 77]. However, whereas
354
most previous studies have focused on a single signalling modality, we found evidence of a negative
355
relationship between visual and acoustic signalling in birds, supporting the more general view that
356
negative interactions between signalling modalities can explain general patterns of signal evolution
357
[3, 20]. Not only do these results suggest that such ‘trade-offs’ are important in shaping phenotypic
358
diversity, they also indicate that phylogenetic tests based on phenotypic metrics for the intensity of
359
sexual selection will underestimate the association between sexual selection and diversification. We
360
conclude that the rigour and accuracy of any comparative analysis testing the effects of sexual
361
selection will be improved by considering phenotypic proxies for sexual selection that span all relevant
362
signalling modalities, be they visual, acoustic, or olfactory.
363
364
Acknowledgements
365
We thank Angela Chira, Emma Hughes, Joseph Llanos and Gavin Thomas for helpful discussion and
366
three anonymous reviewers for constructive comments on the manuscript. We thank Mark Adams
367
and Hein van Grouw at the Natural History Museum (Tring) for logistical assistance and access to
368
specimens. Collection of trait data was supported by Natural Environment Research Grant
369
(NE/I028068/1) to JAT and NS. This work was further supported by the European Research Council
370
(grant number 615709, Project ‘ToLERates’).
371
372
Data accessibility
373
The full dataset has been uploaded to Dryad Data Repository, and is available via the link:
374
https://datadryad.org/review?doi=doi:10.5061/dryad.b4p43t7.
375
376
References
377
378
1.
Lande R. 1981 Models of speciation by sexual selection on polygenic traits.
Proc Natl Acad Sci
379
USA
78
(6 I), 3721-3725.
2.
Seddon N., Botero C.A., Tobias J.A., Dunn P.O., Macgregor H.E., Rubenstein D.R., Uy J.A., Weir
381
J.T., Whittingham L.A., Safran R.J. 2013 Sexual selection accelerates signal evolution during speciation
382
in birds.
Proc R Soc London Ser B
280
(1766), 20131065. (doi:10.1098/rspb.2013.1065).
383
3.
Darwin C.R. 1871
The descent of man, and selection in relation to sex
. London, UK, John
384
Murray.
385
4.
West-Eberhard M.J. 1983 Sexual selection, social competition, and speciation.
Q Rev Biol
386
58
(2), 155-183.
387
5.
Andersson M. 1994
Sexual selection
. Princeton, Princeton University Press.
388
6.
Panhuis T.M., Butlin R., Zuk M., Tregenza T. 2001 Sexual selection and speciation.
Trends Ecol
389
Evol
16
(7), 364-371.
390
7.
Kraaijeveld K., Kraaijeveld-Smit F.J.L., Maan M.E. 2011 Sexual selection and speciation: the
391
comparative evidence revisited.
Biol Rev Camb Philos Soc
86
(2), 367-377.
(doi:10.1111/j.1469-392
185X.2010.00150.x).
393
8.
Cooney C.R., Tobias J.A., Weir J.T., Botero C.A., Seddon N. 2017 Sexual selection, speciation
394
and constraints on geographical range overlap in birds.
Ecol Lett
20
(7), 863-871.
395
(doi:10.1111/ele.12780).
396
9.
Phillimore A.B., Freckleton R.P., Orme C.D.L., Owens I.P.F. 2006 Ecology predicts large-scale
397
patterns of phylogenetic diversification in birds.
Am Nat
168
(2), 220-229.
398
10.
Huang H., Rabosky D.L. 2014 Sexual selection and diversification: reexamining the correlation
399
between dichromatism and speciation rate in birds.
Am Nat
184
(5), E101-E114.
400
(doi:10.1086/678054).
401
11.
Morrow E.H., Pitcher T.E., Arnqvist G. 2003 No evidence that sexual selection is an 'engine of
402
speciation' in birds.
Ecol Lett
6
(3), 228-234.
403
12.
Gage M.J., Parker G.A., Nylin S., Wiklund C. 2002 Sexual selection and speciation in mammals,
404
butterflies
and
spiders.
Proc
R
Soc
London
Ser
B
269
(1507),
2309-2316.
405
(doi:10.1098/rspb.2002.2154).
406
13.
Ritchie M.G., Hamill R.M., Graves J.A., Magurran A.E., Webb S.A., Macías Garcia C. 2007 Sex
407
and differentiation: population genetic divergence and sexual dimorphism in Mexican goodeid fish.
408
J Evol Biol
20
(5), 2048-2055. (doi:10.1111/j.1420-9101.2007.01357.x).
409
14.
Barraclough T.G., Harvey P.H., Nee S. 1995 Sexual selection and taxonomic diversity in
410
passerine birds.
Proc R Soc London Ser B
259
(1355), 211-215.
411
15.
Owens I.P.F., Bennett P.M., Harvey P.H. 1999 Species richness among birds: body size, life
412
history, sexual selection or ecology?
Proc R Soc London Ser B
266
(1422), 933-939.
413
16.
Dunn P.O., Whittingham L.A., Pitcher T.E. 2001 Mating systems, sperm competition, and the
414
evolution of sexual dimorphism in birds.
Evolution
55
(1), 161-175.
415
17.
Owens I.P.F., Hartley I.R. 1998 Sexual dimorphism in birds: why are there so many different
416
forms of dimorphism?
Proc R Soc London Ser B
265
, 397-407.
417
18.
Dunn P.O., Armenta J.K., Whittingham L.A. 2015 Natural and sexual selection act on different
418
axes of variation in avian plumage color.
Science Advances
1
, e1400155.
419
19.
Dale J., Dey C.J., Delhey K., Kempenaers B., Valcu M. 2015 The effects of life history and sexual
420
selection
on
male
and
female
plumage
colouration.
Nature
527
(7578),
367-370.
421
(doi:10.1038/nature15509).
422
20.
Gilliard E.T. 1956 Bower ornamentation versus plumage characters in bower-birds.
Auk
73
(3),
423
450-451.
424
21.
Gomes A.C.R., Sorenson M.D., Cardoso G.C. 2016 Speciation is associated with changing
425
ornamentation rather than stronger sexual selection.
Evolution
70
(12), 2823-2838.
426
22.
Cuthill I.C., Allen W.L., Arbuckle K., Caspers B., Chaplin G., Hauber M.E., Hill G.E., Jablonski
428
N.G., Jiggins C.D., Kelber A., et al. 2017 The biology of color.
Science
357
(6350), eaan0221.
429
(doi:10.1126/science.aan0221).
430
23.
Wilkins M.R., Seddon N., Safran R.J. 2013 Evolutionary divergence in acoustic signals: causes
431
and consequences.
Trends Ecol Evol
28
(3), 156-166. (doi:10.1016/j.tree.2012.10.002).
432
24.
Catchpole C.K., Slater P.J.B. 2008
Bird song: biological themes and variations, 2nd edition
.
433
Cambridge, UK, Cambridge University Press.
434
25.
Collins S.A. 2004 Vocal flirting and fighting: the functions of birdsong. In
Nature's music: the
435
science of birdsong
(eds. Marler P., Slabbekoorn H.), pp. 39-79. San Diego, CA, Elsevier Academic
436
Press.
437
26.
Slabbekoorn H.W. 2004 Singing in the wild: the ecology of birdsong. In
Nature's music: the
438
science of birdsong
(eds. Marler P., Slabbekoorn H.W.), pp. 178-205. San Diego, CA, Elsevier Academic
439
Press.
440
27.
Price T.D. 2008
Speciation in birds
. Greenwood Village, CO, Roberts and Co.
441
28.
Møller A.P., Pomiankowski A. 1993 Why have birds got multiple sexual ornaments?
Behav
442
Ecol Sociobiol
32
(3), 167-176.
443
29.
Jetz W., Thomas G.H., Joy J.B., Hartmann K., Mooers A.O. 2012 The global diversity of birds in
444
space and time.
Nature
491
, 444-448. (doi:10.1038/nature11631).
445
30.
Drummond A.J., Suchard M.A., Xie D., Rambaut A. 2012 Bayesian phylogenetics with BEAUti
446
and the BEAST 1.7.
Mol Biol Evol
29
(8), 1969-1973. (doi:10.1093/molbev/mss075).
447
31.
Tobias J.A., Planqué R., Cram D.L., Seddon N. 2014 Species interactions and the structure of
448
complex communication networks.
Proc Natl Acad Sci USA
111
(3), 1020-1025.
449
32.
Tobias J.A., Aben J., Brumfield R.T., Derryberry E.P., Halfwerk W., Slabbekoorn H., Seddon N.
450
2010 Song divergence by sensory drive in Amazonian birds.
Evolution
64
(10), 2820-2839.
451
(doi:10.1111/j.1558-5646.2010.01067.x).
452
33.
Owens I.P.F., Bennett P.M. 1994 Mortality costs of parental care and sexual dimorphism in
453
birds.
Proc R Soc London Ser B
257
(1348), 1-8. (doi:10.1098/rspb.1994.0086).
454
34.
Tobias J.A., Cornwallis C.K., Derryberry E.P., Claramunt S., Brumfield R.T., Seddon N. 2014
455
Species coexistence and the dynamics of phenotypic evolution in adaptive radiation.
Nature
456
506
(7488), 359-363. (doi:10.1038/nature12874).
457
35.
Ryan M.J., Brenowitz E.A. 1985 The role of body size, phylogeny, and ambient noise in the
458
evolution of bird song.
Am Nat
126
(1), 87-100.
459
36.
Collins S.A., de Kort S.R., Pérez-Tris J., Tellería J.L. 2009 Migration strategy and divergent
460
sexual selection on bird song.
Proc R Soc London Ser B
276
(1656), 585-590.
461
(doi:10.1098/rspb.2008.1011).
462
37.
Morton E.S. 1975 Ecological sources of selection on avian sounds.
Am Nat
109
(965), 17-24.
463
38.
Endler J.A. 1992 Signals, signal conditions, and the direction of evolution.
Am Nat
139
(Suppl.),
464
S125-S153.
465
39.
Weir J.T., Wheatcroft D. 2011 A latitudinal gradient in rates of evolution of avian syllable
466
diversity
and
song
length.
Proc
R
Soc
London
Ser
B
278
(1712),
1713-1720.
467
(doi:10.1098/rspb.2010.2037).
468
40.
Morinay J., Cardoso G.C., Doutrelant C., Covas R. 2013 The evolution of birdsong on islands.
469
Ecology and Evolution
3
(16), 5127-5140. (doi:10.1002/ece3.864).
470
41.
Pfennig D.W., Pfennig K.S. 2010 Character displacement and the origins of diversity.
Am Nat
471
42.
Podos J., Hendry A.P. 2006 The biomechanics of ecological speciation. In
Ecology and
473
biomechanics: a mechanical approach to the ecology of animals and plants
(eds. Herrel A., Speck T.,
474
Rowe N.P.). Boca Raton, FL, CRC Press.
475
43.
Podos J. 2001 Correlated evolution of morphology and vocal signal structure in Darwin’s
476
finches.
Nature
409
, 185-188.
477
44.
Lawson A.M., Weir J.T. 2014 Latitudinal gradients in climatic-niche evolution accelerate trait
478
evolution at high latitudes.
Ecol Lett
17
(11), 1427-1436. (doi:10.1111/ele.12346).
479
45.
Lachlan R.F., Servedio M.R. 2004 Song learning accelerates allopatric speciation.
Evolution
480
58
(9), 2049-2063.
481
46.
Orme C.D.L., Freckleton R.P., Thomas G.H., Petzoldt T., Fritz S.A., Isaac N., Pearse W.D. 2013
482
Caper: comparative analyses of phylogenetics and evolution in R. R package version 0.5.2.
483
http://cran.r-project.org/package=caper
.
484
47.
Pagel M. 1999 Inferring the historical patterns of biological evolution.
Nature
401
(6756),
877-485
884.
486
48.
Burnham K.P., Anderson D.R. 2002
Model selection and multimodel inference: a practical
487
information-theoretic approach
. New York, Springer.
488
49.
Grueber C.E., Nakagawa S., Laws R.J., Jamieson I.G. 2011 Multimodel inference in ecology and
489
evolution: challenges and solutions.
J Evol Biol
24
(4), 699-711.
(doi:10.1111/j.1420-490
9101.2010.02210.x).
491
50.
Wagner C.E., Harmon L.J., Seehausen O. 2012 Ecological opportunity and sexual selection
492
together predict adaptive radiation.
Nature
487
, 366-370. (doi:10.1038/nature11144).
493
51.
Nagelkerke N.J.D. 1991 A note on the general definition of the coefficient of determination.
494
Biometrika
78
(3), 691-692.
495
52.
Schielzeth H. 2010 Simple means to improve the interpretability of regression coefficients.
496
Methods in Ecology and Evolution
1
(2), 103-113. (doi:10.1111/j.2041-210X.2010.00012.x).
497
53.
Bartoń K. 2017 MuMIn: multi-model inference. R package, version 1.15.6. Available at:
498
https://cran.r-project.org/web/packages/MuMIn/index.html
.
499
54.
Tietze D.T., Martens J., Fischer B.S., Sun Y.H., Klussmann-Kolb A., Päckert M. 2015 Evolution
500
of leaf warbler songs (Aves: Phylloscopidae).
Ecology and Evolution
5
(3), 781-798.
501
(doi:10.1002/ece3.1400).
502
55.
Iwasa Y., Pomiankowski A. 1994 The evolution of mate preferences for multiple sexual
503
ornaments.
Evolution
48
(3), 853-867.
504
56.
Schluter D., Price T. 1993 Honesty, perception and population divergence in sexually selected
505
traits.
Proc R Soc London Ser B
253
, 117-122.
506
57.
Shutler D. 2011 Sexual selection: when to expect trade-offs.
Biol Lett
7
(1), 101-104.
507
(doi:10.1098/rsbl.2010.0531).
508
58.
von Schantz T., Bensch S., Grahn M., Hasselquist D., Wittzell H. 1999 Good genes, oxidative
509
stress and condition-dependent signals.
Proc R Soc London Ser B
266
, 1-12.
510
59.
Ward S. 2004 Singing is not energetically demanding for pied flycatchers,
Ficedula hypoleuca
.
511
Behav Ecol
15
(3), 477-484. (doi:10.1093/beheco/arh038).
512
60.
Agrawal A.A., Conner J.K., Rasmann S. 2010 Tradeoffs and negative correlations in
513
evolutionary ecology. In
Evolution since Darwin: the first 150 years
(eds. Bell M.A., Futuyma D.J.,
514
Eanes W.F., Levinton J.S.). Sunderland, MA, Sinauer Associates.
515
61.
Wischmann S., Floreano D., Keller L. 2012 Historical contingency affects signaling strategies
516
and competitive abilities in evolving populations of simulated robots.
Proc Natl Acad Sci USA
109
(3),
517
62.
Ord T.J., Charles G.K., Hofer R.K. 2011 The evolution of alternative adaptive strategies for
519
effective communication in noisy environments.
Am Nat
177
(1), 54-64. (doi:10.1086/657439).
520
63.
Mani G.S., Clarke B.C. 1990 Mutational order: a major stochasitc process in evolution.
Proc R
521
Soc London Ser B
240
, 29-37.
522
64.
Weir J.T., Wheatcroft D.J., Price T.D. 2012 The role of ecological constraint in driving the
523
evolution of avian song frequency across a latitudinal gradient.
Evolution
66
(9), 2773-2783.
524
65.
Price J.J., Lanyon S.M. 2002 Reconstructing the evolution of complex bird song in the
525
oropendolas.
Evolution
56
(7), 1514-1529.
526
66.
Uyeda J.C., Hansen T.F., Arnold S.J., Pienaar J. 2011 The million-year wait for
527
macroevolutionary bursts.
Proc Natl Acad Sci USA
108
(38), 15908-15913.
528
67.
Grether G.F., Peiman K.S., Tobias J.A., Robinson B.W. 2017 Causes and consequences of
529
behavioral
interference
between
species.
Trends
Ecol
Evol
32
(10),
760-772.
530
(doi:10.1016/j.tree.2017.07.004).
531
68.
Chek A.A., Bogart J.P., Lougheed S.C. 2003 Mating signal partitioning in multi-species
532
assemblages: a null model test using frogs.
Ecol Lett
6
, 235-247.
533
69.
Seddon N. 2005 Ecological adaptation and species recognition drives vocal evolution in
534
Neotropical suboscine birds.
Evolution
59
(1), 200-215.
535
70.
Grant B.R., Grant P.R. 2010 Songs of Darwin's finches diverge when a new species enters the
536
community.
Proc Natl Acad Sci USA
107
(47), 20156-20163. (doi:10.1073/pnas.1015115107).
537
71.
Derryberry E.P., Seddon N., Claramunt S., Tobias J.A., Baker A., Aleixo A., Brumfield R.T. 2012
538
Correlated evolution of beak morphology and song in the neotropical woodcreeper radiation.
539
Evolution
66
(9), 2784-2797. (doi:10.1111/j.1558-5646.2012.01642.x).
540
72.
Podos J. 2004 Vocal mechanics in Darwin's finches: correlation of beak gape and song
541
frequency.
J Exp Biol
207
(4), 607-619. (doi:10.1242/jeb.00770).
542
73.
Buchanan K.L., Catchpole C.K. 2000 Song as an indicator of male parental effort in the sedge
543
warbler.
Proc R Soc London Ser B
267
(1441), 321-326.
544
74.
Halupka K., Boroweic M. 2006 Male whitethroats,
Sylvia communis
, advertise their future
545
contributions to parental care.
Behaviour
143
(1), 1-14.
546
75.
Bartsch C., Weiss M., Kipper S. 2015 Multiple song features are related to paternal effort in
547
common nightingales.
BMC Evol Biol
15
, 115. (doi:10.1186/s12862-015-0390-5).
548
76.
Safran R.J., Scordato E.S., Symes L.B., Rodriguez R.L., Mendelson T.C. 2013 Contributions of
549
natural and sexual selection to the evolution of premating reproductive isolation: a research agenda.
550
Trends Ecol Evol
28
(11), 643-650. (doi:10.1016/j.tree.2013.08.004).
551
77.
Mendelson T.C., Martin M.D., Flaxman S.M. 2014 Mutation-order divergence by sexual
552
selection: diversification of sexual signals in similar environments as a first step in speciation.
Ecol
553
Lett
17
(9), 1053-1066. (doi:10.1111/ele.12313).
554
555
Figure and table captions
557
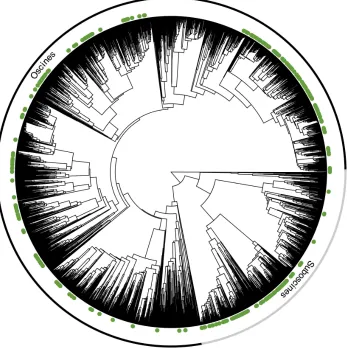
558
Figure 1. A phylogenetic tree of passerine species pairs (n = 259), showing within-pair disparity in
559
overall song (PC1-3; innermost, black), pitch (PC2; red), length (PC3; blue) and pace (PC3;
560
outermost, green). Size of points corresponds to relative within-pair song disparity. A version including
561
species names is available in the supporting online material.
562
563
Figure 2. Scatterplot showing the relationship between total within-pair song disparity (PC1-3) and
564
plumage dichromatism across 259 species pairs of passerine birds. Regression line (with prediction
565
intervals, shaded) indicates the best-fitting relationship between the two variables.
566
567
Figure 3. Model averaged coefficient estimates from multipredictor GLMs predicting variation in
568
within-pair song disparity (PC1-3) among passerine species pairs (n = 259). Points indicate the
569
standardised effect sizes for each of the (scaled) predictor variables and lines indicate 95%
570
confidence intervals (CI). Sizes of points represent the relative importance (RI) of each of the predictor
571
variables, where a value of RI = 0 indicates low importance and a value of RI = 1 indicates high
572
importance. Predictors included in the AICc top model are coloured (blue = negative effect; red =
573
positive effect), with significant (P < 0.05) model-averaged coefficients shown in darker colours.