Modelling of high purity H2 production via sorption enhanced chemical looping steam reforming of methane in a packed bed reactor
56
0
0
Full text
Figure

+7

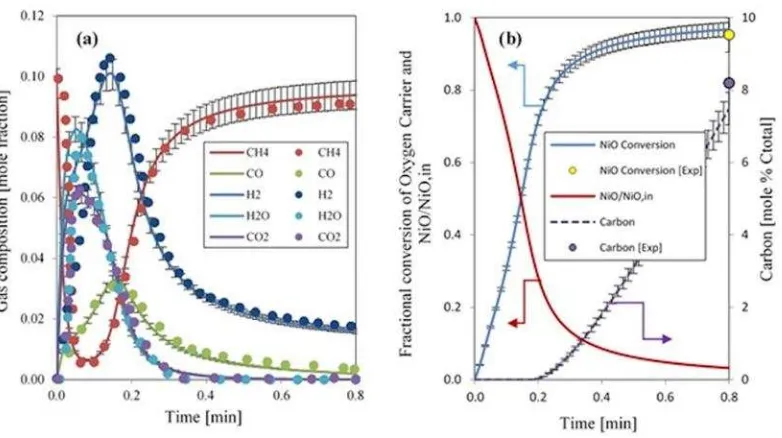
![Figure 7: Product gases composition [dry basis] at the outlet of reactor at feed temperature of 923 K, S/C of 5.0,](https://thumb-us.123doks.com/thumbv2/123dok_us/1991761.161098/25.595.116.364.461.635/figure-product-gases-composition-basis-outlet-reactor-temperature.webp)

Related documents