r
EDUCATION
AND LABOUR FORCE
I N
CENTRAL JAVA
by
Makmuri Sukarno
A Thesis Submitted in Partial Fulfilment of The Requirements for the Degree of Master of Arts in
Demography at
The Australian National University
i DECLARATION
Except where otherwise indicated, this thesi s is my own work.
r
ii
ACKNOWLEDGEMENTS
I am very grateful to the Colombo Plan authorities and the Australian National University in Canberra, for
awarding a scholarship enabling me to undertake this
study; also the Indonesian Institute of Sciences
(L.I.P.I) for granting me necessary leave.
I owe many debts of gratitude to the people who have
helped me during the preparation and writing up the
thesis. In ,particular I would like to acknowledge and
thank Dr. Paul Meyer and Dr. David Lucas for their
supervision and advice. In addition, I am very grateful
to Dr. Gavin Jones for his advice and suggestions; Dr.
Suharso and Dr. Lorraine Corner for encouraging me to
study in Australia.
Many thanks go to Dr. Lucas and Dr. Meyer again, who
introduced me to population studies, Dr. Terry Hull who
permitted me to use the IPDP facilities during my writing
of the thesis. I wish to thank Ms. Christine McMurray, Mrs. Pat Quiggin and Ms.Carol Mehkek, my friends Lukman
and the staff of the Menzies Library for their help
during my study in Australia.
Finally, my gratitude goes to my wife, Detik
Rachmawati fo her encouragement and companionship during
my study at Australian National University.
i i i ABSTRACT
This study deals with education and the labour force
in the province of Central Java, Indonesia. The
relationship between education and the labour force
includes several issues, such as education as investment
in human
economic
manpower
manpower.
capital
capacity
policy to
to prepare qualified skills,
to absorb educated people and
adjust demand for and supply
the
the
of
In this study, the relationship between education
and the labour force has been viewed in this light. The
primary source of data on education and the labour force
was the 1980 census. The 1971 census, the 1976 Labour
Force Survey, the 1985 Intercensal Population Survey and
Jawa Tengah Dal am Angka ( Central Java Year Books) were
selected as the complements. The manpower policy data
were obtained from the Repeli ta (Five Year Development
Plans).
The educational policy in Central Java, in terms of
the quantity, has been succesful during the period 1971
to 1985, and resulted in rapid growth of educated labour
force. Meanwhile, the economic policy on economic growth
has also been succesful, but i t has offered only limited
employment growth and consequently resulted in
unemployment. The unemployment rate among educated people
(secondary and tertiary graduates) was higher than among
iv
The educational policy is producing graduates to
achieve the desirable labour force pyramid, while the .
current economic difficulties will narrow employment
growth in the future. According to employment
projections, the increasing unemployment rate among
secondary graduates, which began during 1980-1985, is
likely to continue in the future.The government has
established pre-employment training for the period
1984-1989, which is excessive c6mpared with the additional
employment opportunities for that period, while the
number of pre-employment training programs for secondary
graduates is inadequate. Educated people who are
unemployed are likely to move to lower occupations and
consequently improve the quality of labour force in lower
•
page
ACKNOWLEDGEMENTS... ii
AB S T RAC T . • . . • • • • • • • • • • . • • • • • • • • • • • • • • . • • • • • • • . • • • . . . i i i L I S T OF TAB L ES . . . . vi i LIST OF FIGURES. . . . ix
LIST OF APPENDICES. . . . . • . . . x
CHAPTER 1 INTRODUCTION... 1
1. 1 Introduction. . . . . 1
1.2 The aim of the study... 3
1.3 The selection of Central Java as the area of s t u d y . . . 4
1.4 Theoretical framework... 6
1.5 Theoretical problems... 8
1.6 Regional problems... 13
1.7 The source of d a t a . . . 17
1.8 Limitation of the d a t a . . . 18
1. 9 Methodology. . . . 20
1.10 The organization of the thesis... 20
CHAPTER 2 THE SITUATION OF THE EDUCATION... 23
2.1 The structure of the Indonesian school system. . . . . 23
2.2 Age structure and the school age popula-t ion . . . . . . 2.3 Enrolment, progression and graduate rates 2.3.1 Determinants of school enrolments .. . 2.3.2 The enrolment rates . . . . 2.3.3 The progression rates . . . . 2 . 4 S umm a ry . . . . CHAPTER 3 ABSORPTION OF EDUCATED LABOUR IN THE 25 27 27 34 39 48 WORKFORCE . . . . . . . . . . 51
3.1. Introduction... 51
3.2 The economic structure and labour labour absorption... 52
3.2.1 The political choice: economic growth to create employment oppor-tunities . . . . . 5 2 3.2.2 High economic growth with shortages of job opportunities... 54
3.2.3 Sectoral labour absorption . . . ; 55
3.3 Educational characteristics of labour force in various industries... 60
3.3.1 Educational characteristics of the labour force by sector... 60
3.3.2 Educatioanl characteristics and the "push-down" effect on occu-pation. . . . . . . 61
3.4 Educated labour force and unemployment .. 64
3.4.1 The weaknesses of labour absorption of the economy . . . 64
vi 3.4.3 The structural wage bias . . . 70
3.4.4 Educational policy:quantity versus
quality. . . . 72
3.5 Lack of information about the labour
market. . . . . 7 5 3.6 Summary . . . 80
CHAPTER 4 EVALUATION OF THE RELATIONSHIP BETWEEN EDUCATION AND THE LABOUR FORCE IN THE
DEVELOPMENT CONTEXT . . . 82 4.1 Introduction . . . 82 4.2 The relationship between education and
the labour force as demand and supply
for development . . . 83 4.2.1 Demand for and needs of education .. 84 4.2.2 Identifying the needs and
esta-blishing priorities for demands
for education . . . 85 4.3 Policies for education and the labour
f o r c e . . . 87
4.4 Matching education to economic
develop-ment. . . . . 93 4.5 Supply of educated labour and
unemploy-ment ( 19 8 5-19 9 4 ) . . . 9 6
4.5.1 Methods of projecting employment . . . . 96 4.5.2 Estimating the labour growth of the
labour force with secondary school
qualifications . . . • o 100
4.5.3 The results of the projections . . . 103
4.6 Additional employment opportunities and the government's target on
pre-employ-ment training . . . 105
4.7 The "push-down" effect on occupation . . . 110
Table Title page
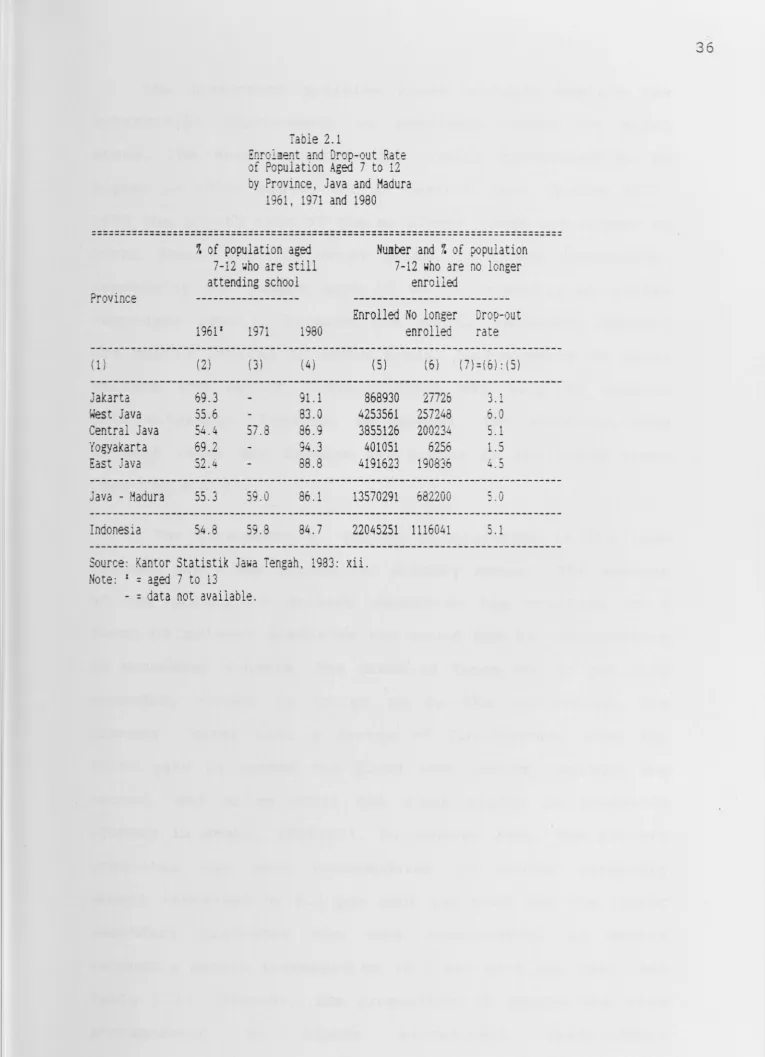
2.1 Enrolment and Dropout Rate of Population Aged 7 to
12 by Province, Java and Madura 1961,1971 and
1980 . . . 35
2.2 Enrolment Rate by Age, Sex and Place of Residence
Central Java 1971, 1980 and 1985 . . . 37 2.3 Enrolment and Graduate of Primary and Secondary
School, Central Java 1975-1985 . . . 38 2.4 The Potential Labour Supply from Several School
Levels, Central Java, 1975-1984 . . . 40 2.5 The Dro-out, Repeated and Promoted Rate of Pupils
in Primary and Secondary School, Central Java,
1981 . . . 43 2.6 Percentage Distribution of School Age Population
by Age, Sex and Type of Activities, Central Java
1980 . . . 46 2.7 Graduate Rate by Level of Education, Central
Java 1974, 1980 and 1985 . . . 47 2.8 Percentage Distribution of Population Aged 10
Years and Over by Educational Attainment, Central
Java 1971, 1980 and 1985 . . . 49 3.1 Estimates of Sectoral Labour Absorption Coefficient
Central Java 1976-1985 . . . 56 3.2 Percentage Distribution of Population 10 Years and
Over Who Are Working by Level of Completed
Educa-tion and Industry, Central Java 1980 . . . 62 3.3 Percentage Distribution of Persons with Secondary
Levels of Educational Attainment According to Occupational Categories, Central Java 1971 and
1985 . . . 63 3.4 Disparity Between Actual and Expected Employment
Growth, Central Java 1980-1985 . . . 66
3.5 Labour Force Participation Rate by Level of
Educa-tion and Sex Central Java 1971 and 1980 . . . 68
3.6 Number of Secondary School in Central Java by
Level and Type of School 1975-1985 . . . 74 3.7 Unemployment Level by Age, Sex and Place of
Residence, Central Java 1980 . . . 76 3.8 Unemployment Level by Age, Sex and Education of
Urban Areas, Central Java 1980 . . . 77 3.9 Job-Seekers and Placement by Educational
Attainment, Central Java 1971, 1980 and 1985 . . . 79
4.1 The Government's Target on The Needs of Labour Training by Sector and Occupation, Central
Java 1 9 8 4 - 1 9 8 9 . . . 89
4.2 Gross Enrolment Rate of Secondary School Level
Central Java 1971,1980 and Projected Rate for
1 9 9 0 . . . 102 4.3 Employment of Secondary and Tertiary Graduates
1985 and Projections of Employment 1989 and 1994
if
viii
4.4 Additional Employment Opportunities and The Government's Target on Pre-employment Training
by Sector, Central Java 1984-1989 . . . 107 4.5 Additional Employment Opportunities for
Secondary Graduates and The Government ' s Target for Pre-employment Training, Central Java
1 9 8 9 - 1 9 9 4 . . . 109
4.6 Disparity Between Demand and Supply of Labour Force in Educational Categories and the
Figure
LIST OF FIGURES
Title
2.lA Enrolment Rate by Age, Sex and Residence
page
Central Java 1 9 8 0 . . . 31 2.lB Enrolment Rate by Age and Residence
Central Java, 1971, 1980 and 1985 . . . 32 2.lC Enrolment Rate by Age and Sex, Central Java
1971, 1980 and 1 9 8 5 . . . 33
3.1 Labour Growth and Unemployment Level
Central Java 1980 and 1985 . . . 71
4.1 Ladder Structure of School Types and The Labour
APPENDICES
Appendix Title
2.lA Number of Pupils Aged 10 to 12 Years Who Are Never Enrolled and Graduates Who Are Not
Accommodated in The Higher Education
X
page
Institution, Central Java 1975-1985 . . . 125 2.lB Estimates Number of Drop-out Pupils from
Primary School Central Java 1975-1985 . . . 126
2.lC Estimates Number of Labour Supply from Below
Primary School, Central Java 1975-1984 . . . 127 2.lD Estimates Number of Drop-out Pupils from
Junior Secondary School, Central Java 1975-1984 .. 128 2.lE Estimates Number of Labour Supply from Primary
School Level, Central Java 1975-1984 . . . 129 2.lF Estimates Number of Drop-out Pupils from Senior
Secondary School, Central Java 1978-1984 . . . 130 2.lG Estimates Number of Labour Supply from Junior
Secondary School, Central Java 1978-1984 . . . 131
4.1 Estimates of Sectoral Employment Central Java
1989 and 1994 . . . 132
4.2 Estimates of Labour Force by Educational
Attain-ment, Central Java 1989 and 1994 . . . 133
4.3 Estimates of Demand for Educated Labour, Central
Java 1989 (Using Sirageldin and Li's Method) . . . . 134
4.4 Estimates of Demand for Educated Labour,
Central Java 1994 (Using Sirageldin and Li's
Method) . . . 135
4.5 Estimates of Educated Employment, Central Java
1989 and 1994 (Using Sirageldin and Li's
Method) . . . 13 6
4.6 Estimates Employment of Junior Secondary
Graduates, Central Java 1989 and 1994 (Using
Simanjuntak's Method) . . . 137
4.7 Estimates Employment of Senior Secondary
Graduates, Central Java 1989 and 1994 (Using
Simanjuntak's Method) . . . 138
4.8 Estimates Employment of Tertiary School
Graduates Central Java 1989 and 1994 (Using
Simanjuntak's Method) . . . 139
4.9 Estimates of Educated Employment, Central
Java 1989 and 1994 (Using Harbison's
C H A P T E R 1
INTRODUCTION
1.1 Introduction.
One of the major constraints on the economic and social
development in Indonesia -is the scarcity of skilled
manpower. In the government sector, there is a shortage of
efficient administrators and planners, in the business
sector, of qualified personnel, engineers and technicians;
in agriculture, of enlightened farmers and skilled farm
workers; in education and heal th of sufficient teachers,
nurses and doctors, and in society at large of technical
knowledge, scientific thought and personal initiative.
In order to achieve adequate skilled manpower,the
government of Indonesia has increased the development budget
for education from Rp.36.6 million in Pelita I (First Five
Year Development Plan I, 1969-1974) to Rp.1,258.3 million in
early Pelita IV ( 1985-1986-). The proportion of the
development budget, which is the remainder of the routine
budget ( Beeby, 1982: 43), allocated to education rose from
three percent in Pelita I, to nine percent in Felita II and
around 5.5 percent in Pelita III and IV (Beeby, 1982:2-6 and
MEC, 1986:54). According to The World Bank (1982:109 ) in the
past decade, the share of GDP allocated to education in
Indonesia would be roughly equal to the average for all
However, the result is that shortages of educated
manpower exist side-by-side with a surplus, or unemployment
of educated labour, because the pattern of educational
development has tended to create an imbalance in the supply
of various categories of manpower. The problem of human
resources development is not only vertical (with respect to
ratios of manpower by educational categories), but also
horizontal (in terms of regional and sectoral distribution
of trained and skilled manpower). The rural and agricultural
sectors suffer the most from acute shortages of skilled
labour, because the skilled portion of the labour force is
usually attracted to the major cities. Imbalances in the
supply of various categories of manpower, therefore, are
related to educational and manpower policies.
2
However, educational reform is not enough to cope with
the problem of unemployment among educated people, because
the unemployment problem is also related to the level of
labour absorption of the economy. In Indonesia, there is a
paradox between the educational system on the one hand,
which tends to be biased in its preparation of trained
labour as a result of social pressure, and which seeks
equality in educational opportunity, bringing about a high
rate of supply of educated labour, and economic policies on
the other hand, which tends to be biased towards being
capital-intensive as a result of the "ideology of economic
1.2 The aims of the study.
The aims of the study are:
1. to identify the schooling status of the school age population in 1980. By identifying the schooling status of the school age population, the effectiveness and tne efficiency of the current educational policy for meeting manpower requirements can be measured, because the target population of these educational policies is mostly the school age population.
2. to identify the employment status of people who have graduated from secondary school. The educational process can be regarded as investment in human capital which tries to develop appropriate productive skills for pupils before they enter the 1 abour force. The employment status of secondary graduates is one measure of the effectiveness of human capital investment and the effectiveness of the schooling process. The employment status of secondary school graduates can also be used as an indicator of whether educational policies and employment policies are integrated or not.
3. to estimate the demand for and supply of educated labour between 1985 and 1994. As the government has already planned its manpower requirements throuah .., the educational system and economic growth for the period 1984 to 1989, it is necessary to evaluate the effectiveness of its plans. For
this purpose, estimates are made of the demand for and
4
1.3. The selection of Central Java as the area of
study.
Central Java has been chosen for this case study of the
relationship between education and the labour force for
three major reasons relating to its history, demography and
the prevailing economic conditions.
In the period 1815-1942, there were at least three
factors which were associated with educational improvements
in the Dutch East Indies. First, education was more
developed in the areas where there were strong religious
movements, whether Christian or Moslem (Jones, 1976:23-30).
It is understandable, because in the colonial period,
educational institutions usually were developed by religious
movements. Second, education was more developed in the areas
which were directly ruled by the colonial government
(Furnival, cited in Jones, 1976:25). As a result of the
"ethical policy" which was about into being throught the
interaction of the central government, Christian political
parties and liberal humanitarianism in The Netherlands
(Sutherland, 1980:45), the colonial government educated
indigenous people in the areas directly under their control
to be clerks to serve the bureaucracy. Third, education was
also more developed in the industrial areas, because, as
Penders mentioned, in these areas the demand for
Western-trained people was higher than in the areas where
During this period in Central Java, a predominantly
Moslem area, educational performance was categorized as low
compared with North Sulawesi and the Tapanuli region in North Sumatra (both Christian), or the Yogyakarta and Priangan areas of West Java ( both Moslem) . Central Java, with the exception of the Surakarta and Yogyakarta sultanate areas, was directly ruled by the colonial government and was not affected much by industrialization. After Independence in 1945, Central Java became one of the major areas of interest for the central government (Beeby, 1982:31). However, in terms of educational attainment, Central Java is still below the national average (Meyer and Larson, 1987:1-7). This is elaborated in greater detail in Chapter 2.
Central Java, in 1980, was one of the most densely populated provinces in Indonesia, with 634 people per square kilometre (BPS, 1984:455), around twenty percent of the Indonesian population. In terms of its educational budget, Central Java is a province categorized as a "giant consumer" of educational resources (the Ministry of Education and Culture*, 1986:364). The level of participation in the labour force is above the national average, especially for women (BPS, 1984: 467). However, the per capita income is only about 55 percent of the average national per capita income (BPS, 1984:459).
6
Population pressure in Central Java has resulted in a
decreasing average size of landholdings and difficulties in
improving productivity in the agricultural sector. The
average landholding is only 0.3 hectare per peasant
household (BPS, 1984:369).
The government puts a high priority on
industrialization, and the trade and services sectors as
ways of compensating for the decreasing agricultural
productivity resulting from population pressure.
Educational policies are crucial for improving the
educational level of the population in the region. Poverty
in the population is a major constraint on improving
education. Nevertheless, improving education is also assumed
to be one way of solving poverty. However, its seems that
poor educational policies in Central Java might have created
people whose skills do not match labour force needs. Poor
educational policies waste resources, create unemployment
and lead to an increase in the extent of poverty.
1.4. Theoretical framework.
Human capital theory states that human resources are an
important part of the production process. This means,
according to Becker, Aukrust, Solow and Schultz (cited in
Vaizey
factors
et.al.,
through
productivity.
1972:25-36), that improvements
training and education will
Investment in education is
in human
improve
I
I
contributing to economic growth and economic equality
( Harbison and Myers, cited in Blaug, 1970: 52 ) . However,
before gaining jobs, graduates ~ust wait before joining the
labour force, because particular production processes select
particular skills as appropriate and also determine the
quality of labour required to improve the production process
(Blaug, 1970:36).
Sirageldin and Li (1983:50) identified four factors
involved in assessing the problem of the level of employment
among educated people: the labour force factor, the manpower
requirement factor, the educational simulation factor and
the manpower policy factor.
1. The labour force factor consists of the ratio of entrants
to the labour force to departures from it, attrition rates
among educated people in particular and in the labour force
as a whole.
2. The manpower requirement factor requires specification
of the size and quality of the labour force needed in the
various sectors of production, such as the agricultural,
manufacturing and services sectors. Different areas of
production need different specific skills and the magnitude
of the needs depends on the magnitude of capital
accumulation in each sector. Therefore, sectoral production
targets of government policy reflect the magnitude of
demand for manpower. The quality of manpower needed can be
3. The occupational categories of the labour force seem to
be related to the level of education of the workers. For
example, I primary school graduates are expected to be
"unskilled II
workers, and senior secondary graduates are
expected to be semi-skilled workers. The supply of each type
of manpower will be influenced by schooling factors such as
enrolment, repetition and drop-out rates in the educational
simulation model.
4. The manpower policy factor- allocates the supply of
labour
sectoral
and educational
occupational
qualifications to
matrix, according
the
to
overall
specific
priorities (Sirageldin and Li, 1983:50). In relation to
employment for educated people, the manpower policy sets up
the priorities, for example, economic growth for a strategic
sector such as oil mining, by allocating the educational
8
budget to produce the appropriate graduates to support this
strategy. The manpower policy makes policies to adjust or
balance supply and demand.
1.5 Theoretical problems.
There are at least five general issues which need to be
considered relating to education and employment. The first
problem is that education is a consumer good and at the same
time an investment good, while employment is a matter of
. ~ t
inves .._men . The educational system reflects the social
demand of and the needs for education, while employment only
ii
Therefore the educational process tends to create graduates who do not always match the needs for trained labour. This situation brings about a surplus of a certain graduates side-by-side with other shortages of labour. This is the second problem. The third problem is that government policy favours an imbalance in manpower as a result of limited resources or unfortunately, as a result of political pressures . The fourth problem is the discrepancy between the rate of growth in the educational system and the rate of economic growth. The shortage of employment opportunities is caused by the lack of demand for labour or the lack of labour absorption in the economy. The last problem is the mismatch between job expectations and job opportunity.
Generally speaking, education is an intermediate goal of most governments and is regarded as the method used in order to satisfy social and economic priorities (Anderson, 1967:12). Educational policies, ideally, put equal weight on social and individual benefits. However, most governments appear to put a high priority on the social return of education, by improving the number of educated people. The government tends to put a high value on the social rate of return of education, based on the assumption that the maximum supply of educated labour will result in cheaper
labour, because employers can
The private recruiting labour.
cost of education as incurred
minimize wage levels
rate of return relates by the individual to
in
the
10
benefit of education as realized by the same individual. The
social rate of return relates the costs of education as
incurred by the State to the benefit of education as
realized by the same State ( Vaizey et. al. , 19 72: 72 and
Psacharopoulos, 1983:21). Maximising the supply of educated
labour also tends to contribute to a higher social return,
if the government succeeds in minimizing wages in the public
sector. In addition, society values education as a way of
satisfying individual interests as i t leads to social
mobility. The assumption is that the higher the level of
education, the higher the socio-economic level (Blaug,
1973: 27). Therefore, wage and social status expectations
become motivating factors in the schooling process. That is
why the educational system is partly responsible for
unemployment through creating a mismatch between employment
opportunities and expectations (Blaug, 1973:8).
The maximum supply of educated labour is not always
matched with the numbers and qualifications needed by the
production process. Skill differentials occur as a result of
differences in the supply of labour, but wage differentials
occur as a result of variations on the demand side. In
determining the volume of employment, one important factor,
apart from wage rates, non-labour costs, profit and
production techniques, is market demand (sales) (Lester
cited in McCormick and Smith, 1967:35). In recruiting
labour, the employer intends to take maximum benefit from
labour recruitment, which is based on qualifications,
market demand (sales), minimum marginal wages and the
appropriate volume of new employment, is an important factor
in absorbing the labour supply.
The mismatch between skills and opportunities may be
caused by a bias against preparing skills that are needed
in the modernization process. In Indonesia as a whole as
well as in Central Java, the government cannot meet either
the social demand or the market demand for education,
because of limited school facilities and limited resou=ces.
Most parents prefer vocational schools, because they assume
this type of school leads more quickly to job opportunities
than do general schools (Beeby, 1982:174). The government
cannot meet this demand for vocational schools, because
vocational schools consume more resources than general
schools. The same also occurs with science and technological
education, which consume substantial resources and have
insufficient teachers, compared with liberal arts education
(Beeby, 1982:21). The implication of this is that both
public and private educational authorities provide more
educational facilities for general education and liberal
arts education than for vocational schools and science
education. This situation creates biases against the
preparation of skills that are needed for modernization and
I
Ii
12
A structural wage bias is one of the causes of unemployment
(Simanjuntak,
among educated 1982:17). Job
people preferences
in
are
Indonesia
usually
determined by consideration of the wage level as well as
long-term employment prospects, job location and working
conditions. Employment in the public sector in Indonesia
reflects a wages bias, because employment in the public
sector attracts a higher wage than the private sector (MEC,
1986:136). This situation tends to influence educated people
to search for jobs in the public sector and even
influences educated people to delay accepting private sector
jobs if a vacancy should become available. In Indonesia
the public sector is preferable, because public sector jobs
have higher salaries and better prospects for career
advancement, health care, pension funds and social prestige.
Usually people consider the comparative total net
advantages, not only comparative wages, as a part of job
decision making (Rottenberg, 1967:183). This structural wage
bias creates job preferences that will be kept in mind and
influence job seekers in bargaining in the labour market,
encouraging them to wait for an attractive public sector
job. Thus, the longer period of waiting for employment in
the public sector is likely to lengthen the unemployment
period for job seekers.
The family characteristics of educated people may also
be a cause of unemployment. Educated people usually come
support them while they wait for their preferred job.
Therefore, the stronger the financial support of their
families, the longer the potential duration of unemployment.
Employers themselves are another factor influencing the
extent of unemployment among educated people. If there is a
shortage of a certain skill, employers usually prefer to
substitute i t by providing training for their own employees
with a lower level of the skill needed ( Reder cited by
Vaizey et.al., 1972:107). Employers usually also take time
to consider the marginal costs compared to marginal
productivity of labour before they hire a new employee
(Machlup, 1969:42). Employers take more time to recruit
educated labour than less educated people, because educated
workers usually have higher income expectations,
particularly if they come from affluent families. Employers
must consider the skill characteristics of the applicants
and determine whether these characteristics are appropriate
for raising their productivity. Because of this, educated
people have to seek a specific labour market. Educated
applicants frequently take a longer time before finalizing
an employment contract.
1.6 Regional problems.
Particular regional problems appears to exacerbate the
problems of the relationship between employment and
education . According to human capital theory, the labour
1964:7-I!
II
14
8). This implies that educated people are likely to find
jobs more quickly than uneducated people. Therefore, there
is a negative correlation between educational level and
unemployment rate (Levi than, et. al. , 1974:100). This
correlation is plausible, however, the situation is reversed
if the "scarcity" of educated people disappears ( Blaug,
1973:29). The negative correlation between educational level
and unemployment rate might be supported by some factors
For example, educated people have access to relatively high
levels of information and are likely to have better access
to the labour market. They also have the possibility of
moving to a job requiring less education, if they are unable
to find a job demanding the appropriate educational level.
Employers are more interested in educated people than
uneducated, if the educated people are willing to accept the
same lower wage as less educated people.
Although the human capital theory is plausible,
Central Java data (BPS, 1983:154) as well as Indonesian data
(BPS cited in Clark, 1983:5) show a contrasting situation.
There is a positive correlation between educational level
and unemployment rate, at least up to senior secondary
school level, and this correlation occurs in all age groups (15 years and over).
According to human capital theory, responded only to earning prospects Therefore, maximum expected life-time
investment decisions
(Becker, 1964:56).
consideration for araduates of . J a certain level of education
in choosing whether or not to further their education
(Becker, 19 6 7: 40) . However, in chaos ing ~o further their
education, they are affected by a number of constraints: the
availability of educational facilities, financial suppo_rt
and the adequacy of their academic performance in relevant
subjects. In Central Java as well as in Indonesia as a
whole, these constraints create fierce competition among
applicants to gain places in higher levels of education.
This competition also influences gradua~es in choosing
programs. Graduates may choose options that do not guarantee
maximum life-time income as long as the alternatives have
positive net advantages. In this process, graduates
calculate the risk of unemployment that is experienced by
graduates from that school. Therefore, the unemployment risk
can be considered as one factor involved in choosing to
further one's education.
In Central Java, as well as in Indonesia, there is a
cultural bias in job preference towards the public sector
(Sudomo cited in Kompas, August 1987). This cultural value
on public sector employment in Central Java is a reflection
of Javanese social stratification that classes government
officials as "priyayi" (literally meaning "the King's
brothers and sisters"), the second highest class after the
king (Harn, 1972:40). School, in the eyes of Javanese, is
likely an avenue for graduates to move "from the bush to the
l
I
Ii
16
higher levels of income gained in public sector employment.
The income level of government officials in 1969 in urban
areas of Central Java was 22 percent above
differential was
the average
also shown
(Sundrum, 1974:89). This
nationwide in Indonesia in 1976 (BPS cited in MEC,
1986:302).
In Java as a whole, poor agricultural prospects also
create pressure on people to move to other employment
sectors (White, 1973:32). These sectors need relatively high
skills and higher educational prerequisites than the
agricultural sector. The average size of landholdings among
peasants declines from year to year, while the income
disparity between the agricultural sector and others widens
(Wie, 1986:115). The agricultural sector contributes only 42
percent of regional income but absorbs more than half of all
employment (BPS, 1983: 133). These problems in the
agricultural sector make schooling seem to be the road to a
new "promised land", jobs in the service sectors.
Cultural values, the structural wages bias, the school
preparation bias and agricultural pressure all tend to
result in narrow and specific job expectations for
graduates, as they all seem to gravitate in similar
directions: schooling followed by work in the public or
service sectors. Their decisions imply their readiness, for
a certain time, to be unemployed. The higher the job
devoted to their search. The stronger the cultural values, the structural wage bias and the agricultural pressure, the greater the number of people is likely to be who make the decision to risk lengthened unemployment in order to secure acceptable jobs and, consequently, the longer the average duration of unemployment.
The existence of a pool of educated unemployed people implies that there are several causes of unemployment. Various analyst have attributed i t to the following causes:
1. Low demand for labour is caused, according to Keynesian theory, by an inadequate level of aggregate demand for labour, or as the Marxian model stated, a lack of capital accumulation caused by low productivity. In the Keynesian model, aggregate demand for labour depends on levels of savings, investment and the prospect of sales. In the Marxian model, unemployment is caused by low productivity. Low productivity occurs when the overall ratio of capital to labour is too small
level is too low to absorb all labour
(Robinson cited by Blaug, 1973:1).
and average wage
into employment
2. The lack of labour market information among people and among employers (Leibenstein, 1966:67).
educated
3. Inadequate inefficiencies
skills among educated people caused by in the schooling process (Blaug, 1973:13). 4. High income and wage expectations among educated people
5. An over-supply of educated people compared to the
employment opportunities, resulting from both demographic
factors and ineffectiveness of educational policy.
Ineffectiveness of educational policy can be seen in Central
Java, for example, in unsuccessful government policies for
introducing more secular curricula in the religious training
schools (Kantor Wilayah Departemen Agama Jawa Tengah,
1985:12)
1.7 The source of data.
18
The main source of data for this study is demographic,
with economic data forming a complement. This study is also
supported by data on educational policies and economic
policies. The demographic data includes the 1971 and 1980
Indonesian Population Censuses, Intercensal Population
Survey 1985, Jawa Tengah Dalam Angka ( Central Java Year
Books) and the Five Year Development Plan. This study
concentrates on the secondary level of education.
Information on the supply of educated labour was obtained
from educational statistics data from 1974 to 1985 produced
by Kantor Statistik Jawa Tengah. The data on policies is
mainly based on publications from the Ministry of Education
and the Provincial Government.
1.8 Limitations of the data.
There are at least four limitations to the data used
needed to assess the rate of private return to education. By
looking at the rate of return to education from a series of
data, we can assess the trends, and consider whether the
growth rate of labour with a certain education qualification
is acceptable or not. This is a starting point to evaluate
policies for a certain level of education. Unfortunately,
the data available do not provide this kind of information.
Secondly, the "time reference" which defines employment
in the 1971 and the 1980 censuses are not the same.
Emp 1 oymen t in the 19 71 census is defined as "working at
least two days during the previous week" while in the 1980
census i t is defined as "working at least one day during
the previous week" (see Jones in McDonald, 1983:368). The
remaining data relating to education and the labour force
( Sakernas and the 1985 survey included), use the second
definition. However, because of these different definitions
of employment in the 1971 and the 1980 censuses, this study
will avoid comparing employment levels between these two
sets of data.
Thirdly, in order to estimate future employment, the
labour absorption coefficients of sectoral economic
activities are needed. Unfortunately, there is no such data
for 1971. However, the data from 1976 to 1985 are available
and especially, the data on the labour absorption
coefficient for educated people are also available from 1980
Fourthly, in order to evaluate educational policies,
data on educational expenditure and budgets are needed.
Daroesman (1971:62-63) supported by Beeby (1982:41-45),
identified five problems here:
1) In Indonesia, there is no formal devision of
responsibility for education expenditure between levels of
government and at the central government level, between
several departments.
2) A substantial proportion of total expenditure is
financed in practice by state and private bodies, which have
no formal responsibility for financing education.
3) There is no standard accounting procedure for lower
levels of government.
20
4) Published data do not always distinguish education
expenditure from expenditure on other services.
5) Published data only give budget estimates and not actual
expenditure; this makes trends almost impossible to trace,
even within one department.
Because of lack of data on
budgets, this study utilizes
gross enrolment ratio, as a
labour growth in the future,
educational expenditure and
government targets for the
way of estimating educated
in order to evaluate the
educational policies which relate to future employment.
1.9 Methodology.
The description of schooling and employment status of
the Censuses and Survey data. Trends for educational attainment, labour force participation and unemployment rates can also be examined by cross tabulations from 1971 and 1980 censuses and the 1985 survey. To evaluate government policies relating to future development, a projection of the demand for and supply of educated labour for 1985 to 1994 is provided . Data on future sectoral economic growth projected by the government is used to estimate employment opportunities in the future, including employment opportunities for secondary school graduates .
1.10 The organization of the thesis.
This thesis consists of five chapters. The Introduction explains the aims of the study, the reasons for selecting Central Java as the case study, the theoretical framework, problems relating to educational policy, the source of data and the outline of the study.
Chapter 2 examines the educational situation in Central Java. This chapter discusses the historical and demographic background of the schooling process in Central Java and its
Java population. This chapter also examines reasons behind improvements in enrolment.
Chapter 3 is a detailed examination of the educational level of the labour force in Central Java. The economic structure of Cen_tral Java is shown as one factor that
22
influences employment rates of educated people. The growth of and changes in the economic structure are explained in this chapter, as the level of employment is also determined by the level of economic growth. This chapter also explores the educational level of employees in particular industries and unemployment rates among educated people, especially those who graduated from secondary school.
labour and employment are needed to evaluate government
C H A P T E R 2
THE EDUCATION SITUATION
2.1 The Structure of the Indonesian school system.
This section explains the political and
institutional background of the educational system in
Central Java.
In Indonesia, the educational system and its
structure is a product of the controversy between two
major political trends:
and decentralization
religious versus secular politics
versus centralization (Polomka,
1971:55 and Beeby, 1982:27-31). The current situation
reflects the dominance of secular and centralistic
policies. Presidential Decision Number 34(1972) and
Presidential Instruction Number 15 ( 1974) gave authority
to the Ministry of Education and Culture to manage all
education and training ( Bee by,
"pseudo-governments" outside the
1982:243). However,
legal government still
appear to be a potential problem for educational policy
in Indonesia (Polomka, 1971:55). The realization of the
Presidential Instruction was very slow and difficult as a
result of different political and religious factions
(Beeby, 1982:37).
The Department of Education and Culture is divided
into six sections. Two of them, the Inspector General's
section and the Director General of Education, deal
directly with schools. In each province, a Director of
Education (Kepala Perwakilan) represents the Department.
Under the authority of the Director of Education, administrators and inspectors administer secondary schools and supervise the inspectors of primary schools.
To support staff at the provincial level, the provincial government also has its own education office
(Dinas), under the Department of Home Affairs, to manage
financial and logistic support for education. The Dinas administers primary schools and puts its own inspectors (Kabin) into regencies (Kabupatens). Apart from the De partment of Home Affairs, the Department of Religious Affairs also has primary schools and secondary schools which provide either mixed secular-religious or only religious education. Other departments, such as the Department of Agriculture, Department of Health and Department of Industry also provide special schools at the secondary level for vocational training ( Daroesman, 1971:65-66 and Beeby, 1982:33,241-243).
All these departments have a limited role in maintaining education, because they only directly manage public schools. Apart from public schools, there are private schools which are supported by "yayasan"
(foundations), mostly under the authority of religious
Primary school takes six years to complete, while
both junior and senior secondary school have a 3 year
course. At both the junior and senior secondary level,
there are two major types of schools: general academic
and vocational schools. The vocational schools for _
example commercial, technical, home economics and teacher
training schools (senior secondary)-- prepare students
for the labour force, rather than for further study or
tertiary education.
2.2 Age structure and the school-age population.
The definition of "school age population" depends on
two factors: the structure of the school system in terms
of the usual age at entrance and duration of each level
of education and the legal age limits of compulsory
education (United Nations, 1966:8).The Indonesian
government plans to introduce compulsory education for
primary school by 1995.
In the Indonesian school system, the definition of
"school age-population11
changes from time to time. Before
1971, the school age population ranged from 7 to 19, but
after 1971 the range was 7 to 18. Before 1971, the
duration of primary school was 7 to 13 years, while for
junior secondary i t was 14 to 16 and for senior
secondary, 17 to 19 years. After 1971, the duration was 7
to 12, 13 to 15 and 16 to 18 years respectively.
The age structure of the school age population is
influenced by fertility, mortality and migration. In the
past, high birth rates contributed to the rapid growth in
size of the school-going population. Generally speaking,
high birth rates result in lower educational perfor~ance.
High levels of fertility and expected declines in
mortality imply the growing number of school age people _
and their increasing proportion in the total population
(Jones, 1971:330).
Central Java experienced a declining total
fertility from 5. 6 children per woman in 1961 to 3. 8
children per woman in 1980 (BPS, 1984:3). Life expectancy
increased from 49 years in 1971 to 54 years in 1980. The
dependency ratio also decreased from 845. 7 per thousand
in 1971 to 756.6 in 1980 and i t is expected to be about
590 per thousand in the year 2000 (BPS, 1984:4).
The decreasing fertility rate and dependency ratio
accompanied by the increase in life expectancy have given
greater opportunities to people to provide more financial
support for their children's education. Al though the
fertility rate has already declined, the schooling
problem of the school-age population is not yet solved,
because according to BPS projection (medium variant),
even the fertility decline the school-age population will
increase in size by 113 thousand children per year till
the year 1990 (BPS, 1984:5). Additional educational
facilities will therefore be needed. Moreover, children
who do not attend school are a latent problem in Central
2.3 Enrolment, progression and graduate rates.
2.3.1. Determinants of school enrolments.
Chernichosky and Meesook (1985:17) found that in
Indonesia there are two factors working as determinants
household characteristics and of school enrolments:
availability of schooling facilities. Factors described
as household characteristics were fertility behaviour,
and the age of the household wealth, social norms
children. Factors described as "availability of schooling
facilities" refer to distance between the household and
school building and whether further education was
available in the community.
Fertility behaviour, a part of household
characteristics, has a complex relationship to school
enrolment of children. Chernichosky and Meesook (1985:18)
found that in urban areas, the size of the household, in
terms of the number of children has a negative
correlation to school enrolment. The greater the number
of children in the household, the more likely i t will be
for parents to send their sons, but not their daughters,
to school. Therefore, the smaller the number of children
in the household, the higher the enrolment of the
children. But Chernichosky and Meesook (1985:20) also
found that in rural areas of Indonesia, the larger the
family size the more likely children will be enrolled at
school, because children benefit from their large family.
In rural areas, members of the extended family are
available to help a father send his young children to
school.
While the size of the family has no clear relation
to school enrolment, there is a clear relationship
between wealth and school enrolment. Wealth has a
positive correlation with school enrolment. This means
that children from the lowest income group will be more
likely to be unschooled (Chernichosky and Meesook,
1985:15). This finding is parallel with Mani's (1983:15)
finding on the study of determinants of educational
aspiration among Indonesian youth.
Social practice such as sex discrimination in the
household have a critical effect on enrolment. In
Indonesia, in secondary schools and above, male children
have greater opportunities to enrol at school. This
social practice can also be explained by looking at the
wage or salary differential between males and females.
Males generally have a higher salary than females.
However, sex discrimination has a strong correlation with
the educational level of the parents. The higher the
level of education of the parents, the higher their
enrolment of the children for both males and females
(Chernichosky and Meesook, 1985:16).
Religion has also a correlation with enrolment.
Mani (1983:41) found that children from Catholic or
Protestant families have a higher enrolment than children
from Moslem families. According to Leibenstein (1966:61),
followers and their priests is negatively correlated with
the need for achievement in education. This is because
those groups whose religious beliefs and practices
emphasize contact with a priesthood that mediates between
the people and a holy-book are less likely themselves to _
have as high a reverence for the written word as do those
groups who receive their inspiration directly from the
sacred texts. Trust in the priest may impede people's
curiousity and discourage them from seeking knowledge
directly from the written sources. The followers of the
largest social movement in Indonesia, called "Nahdatul
Ulama" (United Priests), are characterized by a patron-client relationship between the "kyai" (priest) and the
followers. The "kyais" have great authority in
interpreting the holy book (Koran) and the followers have
a certain type of belief called "taklid" (literally
meaning" follow"): "if you do not understand, follow the
kyai". According to Nahdatul Ulama, the kyai is heir of
the prophets ( Al Ulamaa' u warosaatul anbiyaa). The 1980
data show that in Central Java the regions which are
dominated by Nahdatul Ulama (Pekalongan, Pemalang, Tegal
and Brebes regencies) have a high illiteracy rate
(ranging from 36 per cent to 43 per cent), while Salatiga
regency (now municipality), which is dominated by
Protestants, has the lowest illiteracy rate (13 per cent)
(BPS, 1983:51).
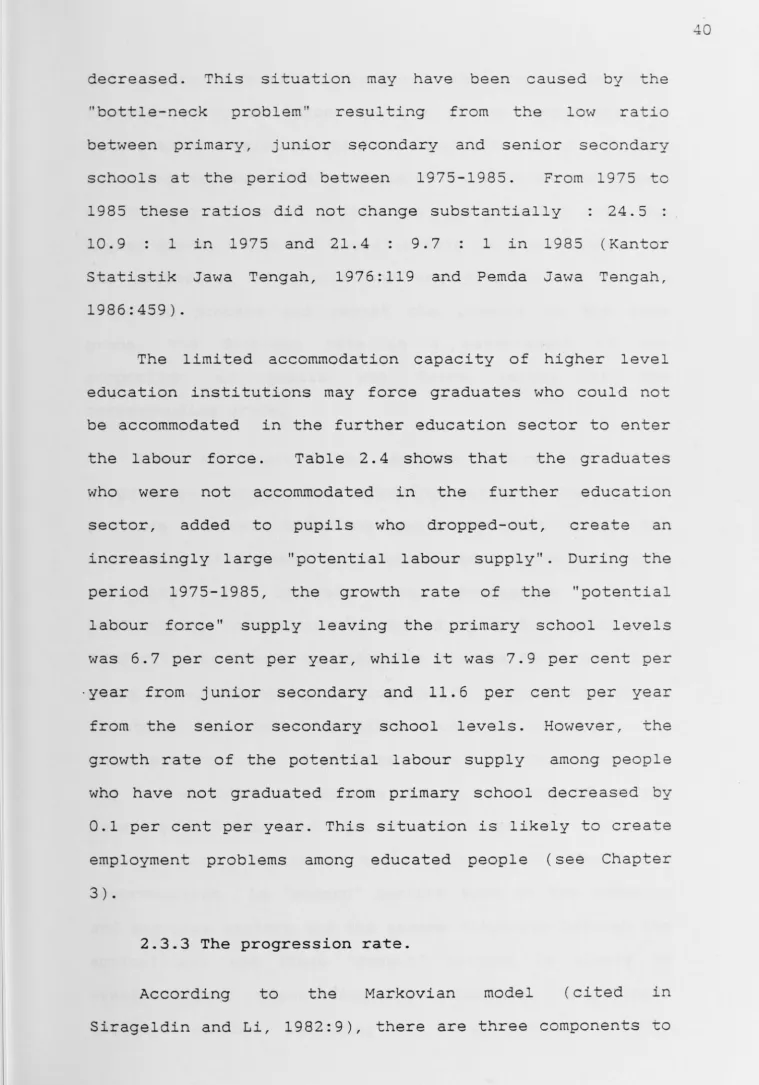
The effect of age on schooling operates through the
costs of schooling. Children's propensity to enrol and
attend school falls with age, particularly after age 11
(see Figure -2.la, 2.lb and 2.lc), because the direct and
indirect costs of schooling rise with age. With
increasing age, children are also affected by age-related
functions such as probability of marriage and probability
of entering the labour force. School enrolments are
function of children's age (Chernichosky and Meesook,
1985:20). According to Becker (1964:58) investors in
human capital are mostly young people partly because of
the cost in postponing their investment in the older ages
is higher than in their younger ages.
The availability of schools in the village
encourages children to attend school. The willingness to
continue to higher levels of education will improve when
they become available in the region and the children's
academic performance is of a higher standard
(Chernichosky and Meesook, 1985:13). In Central Java,
urban areas, particularly municipalities, provide more
school facilities than rural areas. This is shown by the
fact that during 1975 to 1984, school facilities in the
municipalities have accommodated 10 to 20 per cent more
students than the number of applicants from their own
areas each year, while in the regencies, the school
facilities
applicants
Tengah,
accommodated only 80
from their own areas
1980:89; 1986:112).
to 90 per cent of the
( Kantor Statistik Jawa
Limited accommodation
capacity of schooling facilities in rural areas may
impede the enrolment rate in rural areas. In Indonesia
as well as in Central Java, however, there may be several
I
I
90
80
-,11 70 -(L(i
,ri µ 60 -C: tll u
~ 50 -,11 tl,
, 0
-0
5
Figure 2.1 a Enrolment Rate
by
Age~ Sex
I 6
l ~:-~~-:j;
.
I
7
I 8
6. ~: :.5 r -?: 1 -F ·~ r~1-~. 1 e
and Residenoe, Central Java 1980.
I I
9 10
.u.. .g I
,
...1
I 12
I
13
l 14
I 15
'·.
I
16
' '
'".".\
.
"
I
17
-
.
·."-..
32
''
[image:43.798.7.778.19.1079.2]100
90
80
70
•
60O'
0
...
C50 Cl
0
I. II
~
•O
30
20
10
Figure 2.1 b Enrolment Rate
by
Age
and
6 7
Pe3idenoe, Central Javn. 1971, 1980, 1985
e
0 6
+
X
9
'
0
iJr~=3n v' : : : •• .r:.. • : l 110 1 1 12 1J 14
t ·~ 7 i
:. .·: :.
:· C:~·::· t ·:.:::) , C_ ·:· ';
.... : -·: :. .··-.? · ... ·--:
( :,;,i:: l ·~;:c_ · -~·:::-.
. ·-: -. ,;. -·-· ' -~ :... -· :
[image:44.798.19.786.17.1073.2]•
~ 0
..
c ·e
(J
L. e
fl.
Figure 2. 1 c Enrolment Rate
by
Age
and
100 - . - - - , = - - - ,
S-ex, Central Jovo 1 971, 1 980 and 1 985
Q-90
80
70
60
50
Jo
20
10
o~--..---~---.---.----.---.---1
5 6 7 8 9 10 1 1 12
:i ~, l~ L .,:_I~;:,\~'~ ~
.·. ~· .. · ·• : · .. ' . ...,
.
0 rr~ l .~ t '?::· S ( f;P·:;: 1 ·?S6; 2;:.:}
V f er:~J ! e ! S?S f BFS: 1 ~~ef: :~;O}
1.3 14 15 16 17 18
[image:45.797.11.779.20.1078.2]I
they are "too far from school" or "schooling is too
difficult". These indicate that intellectual ability,
teaching methods and the distance between residence and
schools are also involved in school enrolment.
2.3.2. The enrolment rate.
Article 31 of the Indonesian Constitution clearly
states that every citizen has the right to attain a
decent
provide
education. Therefore,
wider opportunities
the
for
government
people to
has to
obtain
education. In other words, the government has to achieve
the highest possible enrolment rate. The development
strategy since the early 1970s has given high priority to
agricultural development and basic education. Introducing
the "village modernization program" and the "S.D. Inpres"
(providing a primary school for each village), as a
result of a Presidential Instruction, may affect two
things: increasing demand for _ schooling especially in
rural areas and increasing supply of school facilities.
The influence resulting from the II
oil bonanza II
resulted
in these two programs being very successful. There was a
considerable improvement in the enrolment rates at all
level of education,
During the period
especially at primary school level.
1961 to 1971, in Central Java, the
enrolment rate at primary school level increased by only
3 per cent (from 54.4 per cent to 57.8 per cent), but in
the period 1971-1980, the enrolment rate increased by
nearly 30 per cent (from 57.8 to 86.9 per cent :see Table
Table 2.1
Enrolment and Drop-out Rate
of Population Aged 7 to 12 by Province, Java and Madura
1961, 1971 and 1980
---Province
( 1 )
Jakarta West Java Central Java Yogyakarta East Java
7. of population aged
7-12 who are still
attending school
19611 1971
(2. ' J
69.3 55.6
54.4
69.2 52.4
( 3)
57.8
1980
( 4)
91.1 83.0 86.9 94.3 88.8
Number and 7. of population
7-12 who are no longer enrolled
Enrolled No longer Drop-out enrolled rate
( 5) (6) (7)=(6):(5}
868930 27726 3.1
4253561 257248 6.0
3855126 200234 5.1
401051 6256 1. 5 4191623 190836 4.5
---Java - Hadura 55.3 59.0 86.1 13570291 682200
Indonesia 54.8 59.8 84.7 22045251 1116041
Source: Kantor Statistik Jawa Tengah, 1983: xii.
Note: 1 = aged 7 to 13
- = data not available.
::, 0
5.1
[image:47.797.18.783.22.1078.2]The government policies above probably explain the
substantial improvement in enrolment rates in rural
areas. The enrolment rate is usually considered to be
higher in urban areas, but in Central Java, during
1971-1985 the growth rate of the enrolment rates was higher in
rural areas than in urban areas. This was surprising,
especially for people aged 16 to 18 (commonly at senior
secondary level), because the senior secondary schools
are mostly located in urban areas. Improvements in rural
welfare and better transportation may help to explain
this situation. However, in general, the enrolment rate
of both males and females was higher in the urban areas
(see Table 2.2).
The government's policy on education in the last
fifteen years has emphasized primary school. The success
of the policy on primary education has resulted in a
flood of primary graduates who could not be accommodated
in secondary schools. The dream of those who do get into
secondary school is to go on to the university. The
process works like a series of flood-gates; when the
first gate is opened the f load soon washes against the
second, and so on until the whole system is inundated
(Coombs in Beeby, 1966:20). In Central Java, the primary
graduates who were accommodated in senior secondary
school increased by 8.4 per cent per year and the junior
secondary graduates who were accommodated in senior
secondary school increased by 10.2 per cent per year (see
Table 2. 3). However, the proportion of people who were
[image:48.798.18.779.42.1125.2]