This is a repository copy of
Comparative evaluation of image reconstruction methods for
the siemens PET-MR scanner using the stir library
.
White Rose Research Online URL for this paper:
http://eprints.whiterose.ac.uk/112581/
Version: Accepted Version
Proceedings Paper:
Deidda, D orcid.org/0000-0002-2766-4339, Efthimiou, N, Manber, R et al. (4 more authors)
(2017) Comparative evaluation of image reconstruction methods for the siemens PET-MR
scanner using the stir library. In: 2016 IEEE Nuclear Science Symposium and Medical
Imaging Conference and Room-Temperature Semiconductor Detector Workshop
(NSS/MIC/RTSD). 2016 IEEE NSS/MIC/RTSD, 29 Oct - 06 Nov 2016, Strasbourg, France.
IEEE . ISBN 9781509016426
https://doi.org/10.1109/NSSMIC.2016.8069615
© IEEE 2017. Personal use of this material is permitted. Permission from IEEE must be
obtained for all other uses, in any current or future media, including reprinting/republishing
this material for advertising or promotional purposes, creating new collective works, for
resale or redistribution to servers or lists, or reuse of any copyrighted component of this
work in other works.
[email protected] https://eprints.whiterose.ac.uk/
Reuse
Unless indicated otherwise, fulltext items are protected by copyright with all rights reserved. The copyright exception in section 29 of the Copyright, Designs and Patents Act 1988 allows the making of a single copy solely for the purpose of non-commercial research or private study within the limits of fair dealing. The publisher or other rights-holder may allow further reproduction and re-use of this version - refer to the White Rose Research Online record for this item. Where records identify the publisher as the copyright holder, users can verify any specific terms of use on the publisher’s website.
Takedown
If you consider content in White Rose Research Online to be in breach of UK law, please notify us by
Comparative Evaluation of Image Reconstruction
Methods for the Siemens PET-MR Scanner Using
the STIR Library
Daniel Deidda,
Student Member, IEEE
, Nikos Efthimiou,
Member, IEEE
, Richard Manber, Kris
Thielemans,
Senior Member, IEEE
, Pawel Markiewicz, Robert G. Aykroyd, Charalampos Tsoumpas,
Senior
Member, IEEE
Abstract—With the introduction of Positron Emission Tomog-raphy - Magnetic Resonance (PET-MR) scanners the develop-ment of new algorithms and the comparison of the performance of different iterative reconstruction algorithms and the charac-teristics of the reconstructed images data is relevant . In this work, we perform a quantitative assessment of the currently used ordered subset (OS) algorithms for low-counts PET-MR data taken from a Siemens Biograph mMR scanner using the Software for Tomographic Image Reconstruction (STIR, stir.sf.net). A comparison has been performed in terms of bias and coefficient of variation (CoV). Within the STIR library different algorithms are available, such as Order Subsets Expectation Maximization (OSEM), OS Maximum A Posteriori One Step Late (OSMA-POSL) with Quadratic Prior (QP) and with Median Root Prior (MRP), OS Separable Paraboloidal Surrogate (OSSPS) with QP and Filtered Back-Projection (FBP). In addition, List Mode (LM) reconstruction is available. Corrections for attenuation, scatter and random events are performed using STIR instead of using the scanner. Data from the Hoffman brain phantom are acquired, processed and reconstructed. Clinical data from the thorax of a patient have also been reconstructed with the same algorithms. The number of subsets does not appreciably affect the bias nor the coefficient of variation (CoV=11%) at a fixed sub-iteration number. The percentage relative bias and CoV maximum values for OSMAPOSL-MRP are 10% and 15% at 360 s acquisition and 12% and 15% for the 36 s, whilst for OSMAPOSL-QP they are 6% and 16% for 360 s acquisition and 11% and 23% at 36 s and for OSEM 6% and 11% for the 360 s acquisition and 10% and 15% for the 36 s. Our findings demonstrate that when it comes to low-counts, noise and bias become significant. The methodology for reconstructing Siemens mMR data with STIR is included in the CCP-PET-MR website (www.ccppetmr.ac.uk).
D. Deidda is with the Division of Biomedical Imaging, LICAMM, School of Medicine, and the Department of Statistics, School of Mathematics, University of Leeds, UK. (e-mail: [email protected]).
N. Efthimiou was with the Division of Biomedical Imaging, School of Medicine, University of Leeds, UK and is now with the Institute of Nuclear Medicine UCL Hospital, London, UK.
K. Thielemans and R. Manber are with the Institute of Nuclear Medicine UCL Hospital, London, UK.
P. Markiewicz is with the Centre for Medical Image Computing, UCL, London, UK.
R. G. Aykroyd is with the Department of Statistics, School of Mathematics, University of Leeds, UK.
C. Tsoumpas is with the Division of Biomedical Imaging, LI-CAMM, School of Medicine, University of Leeds, UK. (e-mail: [email protected])
Daniel Deidda is supported by the University Research Scholarship, Univer-sity of Leeds. This collaboration is supported by the EPSRC (EP/M022587/1) Collaborative Computational Project in Positron Emission Tomography and Magnetic Resonance imaging (CCP-PET-MR): (www.ccppetmr.ac.uk). The conference attendance was supported by IEEE with the IEEE NSS-MIC Trainee Grant
I. INTRODUCTION
such as Ordered Subset Maximum a Posterior One Step Late (OSMAPOSL) [7] where the posterior density, which includes prior information, is maximised rather than the likelihood. In addition, another algorithm which uses prior information is Separable Paraboloidal Surrogate (SPS) [6]. The algorithm is based on finding paraboloidal surrogate functions for the log-likelihood at each iteration: that is quadratic functions that are tangent to the log-likelihood at the current image estimate. The ordered subset version was improved with the introduction of a relaxation scheme in the OSSPS algorithm and global convergence was proven [1]. These iterative algorithms are all implemented in the STIR library, which makes it easy to do a comparative study between them. Previous studies have shown comparisons of the performance of different ordered subset image reconstruction algorithms for PET-CT data. However a study regarding reconstruction algorithms performance with PET-MR data for commercial scanners is not available.
II. AIMS
One of the purposes of this investigation is to re-construct real data with STIR for the Siemens Biograph mMR using MLEM, OSEM, OSMAPOSL-QP (OSL-QP) and OSMAPOSL-MRP (OSL-MRP) reconstruction methods [23]. Their performance is analysed in terms of bias and coefficient of variation (CoV), using real data acquired with the Siemens Biograph mMR scanner with standard dose levels. In addition, we obtained low-counts datasets from the List Mode (LM) data by modifying the acquisition time from 3600 s to 360 and 36 s to allow the study of how a reduction in counts affects image quality. It has also been possible to generate different samples with equal numbers of events in order to study the reproducibility of the low-counts sample. Finally, an important feature of our work is that we evaluate the correction sinograms (attenuation, normalization, randoms and scatter) using STIR. This investigation and the procedure for iterative image reconstruction will be a useful guide for researchers who wish to study and extend image reconstruction and correction methods for the Siemens mMR scanner. The procedure for these evaluations were developed within the Collaborative Computational Project in Positron Emission Tomography and Magnetic Resonance imaging (CCP-PET-MR): (www.ccppetmr.ac.uk).
III. METHODS ANDMATERIAL A. Phantom and Clinical Data
The data used in this study were acquired with a Siemens Biograph mMR scanner at University College London Hos-pital. This scanner has 8 rings, each one divided into blocks of 56 LSO crystals (each crystal: 8×8×20 mm3). The axial field of view is 258 mm [5]. We used the Hoffman 3D Brain Phantom [9], which can provide a realistic approximation of the radioisotope distribution found in the normal brain. The phantom consists of a robust plastic cylinder ( Diameter: 20.8 cm, Height: 17.5 cm, Fillable volume: ∼ 1.2 l) and 19 independent plates within the cylindrical phantom. It was filled with 60 MBq 18
F-FDG and the acquisition time was 3600 s. The total number of events (prompts) including random and
scatter is about 109
, which represents a standard for brain acquisitions. The LM file was then partitioned so as to obtain the datasets with a lower number of counts. The latter was obtained by diminishing the acquisition time when creating the sinogram with STIR. The clinical data is a 240 s Cardiac
18
F-FDG scan of an anonymous patient injected with 153 MBq was acquired at University College London Hospital. The data correspond to the torso of a patient. Patient consented was obtained to allow the use of their data for research purposes. For the phantom data, in order to produce different samples the time acquisition was reduced from 3600 s to 360 and 36 s in order to reproduce a short frame dataset, which is by definition a subset with low-counts. The duration of the other samples is longer to take into account the decay rate and to give approximately the same expected number of events for each replicate. Hence the time window is calculated as follows:
∆tn=tn−tn−1 n= 1, ... ,10 (1)
where n represent the sample and we assume t0 = 0 and
t1= 36setc., and where
tn =−τln n e − t1
τ −1
+ 1
(2)
tn is the time reached at thenthsample acquisition andτ is
the reciprocal of the decay constant,λ, for Fluorine-18.
B. Reconstruction Setup
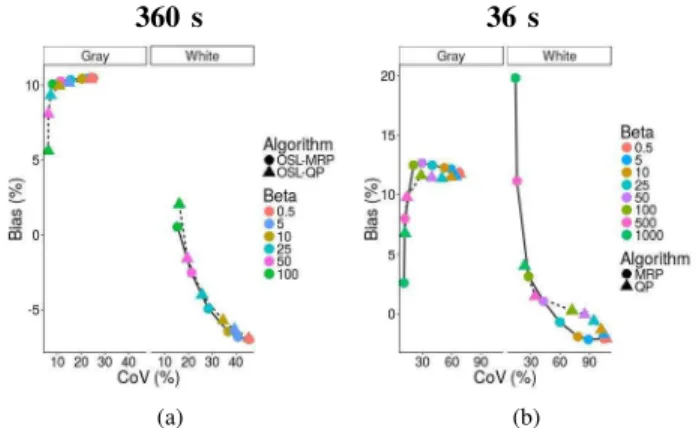
The data were reconstructed with different ordered subsets iterative algorithms. For OSEM, 3, 9, 21 subsets were used, to study whether the choice of the number of subsets affects the reconstructed image. With the other algorithms we choose 21 subset and 5 complete iterations (105 sub-iteration), as the convergence is faster. Post-filtering using an isotropic Gaussian filter (FWHM = 5 mm) allows noise reduction for OSEM. In the hospital 63 sub-iteration are used, however, 105 is chosen here because all the algorithms reached a plateau at this sub-iteration. The penalized algorithms include a regularising parameter, β, which must be chosen. We compared several β values, 0.5, 5, 10, 25, 50, 100 for both QP and MRP. Additionalβ values,β= 500 and 1000 where also considered, at 36 s because the best trade-off between bias and CoV is reached at high β values. Firstly, we calculate the euclidean distance of the points, in the plots from Figure 3, from the origin. Secondly, we calculated the sum of the distances (SOD) of each ROI. The distance,D, of the points can also be seen as a percentage root mean square error (RMSE):
D=pbias2+
CoV2
(3)
C. Image Analysis
The image reconstructed with 126 iteration of MLEM using the 3600 s acquisition time data was used as a reference for the bias formula. The choice of MLEM as “true” image is due to the fact that with real data we do not know the true activity in each region. As a consequence MLEM represent the most accurate reference we can have. To analyse our images we chose circular Regions of Interest (ROIs) that were positioned in the OSEM image at 3600 s acquisition time, using a utility implemented within STIR. We used six circles with 6 mm radius, each spread across three different slices. We located three in the “gray matter” and three in the “white matter” as shown in Figure 1. The analysis was done considering the three regions for each type as one ROI giving one ROI for “white matter” and another one for “gray matter”. For every ROI the bias and CoV were calculated and used to study how the various reconstruction methods differ from MLEM, and to assess the variability in the ROIs. Scatter correction was performed by STIR as describe by Tsoumpas et al [24] and discussed in more detail by Polycarpou et al [17].
(a) (b) (c)
Fig. 1. Regions of interest chosen for this study in different slices. The red ROI is for “gray matter” and the blue one for “white matter”.
For every ROI the bias and CoV were calculated and used to study how the various reconstruction methods differ from our gold standard, and to assess the variability in the ROIs. The following formulas represent bias (Bk) and CoV (Ck) for
every region:
Bk=
Mk−MT
MT ×
100, (4)
Ck = r
1 N−1
PN
j=1(Rkj−Mk)2
Mk ×
100, (5)
whereMT is the mean value of the gold standard,k can be
“white” or “gray matter”, Mk is the mean value over ROIs,
j the voxel index, Rkj denotes the value of the single voxel
j inside the regionkandN represents the number of voxels inside the three ROIs.
IV. RESULTS
Convergence of the algorithms was studied by plotting the bias as a function of the number of sub-iterations. Figure 2 shows, for OSEM, the percentage bias and CoV for different subsets and number of sub-iterations with the CoV represented by the bars. Such a study is needed to choose the number of
subsets for the reconstruction as well as when to stop with the iterative algorithm. This evaluation is repeated for both ROIs so as to decide the number of sub-iterations where all have reached a stable region as it seem that “gray matter” reaches a plateaux before “white matter”. The penalty factor for the OSMAPOSL methods was optimized in order to find a reasonable trade-off between bias and CoV. In Figure 3 we show the results of this optimization study and the chosenβ values are listed in Table I.
360 s 36 s
(a) (b)
Fig. 2. Convergence of bias values for “white” and “gray matter” of image reconstructed using different subsets with OSEM: 2(a) 360s acquisition; 2(b) 36s acquisition.
The optimum β turned out to be 100 for MRP and QP and 360 s acquisition, see Figure 4(a). In contrast, with 36 s acquisition higher values worked better, β = 500 for OSL-MRP andβ = 1000 for OSL-QP, see Figure 4(b). Again, we show the optimization for both ROIs as the optimized image should be good for all the regions we want to study.
360 s 36 s
(a) (b)
Fig. 3. Bias and CoV for severalβvalues in the two penalized algorithms: 3(a) OSL-MRP and OSL-QP, 360 s; 3(b) OSL-MRP and OSL-QP, 36 s.
(a) (b) (c)
(d) (e) (f)
(g) (h) (i)
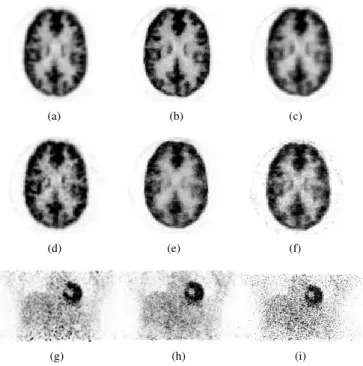
Fig. 5. Transverse phantom view for images reconstructed with 21 subsets at the 105th sub-iteration: 360 s acquisition (5(a) OSEM 5mm Gaussian filter; 5(b) MRP, β=100; 5(c) QP, β=100); 36 s acquisition (5(d) OSEM 5mm Gaussian filter; 5(e) MRP,β=500; 5(f) QP,β=1000). Coronal patient view for images reconstructed with 31 s acquisition: transverse:5(g) OSEM, 21 subsets, Gaussian filter 5 mm; 5(h) MRP,β=100; 5(i) QP,β=100;
total events). Nevertheless, they are not comparable with the phantom as they have different noise level, but they give an idea of the image quality. Figure 4 represents a comparison between the optimized algorithms, where one can see bias and SD (bars) for each method and ROI. In this case, we put SD over the samples created to give an idea of the uncertainty in the measured ROIs values.
360 s 36 s
(a) (b)
Fig. 4. “white” and “gray matter” bias and CoV for the 360 s (4(a)) and 36 s (4(b)) acquisition time datasets. Different iterative algorithms (OSEM, OSL-QP, OSL-MRP) all using 21 subsets are compared at the 105 sub-iteration.
TABLE I
OPTIMIZEDβVALUES FORMAPALGORITHMS AT DIFFERENT ACQUISITION TIMES.
βvalues
360 s 36 s
QP 100 1000 MRP 100 500
The same steps were followed for OSSPS-QP, while at 360 s the performances are similar to the other techniques in terms of bias and CoV at shorter time acquisitions the images appear extremely noisy, see Figure 6(a). In addition, this method turned out to need a long optimization procedure as there are 3 empirical parameters.
(a) (b) (c)
Fig. 6. Preliminary reconstructed image obtained using OSSPS-QP sub-iterations 105. Phantom: 6(a):360 s,α = 16, γ = 1000, β = 10; 6(b):36 s,α= 12,γ= 1000,β= 10; Patient: 6(c):31 s,α= 16,γ= 1000,β= 10.
V. DISCUSSION
performance as low activity regions have less Bias. This is due to the fact that they maximise the posterior density, introducing prior information. In this way, the algorithm compensates for the noise in the data. The method we used to optimize the images using two ROIs is a straightforward approach to regularise multiple regions of the body that one wants to focus on for a specific application. Moreover, in order to validate this method we saw the results of voxel-based analysis using all the different samples created from the LM data which gave as the same result in terms of Bias, that is to say that QP worked better then the others methods. Anatomical information from MR will be an important point to consider in the development of hybrid reconstruction methods which should help to preserve anatomical borders and avoid partial volume effects [26, 15].
VI. CONCLUSIONS
The objective of the study was to compare the performance of various iterative algorithms when short acquisition times are used, in terms of the image quality measures, bias and CoV. The study has assessed how low-counts conditions affect image reconstruction using real data. Different iterative algorithms and three different penalization factors were com-pared using Bias, standard deviation and mean squared error, showing that improved reconstruction can be achieved by a careful choice of the prior parameter. The penalized algorithm with a QP works better in terms of convergence rate and does not show a speckled pattern when acquisition time was reduced.
REFERENCES
[1] Ahn, S. and J. Fessler (2003). Globally convergent im-age reconstruction for emission tomography using relaxed ordered subsets algorithms. IEEE Trans. Med. Imag. 22, 613–626.
[2] Ahn, S., S. Ross, E. Asma, J. Miao, X. Jin, L. Cheng, S. Wollenweber, and R. Manjeshwar (2015). Quantitative comparison of OSEM and penalized likelihood image re-construction using relative difference penalties for clinical PET. Phys. Med. Biol. 60, 5733–5751.
[3] Bezrukov, I., F. Mantlik, H. Schmidt, B. Sch¨olkopf, and B. J. Pichler (2013). MR-based PET attenuation correction for PET/MR imaging. In Seminars in Nuclear Medicine, Volume 43, pp. 45–59. Elsevier.
[4] Britvitch, I., I. Johnson, D. Renker, A. Stoykov, and E. Lorenz (2007). Characterisation of geiger-mode avalanche photodiodes for medical imaging applications.
Nuc. Inst. Meth. Phys. Research Section A: Acceler-ators, Spectrometers, Detectors and Associated Equip-ment 571(12), 308 – 311.
[5] Delso, G., S. Frst, B. Jakoby, R. Ladebeck, C. Ganter, S. Nekolla, M. Schwaiger, and S. Ziegler (2011). Per-formance measurements of the siemens mMR integrated whole-body PET/MR scanner. J. Nucl. Med. 52, 1914– 1922.
[6] Fessler, J. and H. Erdogan (1998). A paraboloidal surro-gates algorithm for convergent penalized-likelihood
emis-sion image reconstruction. IEEE NSS-MIC, 1998 IEEE 2, 11321135.
[7] Green, P. (1990). Bayesian reconstructions from emission tomography data using a modified EM algorithm. IEEE Trans. Med. Imag. 9, 84–93.
[8] Hammer, B. E., N. L. Christensen, and B. G. Heil (1994). Use of a magnetic field to increase the spatial resolution of positron emission tomography. Med. Phys. 21(12), 1917– 1920.
[9] Hoffman, E., P. Cutler, W. Digby, and J. Mazziotta (1990). 3-D phantom to simulate cerebral blood flow and metabolic images for PET. IEEE Trans. Nucl. Sci. 37, 616–620. [10] Hofmann, M., I. Bezrukov, F. Mantlik, P. Aschoff,
F. Steinke, T. Beyer, B. J. Pichler, and B. Sch¨olkopf (2011). MRI-based attenuation correction for whole-body PET/MRI: quantitative evaluation of segmentation-and atlas-based methods. J. Nucl. Med. 52(9), 1392–1399. [11] Hudson, H. and R. Larkin (1994). Accelerated image reconstruction using ordered subsets of projection data.
IEEE Trans. Med. Imag. 13, 601–609.
[12] Karaoglanis, K., I. Polycarpou, N. Efthimiou, and C. Tsoumpas (2015). Appropriately regularized OSEM can improve the reconstructed PET images of data with low count statistics. Hellenic J. Nucl. Med. 18, 140–145. [13] Lange, K. and R. Carson (1984). EM reconstruction
algorithms for emission and transmission tomography. J Comput Assist Tomogr 8, 306–316.
[14] Mehranian, A. and H. Zaidi (2015). Emission-based esti-mation of lung attenuation coefficients for attenuation cor-rection in time-of-flight PET/MR. Phys. Med. Biol. 60(12), 4813.
[15] Novosad, P. and A. Reader (2016). MR-guided dynamic PET reconstruction with the kernel method and spectral temporal basis functions. Phys. Med. Biol. 61, 4624–4645. [16] Ouyang, J., Q. Li, and G. E. Fakhri (2013). Magnetic resonance-based motion correction for positron emission tomography imaging. Seminars in Nuclear Medicine 43(1), 60 – 67. PET/MRI.
[17] Polycarpou, I., K. Thielemans, R. Manjeshwar, P. Aguiar, P. K. Marsden, and C. Tsoumpas (2011). Comparative evaluation of scatter correction in 3d pet using different scatter-level approximations. Annals of Nucl. Med. 25(9), 643–649.
[18] Polycarpou, I., C. Tsoumpas, and P. Marsden (2012). Analysis and comparison of two methods for motion cor-rection in PET imaging. Med. Phys. 39(10), 6474–6483. [19] Renker, D. (2007). New trends on photodetectors.
Nu-clear Instruments and Methods in Physics Research Section A: Accelerators, Spectrometers, Detectors and Associated Equipment 571(12), 1 – 6.
[20] Roncali, E. and S. R. Cherry (2011). Application of silicon photomultipliers to positron emission tomography.
Annals of Biomedical Engineering 39(4), 1358–1377. [21] Shao, Y., S. R. Cherry, K. Farahani, K. Meadors,
S. Siegel, R. W. Silverman, and P. K. Marsden (1997). Si-multaneous PET and MR imaging.Phys. Med. Biol. 42(10), 1965.
reconstruction for emission tomography. IEEE Trans. Med. Imag. 1, 113–122.
[23] Thielemans, K., C. Tsoumpas, S. Mustafovic, T. Beisel, P. Aguiar, N. Dikaios, and M. Jacobson (2012). STIR: software for tomographic image reconstruction release 2.
Phys. Med. Biol. 57, 867–883.
[24] Tsoumpas, C., P. Aguiar, K. Nikita, D. Ros, and K. Thielemans (2004). Evaluation of the single scatter simulation algorithm implemented in the stir library. In
IEEE NSS-MIC , 2004 IEEE, Volume 6, pp. 3361–3365. IEEE.
[25] Vandenberghe, S. and P. K. Marsden (2015). PET-MRI: a review of challenges and solutions in the development of integrated multimodality imaging. Phys. Med. Biol. 60(4), R115.
[26] Vunckx, K., A. Atre, K. Baete, A. Reilhac, C. M. Deroose, K. V. Laere, and J. Nuyts (2012). Evaluation of three MRI-based anatomical priors for quantitative PET brain imaging. IEEE Trans. Med. Imag. 31, 599–612. [27] Walker, M., M. Asselin, P. Julyan, M. Feldmann, P.