ζ
o
Q
iii
σι en
Research
and
annua
M 7 - 5
§
statistics
D a t a
1 9 8 8 - 1 9 9 8
Our mission is to provide the
European Union
with a high-quality statistical information service
Eurostat's Collections are adapted to the needs of all users. You will find them in each of the nine themes proposed by Eurostat.
3
£01
M
1 General statistics
2 Economy and finance
3 Population and social conditions
4 Industry, trade and services
5 Agriculture and fisheries
Æj
jøtB?
6 External trade 7 Transport
8 Environment and energy
9 Research and development
Graphs :::= Tables Comments C o n t e n t
Press releases: Eurostat publishes around 100 press releases every year in connection with the release of new data. The press releases include the key figures on the EU, the Member States and their partners. They are provided free of charge. They are also available on the Internet as soon as they are published: http://europa.eu.int/eurostat.html
F o r m a t
Paper Html PDF
Statistics in focus: This collection is published regularly by Eurostat and provides up-to-date summaries of the main results of statistical surveys, studies and analyses. It covers all themes and consists of about four to eight pages per issue. Eurostat issues around 150 Statistics in Focus per year. Available as single copies or on subscription.
Paper PDF
Key indicators: This collection provides the main indicators on a theme or sub-theme in an easy-to-carry booklet of up to 100 pages. Available as single copies or on subscription.
Paper Html
Panorama of the European Union: This collection highlights the features and trends of a multi-sectoral theme or a sectoral sub-theme. The publications consist of around 200 pages and include analysis as well as tables and graphs. Available as single copies or on subscription.
Paper CD-ROM
Methods and nomenclatures are intended for specialists who want to consult the methodologies and nomenclatures used for a theme, a sub-theme or a sector. Available as single copies.
Paper CD-ROM
Detailed tables are intended for specialists. They present part, or all, of the statistical data compiled on a theme, sub-theme or sector. Available as single copies or on subscription.
Paper CD-ROM
Studies and research summarise the results of European statistical studies and research and are intended for specialists. Available as single copies or on subscription.
Paper CD-ROM
Catalogues provide rapid access to concise information on Eurostat's products and services. They are free of charge and include the Mini guide, a selection of Eurostat products and services, and Statistical references, the quarterly newsletter on Eurostat's latest products and sen/ices.
ζ
o
Q
LU
en σ» σι
Research
and development:
annual statistics
D a t a 1 9 8 8 - 1 9 9 8
immediate access to harmonized statistical data
E u r o s t a t D a t a S h o p s :
A personalised data retrieval service
In order to provide the greatest possible number of people with access to highquality statistical information, Eurostat has developed an extensive network of Data Shops (').
Data Shops provide a wide range of tailormade services:
* immediate information searches undertaken by a team of experts in European statistics;
* rapid and personalised response that takes account of the specified search requirements and intended use;
* a choice of data carrier depending on the type of information required.
Information can be requested by phone, mail, fax or email.
(') See list of Eurostat Data Shops at the end of the publication.
I n t e r n e t :
Essentials on Community statistical news
■*■ Euro indicators: more than 100 indicators on the eurozone; harmonized, comparable, and free of charge;
* About Eurostat: what it does and how it works;
* Products and databases: a detailed description of what Eurostat has to offer;
* Indicators on the European Union: Convergence criteria; euro yield curve and further main indicators on the European Union at your disposal;
* Press releases: direct access to all Eurostat press releases.
For further information, visit us on the Internet at: h t t p : / / e u r o p a . e U . ¡ n t / e u r O S t a t . h t m l
A great deal of additional information on the European Union is available on the Internet. It can be accessed through the Europa server (http://europa.eu.int).
Cataloguing data can be found at the end of this publication.
Luxembourg: Office for Official Publications of the European Communities, 1999
ISBN 9282878228
© European Communities, 1999
Printed in Luxembourg
mi
STATISTICAL OFFICE OF THE EUROPEAN COMMUNITIESL-2920 Luxembourg — Tel. (352) 43 01-1 — Telex COMEUR LU 3423 e u r O S t a t Rue de la Loi 200, B-1049 Bruxelles — Tel. (32-2) 299 11 11
Eurostat is the Statistical Office of the European Communities. Its task is to provide the European Union with statistics at a European level, that allow comparisons to be made between countries and regions. Eurostat consolidates and harmonizes the data collected by the Member States.
To ensure that the vast quantity of accessible data is made widely available, and to help each user make proper use of the information, Eurostat has set up a publications and services programme.
This programme makes a clear distinction between general and specialist users and particular collections have been developed for these different groups. The collections Press releases, Statistics in focus, Panorama of the European Union, Key indicators and Catalogues are aimed at general users. They give immediate key information through analyses, tables, graphs and maps.
The collections Methods and nomenclatures, Detailed tables and Studies and research suit the needs of the specialist who is prepared to spend more time analysing and using very detailed information and tables.
All Eurostat products are disseminated through the Data Shop network or the sales agents of the Office for Official Publications of the European Communities. Data Shops are available in 12 of the 15 Member States as well as in Switzerland, Norway and the United States. They provide a wide range of services from simple database extracts to tailor-made investigations. The information is provided on paper and/or in electronic form via e-mail, on diskette or CD-ROM.
As part of the new programme Eurostat has developed its website. It includes a broad range of on-line information on Eurostat products and services, newsletters, catalogues, on-line publications as well as indicators on the euro-zone.
RESEARCH AND DEVELOPMENT:
ANNUAL STATISTICS 1999
FOREWORD
The publication Research and Development: Annual Statistics 1999 contains up-to-date statistics on R&D and on patent applications in the European Union and the EEA. These statistics show the trends and structure of research and development in the EEA.
Continuing our efforts to improve the quality of the annual publication, for the 1999 edition, we have decided to reorganise the contents of the publication by topic (e.g. all the information regarding GBAORD are now located in the GBAORD chapter). This follows on from internal discussion at Eurostat and various comments from our readers. In this way, it is hoped that this more concise publication will be easier for the user to find their way around.
Other major changes have concentrated on improving the dissemination of the R&D and patent statistics to reach as wide an audience as possible. Hence we have decided to disseminate these statistics via this paper version, a CD-ROM and supplemented by "Statistics in Focus" on specific topics. The paper version of the publication will include data at NUTS level 1, methodological notes and brief analysis; whereas the CD-ROM will provide detailed data (data to NUTS level 3 and complete time series) with methodological notes. The Statistics in Focus, on the other hand, will concentrate on providing readers with a more detailed analysis of the R&D situation within the EEA.
We hope that this new edition serves our users well, both within the policy making and scientific communities and the public at large, and that these changes will be welcomed. If you have any comments to make on this publication, further suggestions for improvement or so on, please do not hesitate to contact Unit A4 "Research and development, methods and data analysis" of Eurostat.
All the information in this publication is based on data supplied to Eurostat by the Member States, by DG XII-02 (Science, Research and Development - Competitivity, Economic Analysis and Indicators Unit) of the European Commission, by the European Patent Office (EPO) and by the OECD. We should like to express our thanks to our colleagues in the Member States (and in Iceland and Norway), the Commission Services, EPO and the OECD for their excellent co-operation and their willingness to help meet the ever-growing demand for information on R&D.
CONTENTS Page No.
EXECUTIVE SUMMARY 6
DEFINITIONS AND EXPLANATORY NOTES 7
LIST OF ABBREVIATIONS 9
PART A: RESEARCH AND DEVELOPMENT IN EUROPE
Chapter 1 : GOVERNMENT BUDGET APPROPRIATIONS ON R&D - GBAORD 11
1.1. GBAORD allocation in the EEA 11
1.2. GBAORD allocation by socio-economic objectives 13
1.3. GBAORD allocation of the triad 14
1.4. Specific developments in the Member States 15
Chapter 2: R&D EXPENDITURE AND R&D PERSONNEL 24
2.1. R&D expenditure and R&D personnel at national level 24
2.1 .A R&D expenditure of the EEA 24 2.1 .B R&D personnel of the EEA 27 2.2. R&D expenditure and R&D personnel at regional level 30
2.2.A R&D expenditure at regional level 32 2.2.B R&D personnel at regional level 34
2.3. Global comparisons 35 2.4. Specific developments in the Member States 36
2.5. Standard definitions and explanatory notes 39
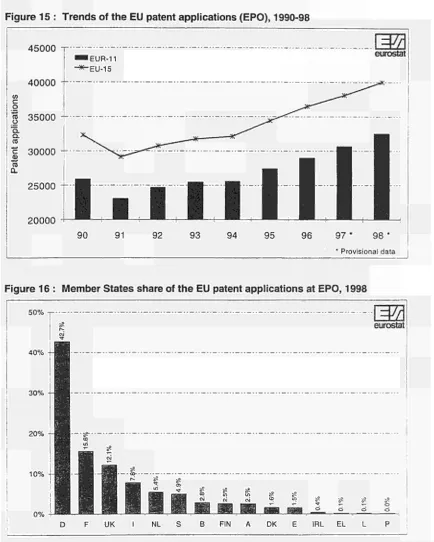
Chapter 3: EUROPEAN PATENT APPLICATIONS 42 3.1. Patent activities in the EU 42
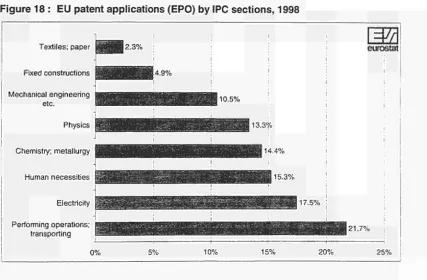
3.2. Patent applications by IPC sections 45 3.3. Regional distribution of the EU patent applications 46
PART Β: TABLES AND NOTES RELATING TO THE TABLES
NOTES RELATING TO THE TABLES
T.1. Tables on government R&D appropriations 52
T.2. Tables on R&D expenditure 53 T.3. Tables on R&D personnel 54 T.4. Tables on European patent applications 56
TABLES
GOVERNMENT R&D APPROPRIATIONS Tables
1 - 3 Total 57 4 - 5 By chapters of NABS 60
6 By special fields of technology 64
R&D EXPENDITURE Tables
7 - 1 0 All sectors 65 11-14 Business enterprise sector 77
15-18 Government sector 89 19 - 22 Higher education sector 101
R&D PERSONNEL Tables
2 3 - 2 5 All sectors 113 2 6 - 2 8 Business enterprise sector 122
2 9 - 3 1 Government sector 131 32 - 34 Higher education sector 140
EUROPEAN PATENT APPLICATIONS Tables
3 5 - 4 0 European patent applications 149
REFERENCE DATA Tables
EXECUTIVE SUMMARY
Research and Development (R&D) is regarded as an important contribution to our well-being; it is a driving factor behind economic growth and job creation, a source of increasing quality of products and a prime mover of improvements in health care and environmental protection. For the development of the European Union, its Member States and regions, R&D is therefore a key issue. This is why political decision-makers at all levels are calling for stronger measures in support of R&D.
Putting such measures into practice requires, among other things, data which are as comprehensive, comparable and as up to date as possible. This publication, by the Statistical Office of the European Communities (Eurostat), attempts to meet the European-wide demand for such data, providing regional data as far as possible for four key R&D statistical indicators - government R&D appropriations, R&D expenditure, R&D personnel and European patent applications.
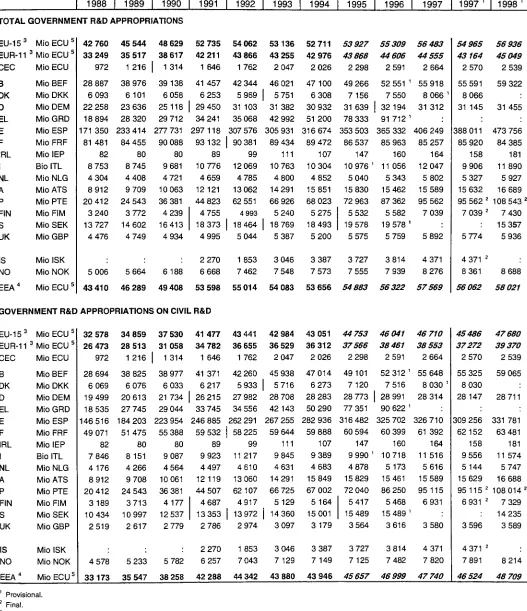
Government R&D appropriations are an important indicator of R&D trends. In 1997, budget appropriations in the Member States of the European Economic Area totalled more than ECU 57,600 million, with a further ECU 2,600 million earmarked by the European Commission. This amount is in real terms similar to the past three years, and provisional figures for 1998 suggest around the same.
As far as R&D expenditure is concerned, in 1997, approximately ECU 137,700 million was spent in the European Union, an estimated increase of 4.6% (and 2.3% in real terms) on 1996. This figure is equivalent to about 1.9% of the EU's gross domestic product, but well below the corresponding figures for the United States and Japan. More than 60% was accounted for by the business enterprise sector, and the rest by the government and higher education sectors in roughly equal proportions.
Apart from adequate funding, successful R&D activities require the deployment of qualified staff. In 1997, in the European Union there were over 2.1 million scientists (1 601900 FTE), technicians and other R&D-related personnel, most of them in the business enterprise sector. This figure continues a steady gradual increase seen this decade. Provisional figures suggest a further increase in 1998. R&D personnel make up approximately 1.27% of the entire EU labour force.
DEFINITIONS AND EXPLANATORY NOTES
The standards used
The basic methodological recommendations for R&D statistics are given in the "Proposed Standard Practice for Surveys of Research and Experimental Development - Frascati Manual" (OECD, 1994). This manual deals exclusively with the measurement of R&D "input". The regional aspects of R&D and innovation statistics are covered by "The Regional Dimension of R&D and Innovation Statistics -Regional Manual" (Eurostat, 1996). The following definitions are mainly derived from these manuals. In principle, the R&D data in this publication are being collected in line with these recommendations. The basic data are collected by the relevant authorities in the MS (National Statistical Offices, Research Councils, Ministries for R&D). These data are transmitted to Eurostat where the data are checked, transformed, and where the derived indicators are calculated.
Research and Development - R&D
Research and experimental development (R&D) comprise creative work undertaken on a systematic basis in order to increase the stock of knowledge, including knowledge of man, culture and society and the use of this stock of knowledge to devise new applications (Frascati Manual, § 57). This term covers three activities: basic research; applied research, and experimental development.
Measures for R&D input
According to the recommendations of the Frascati Manual and the Regional Manual, the following indicators for R&D input are compiled in this publication:
Government budget appropriations or outlays on R&D - GBAORD
GBAORD means all appropriations by central government allocated to R&D in central government budgets. Data on government R&D appropriations therefore refer to budget provisions, not to actual expenditure, i.e. GBAORD measures government support for R&D using data collected from budgets.
R&D expenditure
The basic measure for R&D expenditure is the "intramural expenditures", which are all expenditures for R&D performed within a statistical unit or sector of the economy, whatever the source of funds (Frascati Manual, § 335).
R&D personnel
R&D personnel data measure the amount of resources going directly into R&D activities. This includes all persons employed directly in R&D plus persons supplying direct services to R&D, such as managers, administrative staff and office staff (Frascati Manual § 279).
GBAORD
As a departure from the general rule, the provisional budget figures are converted from national currency into ECU on the basis of the exchange rates in March of the year in question.
Figures in ECU at current prices
The average rates of exchange for the year in question are used for converting absolute values from national currencies into ECU.
Figures in 1990 PPS at constant prices
Financial aggregates in different countries are not even fully comparable after deflation and conversion to ECU, since exchange rates are influenced not only by disparate price trends but also by other factors, and this may distort any comparisons based on those rates. Purchasing power parities, based on comparisons of the prices of representative and comparable goods or services in different countries in different currencies on a specific date, are used to eliminate such effects. As a result, financial aggregates are expressed in purchasing power standards (PPS) rather than ECU based on exchange rates. The calculations in this publication are based on 1990 purchasing power standards.
Central government
Central government is a sub-sector of the general government sector of the national accounts. According to the European System of Accounts (ESA, Eurostat 1995), the general government sector includes all institutional units which are principally engaged in the production of non-market services intended for individual and collective consumption and/or the redistribution of national income and wealth. The sub-sector central government is restricted to all administrative departments of the State and other central agencies whose competence extends over the whole economic territory (except the administration of social security funds). In Germany this sub-sector includes the central governments of the Länder.
Central government budget
The central government budget (CGB) comprises current and capital expenditure by central government. Eurostat extracts the CGB data from the harmonised results of the ESA. No data are available for Greece.
Region
The regional breakdown of the Member States of the EU is based on the NUTS (Nomenclature of Territorial Units for Statistics, Eurostat, 1995) classification. The NUTS 1995 classification was revised in 1998 (Nomenclature of Territorial Units for Statistics, Eurostat, 1998) but due to time constraint we have been unable to take this into account. However it is envisaged that in next years publication the latest version of NUTS classification will be taken into consideration. The NUTS are at three levels, not all of which are represented in every Member State: Denmark and Ireland, for example, have no NUTS 1 or NUTS 2 regions, which means that these two levels are identical to the countries themselves.
Gross domestic product (GDP) at market prices
This aggregate represents the result of the production activity of resident producer units. It corresponds to the economy's output of goods and services, less intermediate consumption, plus taxes linked to imports. The sum of the regional values of the GDP at market prices might differ from the national values for some countries.
Labour force
The labour force comprises all people aged 15 and over who are employed or unemployed but not inactive (pupils, students, people in compulsory military service, retired people).
Population
LIST OF ABBREVIATIONS
A Austria ATS Austrian shilling Β Belgium BEF Belgian franc
BERD Business enterprise expenditure on R&D
BES Business enterprise sector Bio Billion (= 1,000 Million)
CERN European centre for nuclear research CNRS National centre for scientific research CSF Community support framework D Germany
DEM German mark DG Directorate General DK Denmark DKK Danish kroner E Spain EC European Commission ECU European Currency Unit EEA European Economic Area EFTA European Free Trade Area EL Greece
EPC European Patent Convention (=Munich Convention) EPO European Patent Office
ESA European System of Integrated Accounts
ESP Spanish peseta EU/EU-15 European Union
EUR-11 Euro-zone (B, D, E, F, IRL, I, L, NL, A, P, FIN)
Eurostat Statistical Office of the European Communities
F France FIM Finnish mark FIN Finland FRF French franc FTE Full time equivalent
GBAORD Government budget appropriations or outlays for R&D
GBP Pound sterling
GDP Gross Domestic Product
GERD Gross Domestic Expenditure on R&D GOV Government sector
GRD Greek drachma
GUF General university funds HC Head count
HES Higher education sector I Italy
IEP Irish pound
ILO International Labour Office IPC International Patent Classification
IRL IS ISK ITL JPO L LF LI LUF MLF MP N NABS
NACE
NL NLG NOK NUTS
OECD
OST Ρ PCT PNP PPS PTE R&D S SEK SME UK USA USPTO
No.
-0
I
italics
Ireland Iceland
Icelandic krona Italian lira
Japanese Patent Office Luxembourg
Labour force Liechtenstein
Luxembourgish franc Million labour force Million population Norway
Nomenclature for the Analysis and Comparison of Scientific programmes and Budgets
Statistical Classification of Economic Activities in the EC
Netherlands Dutch guilder Norwegian crown
Nomenclature of Territorial Units for Statistics
Organisation for Economic Co operation and Development Office for Science and Technology Portugal
Patent Co-operation Treaty Public non-profit sector Purchasing Power Standard Portuguese escudo
Research and Development Sweden
Swedish krona
Small and medium sized enterprises United Kingdom
United States of America United States Patent and Trademark Office Number
Data not available Nil
Less than fifty percent of the indicated unit
Break in series
PART A:
CHAPTER 1: Government Budget Appropriations on R&D - GBAORD
Introductory remark
There are two ways of measuring government support for R&D. The most accurate way is to hold surveys in order to identify the amount actually spent on R&D over the previous year and the share which was financed by the government. However, data from this method do not become available until several years after the R&D has been carried out. Hence a second method of measuring government support for R&D has been devised, using data collected from the budgets. Budget based data are referred to as government budget appropriations or outlays for R&D (GBAORD).
GBAORD means all appropriations by central government allocated to R&D in central government budgets. Data on government R&D appropriations therefore refer to budget provisions, not to actual expenditure, i.e. GBAORD measures government support for R&D using data collected from budgets. The figures on actual expenditure, which are not available in their final form until some time after the end of the budget year concerned, may well differ from the original budget provisions.
Despite all efforts, the concepts and methods used by the individual Member States of the EEA, the United States of America and Japan for collecting data on government R&D appropriations are not completely harmonised. One methodological discrepancy lies in the treatment of transfers of funds for R&D purposes by the European Commission to the Member States in the context of the Community Support Framework (CSF).
1.1. GBAORD ALLOCATION IN THE EEA
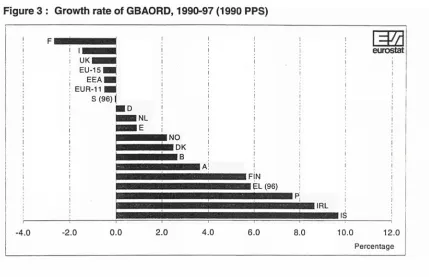
Funds allocated by the EEA governments towards R&D activities increased substantially in the late 80's. However, since then it has remained more or less constant. Between 1986-92, GBAORD in the EEA increased at an annual average growth rate of 6.3%, whereas the growth rate between 1992-97 was a mere 0.8%. In terms of current ECU, EEA governments allocated 57.6 BECU towards R&D activities in 1997, representing a 1.5 fold increase on the 1986 level.
Figure 1 : Trends in GBAORD of the EEA, 1986-97
m
eurostat
% of GDP 2.00
1.50
■ 1.00
0.50
1986
H f f l % of GDP
87 88 89 90 91 92
ECU at current prices and current exchange rate
93 94 95 96
-^-Purchasing Power Standard (PPS) at 97
1990 prices
. I
However, in constant (PPS) prices, GBAORD of the EEA governments increased steadily and reached a peak in 1991, but since then it has continuously declined. In constant (PPS) prices, funds allocated by EEA governments towards R&D increased by 2.9% annually between 1986-91, since then it has been decreasing at an annual rate of 1.1% between 1991-97. GBAORD as a proportion of GDP shows a similar trend for the 1986-97 period. The budgets allocated for the R&D activities as a proportion of GDP by the EEA governments have consistently declined; in 1986 1.0% of the EEA GDP was allocated for R&D activities but by 1997 the ratio had declined to 0.8% (figure 1).
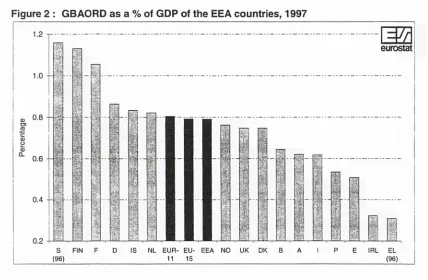
[image:16.590.65.493.252.532.2]Aggregate GBAORD data of the EEA hides the existence of the disparities between the EEA countries. There are in fact major differences in the allocation of funds towards R&D activities within the Member States. Expressing GBAORD as a proportion of GDP reveals that Sweden, Finland and France clearly stands out from the rest of the EEA countries. They allocated more than 1 % of their respective GDP towards R&D activities in 1997, which is far above the EEA average (0.8%). At the other extreme, the four southern EU Member States plus Ireland allocated between 0.6% and 0.3% of their respective GDP towards R&D activities in 1997 (figure 2).
Figure 2 : GBAORD as a % of GDP of the EEA countries, 1997
1.2
1.0
0.8
0.6
0.4
0.2
Γ
τ
m
eurostat
m w
ι
S FIN (96)
IS NL EUR- EU- EEA NO UK DK
11 15 IRL EL (96)
Long term trends show that the funds allocated towards R&D activities (GBAORD as a % GDP) by the governments of the large four EEA countries have declined substantially during the 1986-97 period, whereas the smaller EEA countries increased their allocation of funds towards R&D activities. In
1986 the United Kingdom government allocated 1.1% of it's GDP towards R&D activities, however by 1997 this figure has declined to 0.75%. The Finnish government on the other hand increased it's allocation of funds towards R&D activities from 0.7% in 1986 to 1.1 % by 1997.
Figure 3 : Growth rate of GBAORD, 1990-97 (1990 PPS)
m
eurostat
I FIN ■ EL (96)
URL
ns
4.0 2.0 0.0 2.0 4.0 6.0 8.0 10.0 12.0 Percentage
1.2. GBAORD ALLOCATION BY SOCIO-ECONOMIC OBJECTIVES
The aim of the classifying GBAORD by socioeconomic objectives is to aid policy makers in the formulation of science and technology policy. Government R&D appropriations are broken down by socioeconomic objectives on the basis of NABS (Nomenclature for the Analysis and Comparison of Scientific Programmes and Budgets, Eurostat 1994).1 Analysis of the disaggregated data reveals the
priorities placed by individual governments in different categories.
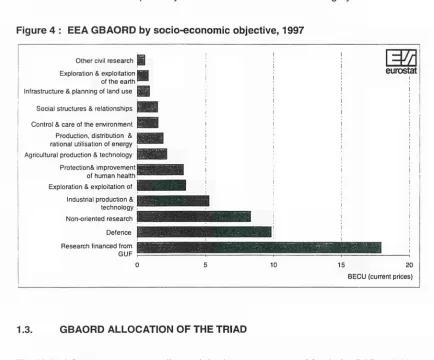
Figure 4 shows the breakdown of R&D appropriations of the EEA governments taken together. The largest share of R&D funds allocated by the EEA governments were for the Government University Fund (GUF) category, followed by Defence and NonOriented Research. In 1997, 17.9 BECU was allocated for the GUF category, representing 31% of the total EEA GBAORD, whereas the Defence and NonOriented Research categories accounted for 17% and 14.5% of the total EEA GBAORD.
Since the early 90s the EEA governments have placed greater emphasis on the GUF category at the expense of the defence category. R&D funds allocated to defence related research declined from 23% in 1990 to 17% in 1997; in contrast, R&D funds allocated to GUF increased from 24% in 1990 to 3 1 % in 1997. Other significant changes in the allocation of funds are observed for the Industrial Production and Technology category, which accounted for 9% of the total EEA GBAORD in 1997, a decline of 4% points from 1990.
There are wide variations in the emphasis placed by the governments of the individual EEA countries on the NABS categories. The majority of the EEA countries allocated the largest share of GBAORD to the GUF category in 1997. France and the United Kingdom on the other hand allocated the largest share to the Defence category (28% and 39% respectively). Ireland and Finland placed more emphasis on Industrial Production and Technology; in 1997 the Irish and the Finnish governments allocated 34% and 27% respectively of their total GBAORD to this category.
Figure 4 : EEA GBAORD by socio-economic objective, 1997
Other civil research Exploration & exploitation of the earth Infrastructure & planning of land use
Social structures & relationships
Control & care of the environment Production, distribution & rational utilisation of energy Agricultural production & technology Protections improvement
of human health Exploration & exploitation of
Industrial production & technology Non-oriented research
Defence
Research financed from GUF
HZ
1
eurostat
io 15 20
BECU (current prices)
1.3. GBAORD ALLOCATION OF THE TRIAD
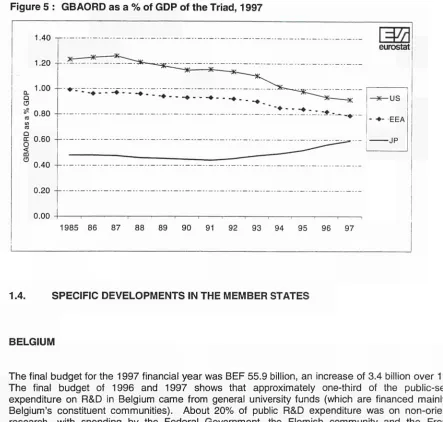
The United States government allocated the largest amounts of funds for R&D activities throughout the 80s and 90s, followed by the EEA and Japan. In 1997 the United States government allocated 63.2 BECU towards R&D activities as compared to the 57.6 BECU of the EEA. Japanese GBAORD is very low in comparison to the EEA and US, even after taking into consideration the size of the Japanese economy. The Japanese government allocated 22.0 BECU towards R&D activities in 1997. However at constant prices, the Japanese GBAORD increased at an annual average growth rate of 4.8% between 1985-97, whereas the EEA GBAORD increased by 0.7% (annually) and there is virtually no change for the US.
Figure 5 : GBAORD as a % of GDP of the Triad, 1997
1.40 —
1.20 1.00 - - * · ; 0.80
en 0.60 §
m O
0.40
m
eurostat
■♦ ♦ . .
.·* ^
- * - u s
■♦ EEA
JP
0.20
0.00
1985 86 87 88 89 90 91 92 93 94 95 96 97
1.4. SPECIFIC DEVELOPMENTS IN THE MEMBER STATES
BELGIUM
The final budget for the 1997 financial year was BEF 55.9 billion, an increase of 3.4 billion over 1996. The final budget of 1996 and 1997 shows that approximately onethird of the publicsector expenditure on R&D in Belgium came from general university funds (which are financed mainly by Belgium's constituent communities). About 20% of public R&D expenditure was on nonoriented research, with spending by the Federal Government, the Flemish community and the French speaking community at approximately the same level.
Industrial production and technology objectives are the third largest category accounting for 15% of the total GBAORD (this expenditure is shared by the Federal Government and the three regions). Space exploration and exploitation accounted for 12% of public spending in 1997, the cost being borne solely by the Federal Government. In general, it can be seen that there were only minor variations by NABS objectives or groups of objectives between 1996 and 1997 (or indeed 1998).
Table 1 : GBAORD in Belgium, by groups of objectives (in %)
-Jf
eurostarGroups
2348 1579 6
10 11 12 13 Total
! of NABS objectives
Human and social objectives Technological objectives Agriculture
Research funded by GUF Nonoriented research Other civil research Defence
Final budgets
1996 1997
7.2 7.1
31.3 33.3
3.3 3.1
35.2 30.8
17.6 20.9
4.9 4.4
0.5 0.5
100.0 100.0
Provisional budgets
1997 1998
6.9 7.8
33.0 34.2
3.0 2.9
31.1 29.6
21.2 21.0
4.3 4.0
0.5 0.4
[image:19.590.64.507.56.478.2]Institutional context
Belgium's federal structures (which arose from the reforms of 1980, 1988 and 1993) give primary responsibility for basic and university research to the communities, while the regions are primarily responsible for supporting industrial and technological research. The Federal Government has particular responsibility for federal scientific and cultural establishments, space research, nuclear research, a broad area of agricultural research, and Belgian participation In the activities of international research bodies.
The Interministerial Conference for Science Policy (Conférence interministérielle de la politique scientifique - CIMPS) and its administrative bodies are the instruments of dialogue between the Government, the regions and the communities.
Priorities
At federal level: Scientific support for the preparation of federal policies (especially in the area of sustainable development and promotion of the information society); ongoing support for networks of excellence ("inter-university poles of attraction") and support for the implementation of space programmes.
At regional and community level:
Flemish Community/Region: increased support for public funding of R&D in order to reach total R&D spending of 2% of GDP in 1999; modernisation and improvement of the system of R&D financing; promotion of high-technology sectors and encouragement of the dissemination of technology; promotion of the social aspects of technology.
French-speaking Community: increase in the appropriations for basic research; promotion of investment in research in the context of the drive to create employment.
Walloon Region: maintenance of or increase in the global R&D effort and in assistance to leading-edge technological sectors, in particular technological sectors with high employment potential.
Region of Brussels-Capital: promotion of SME access to R&D and of networking of regional R&D potential and greatest possible integration of R&D results into the economic processes of the region.
SPAIN
According to data obtained from the Final 1997 Budget, public funding for R&D totalled PTA 406 249 million. This represents an increase of 11.2% on the 1996 figure, in pesetas at current value. The proportion of budget allocated for the human and social objective category decreased in 1996 and 1997, but stabilised thereafter. In contrast, the proportion of GBAORD allocated to the GUF, non-oriented research and other civil research categories declined continuously during the 1996-98 period, but the reasons differ according to the group. Technological objectives declined due to much greater differential growth in the other groups, and specifically defence, for the reasons explained below.
Table 2 : GBAORD in Spain, by groups of objectives (in %)
14M
eurostat
Groups of NABS objectives 2-3-4-8
1-5-7-9 6 10 11 12 ' 13 Total
Human and social objectives Technological objectives Agriculture
Research funded by GUF Non-oriented research Other civil research Defence
Final budgets
1996 1997 9.7 8.2 33.0 30.4
4.1 4.0 31.3 28.7
9.4 7.8 1.7 1.3 10.8 19.6 100.0 100.0
Provisional budgets
1997 1998 8.2 8.2 30.2 25.9
3.8 3.9 30.1 25.5
The decrease of the GUF category share can be explained by the fact that the phase of expansion with the creation of new state-owned universities and generous funding was naturally followed by a downward trend. The decline in the share of the non-oriented research group masks the effect of gradually improving differentiation between the funding for R&D "items" in the questionnaire. Whereas some bodies previously tended to use this category as a catch-all for R&D funding, repeated insistence on the maximum possible detail in the breakdown between the various objectives has borne fruit, leading to a decline in the relative share of the non-oriented research group. The other civil research group share declined for the similar reason: insistence that only in the extreme are figures to be assigned to this chapter has brought better distribution between specific objectives, whereupon the percentage assigned to other civil research has declined within total R&D allocations.
As for the defence category, the figures for 1997 and 1998 are marked by the incorporation into the defence budget of large sums from the Ministry of Industry and Energy with a substantial industrial R&D content corresponding to the "Promotion and Industrial Strategies for Defence" programmes. This explains the reason behind the increase of almost 300% in the figure assigned to the defence objective over the three-year period. The share of the agriculture category has remained virtually stable, albeit showing a slight decrease over the 1996-98 period.
FRANCE
Institutional context
Responsibility for co-ordinating national research and development policy lies with the Ministry of Education, Research and Technology under the CRDB (civilian research and development budget). R&D budget appropriations are not confined to the CRDB alone but also Include university funds and the research budget of the Ministry of Defence. In 1997, the CRDB accounted for 58% of total appropriations, defence 28% and university funds 14%.
Developments
All final budget appropriations totalled FRF 85 256 million in 1997 compared with FRF 85 963 million in 1996, representing a fall of 0.8% in terms of value which is slightly more than the rate observed in 1996. The main factor for the reduction is due to the reduction of funds allocated to the Defence Ministry research, which decreased by 6.6% in 1997 (FRF 1.7 billion). This decrease is in line with the reduction observed since 1990, representing a total of FRF 10.7 billion since this date.
Table 3 : GBAORD in France, by groups of objectives (in %)
=7
eurostat
Groups of NABS objectives 2-3-4-8
1-5-7-9 6 10 11 12 13 Total
Human and social objectives Technological objectives Agriculture
Research funded by GUF Non-oriented research Other civil research Defence
Final budgets
1996 1997 8.5 8.9 21.1 21.2
3.6 3.7 16.0 16.5 18.7 19.3 2.4 2.4 29.7 28.0 100.0 100.0
Provisional budgets
1997 1998 8.9 9.5 21.7 22.6
3.6 3.8 16.5 17.1 19.2 20.4 2.4 1.8 27.7 24.8 100.0 100.0
The prime objective of R&D public budget appropriations is the general advancement of knowledge. They comprise university general funds and non-targeted research, which accounted for 36% in 1997, a similar level to 1996. Technological objectives occupy second place in terms of civilian budget appropriations; their proportion has hardly changed in recent years. Within them there was little change in 1997, despite a slight increase in space research. The share of human and social objectives has increased considerably. Health, the main item (NABS 4), showed an increase in 1997.
IRELAND
Since the introduction of the EU Community Support Framework (CSF) in 1989 the Irish government has used the opportunity to invest heavily in science and technology initiatives. It is estimated that in 1997 one third of government funds for R&D come from the CSF. The second round of CSF Operational Programmes came into effect in 1994. The levels of funding under its various measures have been phased in, therefore there are no wide variations in the CSF allocations between 1996 and 1997 to the NABS chapters. The most significant changes are in agriculture and research financed from GUF as outlined in the table below.
The total budgetary allocation to R&D in 1997 amounted to IEP 163.6m, an increase of IEP 3.8 million (2.4%) over the 1996 level. The reason for this increase is due to the significant increased Investment in the agricultural sector (IEP 9.7 million), technological objectives (IEP 2.9 million) and in non-oriented research (IEP 2.8 million). This is partly offset by the decrease in research financed from GUF (IEP 10.4 million). Although research investment in the third level sector is constantly increasing in real terms, the budgeted exchequer support decreased significantly in 1997. The actual expenditure has increased by 14.8% between 1996 and 1997.
Table 4 : GBAORD in Ireland, by groups of objectives (in %)
=
Jr
eurostatGroups of NABS objectives 2-3-4-8
1-5-7-9 6 10 11 12 13 Total
Human and social objectives Technological objectives Agriculture
Research funded by GUF Non-oriented research Other civil research Defence
Final budgets
1996 14.5 37.0 14.8 28.4 5.3
-100.0
1997 13.4 37.9 20.5 21.4 6.9
-100.0
Provisional budgets
1997 1998 13.9 14.0 39.4 37.2 21.2 10.5 18.3 22.3 7.2 16.0
-100.0 -100.0
Funding for R&D in the natural resource areas has traditionally been declining since the mid-1980s. The CSF has provided the opportunity to reverse this trend. A number of research programmes have been initiated into specified areas in agriculture, food, forestry and marine. Researchers in the higher education sector are the main recipients of these research contracts. A Marine Institute has also been established with the assistance of CSF funds. For the first time all research and technological development in the marine area is co-ordinated by the one institution. Research expenditure in agriculture (chapter 6) has increased from IEP 23.7 million in 1996 to IEP 33.5 million in 1997.
Funding for non-oriented research (chapter 11) has increased from IEP 8.5 million in 1996 to IEP 11.3 million in 1997. There was increased funding in the marine and wildlife sectors, and a new drugs programme was introduced where researchers in 3rd level institutions are funded to research projects in areas such as drug detection and analysis, pharmacology and social impacts.
Allocation of funds by the government Increased for all other chapters, except chapter 3, which showed a marginal decrease in allocation in 1997 compared to 1996.
Methodology
The data has been calculated according to the methodology introduced in 1992. This method results in government funds only being included in the analysis. The definition of government funds includes money received from the EU Community Support Framework in support of R&D activities. The data for 1997 has been classified according to the NABS 1993 classification system.
ITALY
In 1997, final budget amounts to ITL 12,047,336 million. The increase on 1996 final budget is 9.0% in nominal terms and 6.2% in real terms (at 1995 prices). The most significant increases are registered for energy (24%, due to higher allocations to National Agency for New Technologies and Environment) and GUF (16.3%) objectives.
Decreases on 1996 final budget occurred in the following objectives: society (-1.7%), space (-5.7%), and non-oriented research (-16.2%). The negative variation in the space category is due to an important decrease of space research allocation of the Italian Space Agency (ASI). Other variations, positive or negative, are especially due to the reorganisation of National Research Council (CNR) classification: in 1997, CNR allocations are broken down following the results of a survey on NABS objectives performed at the different research institutes and services.
In 1998, the provisional budget for research amounts to ITL 11,889,662 million, representing a decrease of 1.3% in nominal terms or a decrease of 4.7% in real terms (at 1995 prices). The major differences between final budget for 1997 and provisional budget for 1998 are due to an increase of allocations to environment (partly due to a reorganisation of CNR classification) and energy, and decreases in human health and in defence.
Table 5 : GBAORD in Italy, by groups of objectives (in %)
-Jf
eurostal Group 2-3-4-E 1-5-7-Í 6 10 11 12 13 Total
s of NABS objectives
! Human and social objectives I Technological objectives
Agriculture
Research funded by GUF Non-oriented research Other civil research Defence
Final budgets
1996 1997 14.8 14.0 23.4 23.1 2.1 2.2 42.5 45.4 14.1 10.9
-3.1 4.4 100.0 100.0
Provisional budgets
1997 1998 16.0 13.3 18.6 23.0 2.3 1.9 47.4 48.0 12.1 11.1
-3.5 2.7 100.0 100.0
Changes occurred between provisional and final data in 1997 due to under-estimation of provisional data. Positive differences can be found especially for objectives 9 (space) and 10 (university).
THE NETHERLANDS
Central government budget appropriations for R&D show an nominal increase of approximately 50 million NLG in the figures between the budgetary years 1996 and 1997 (final budget) and 180 million NLG between 1997 and 1998 (provisional budget). The final budget for 1997 amounts to 5.8 billion NLG in current terms, while the provisional budget for 1998 is higher, with a difference of +125 million NLG, equal to an increase of 2.2% between 1997 and 1998.
Table 6 :
-7?
eurostat
GBAORD in the Netherlands, by groups of objectives (in %)
Final budgets Groups of NABS objectives
2-3-4-8 1-5-7-9 6 10 11 12 13 Total
1996 1997 Human and social objectives 11.1 11.0 Technological objectives 19.2 19.4 Agriculture 4.3 4.0 Research funded by GUF 46.6 46.1 Non-oriented research 10.9 11.2 Other civil research 5.0 5.4 Defence 3.0 3.2
100.0 100.0
Provisional
1997 10.4 19.2 4.2 47.0 11.0 4.9 3.2 100.0
budgets
1998 10.6 19.8 3.8 46.4 11.3 5.1 3.0 100.0
The relative positions of the different objectives are quite stable. A substantial proportion of the budget is allocated to fundamental research, which is reflected by the fact that approximately 47% of the total budget are allocated to the GUF category and 11% to the non-oriented research category. Almost 20% of the budget are devoted to R&D with technological objectives. Research with human and social objectives is the third major area, with a share of approximately 10%. Changes in budgets of ministries are not the result of policy changes, but mainly due to methodological changes and better monitoring of R&D-efforts of ministries.
Priorities
S&T policy is oriented to stimulating scientific quality on the one hand and societal relevance on the other hand. This should lead to a closer co-operation between institutes in the public knowledge infrastructure and market parties (private as well as public). Public research institutes receive a basic funding (the relative weight depends on the function) and are stimulated to acquire contracts, both public and private.
Major methodological changes
AUSTRIA
Public funding of R&D amounted to ATS 15.6 billion in 1997 (final budget). This means that public R&D expenditure grew by a nominal 0.8% compared with the previous year. According to the federal estimate (provisional budget), public R&D funding for 1999 amounts to ATS 16.9 billion, a nominal increase of 1.4% on the corresponding figure in the provisional budget for 1998 (ATS 16.7 billion). Compared with the figure from the final budget for 1997, the 1999 figure represents a nominal increase of 8.6%.
1999 saw no fundamental change to the particularly dominant position occupied by the universities in Austrian research, with the result that about 65% of overall federal R&D expenditure is accounted for by Chapter 10, "Research financed from general university funds (GUF)". Following on from a slight nominal increase (0.9%) between 1996 and 1997, however, bigger increases have been recorded, particularly between 1997 and 1998 (1998: +8.6%, 1999: +1.7%). This is mainly because of the bigger difference, compared with previous years, between the provisional and final budgets for a given reference year. Most of the other groups of objectives, on the other hand, show much smaller rates of growth, with the "Technological objectives" group actually registering a nominal decline of 4.6% in 1998.
As can be seen from the following table, the relative share of "Research financed from GUF" is 66% in 1999. It should be borne in mind that ÖSTAT's detailed R&D surveys of Austria's universities have revealed that the share accounted for by applied research and experimental development is very large (1993: Applied research: 40%; experimental development: 11%).
Table 7 : GBAORD in Austria, by groups of objectives (in %)
=
Jf\
eurostalGroup 2-3-4-8 1-5-7-E 6 10 11 12 13 Total
s of NABS objectives
ί Human and social objectives I Technological objectives
Agriculture
Research funded by GUF Non-oriented research Other civil research Defence
Final budgets
1996 1997
8.5 9.4 9.5 9.2 3.2 3.3 64.7 64.7
14.0 13.2 0.1 0.2 0.0 0.0 100.0 100.0
Provisional budgets
1997 1998
8.9 8.9 8.2 8.1 3.2 3.2 65.8 65.9 13.8 13.8 0.1 0.1 0.0 0.0 100.0 100.0
As there are not usually very significant differences between the provisional and final budgets in Austria, a meaningful comparison can be made between the final budgets for 1996 and 1997 on the one hand and the provisional budgets for 1998 and 1999 on the other.
This means that, as in the years up to 1994, total public R&D spending has been rising continually in nominal terms (1998: 7.1%, 1999: 1.4%), with the relative shares of all the "smaller" groups of objectives remaining unchanged (apart from the relative share of "Technological objectives", which has declined), whereas the relative share of "Research financed from GUF" has increased.
Methodology
UNITED KINGDOM
Data on government expenditure on Research and Development are collected by means of an annual survey of Central Government Departments. The total net Government expenditure on R&D in 1997-98 was GBP 5892 million, representing 2.9% of the total Central Government expenditure and 0.7% of the UK GDP. The expenditure on R&D in 1997-98 increased in cash terms by GBP 132.2 million (2%) on 1996-97.
Table 8 : GBAORD in the UK, by groups of objectives (in %)
=7
eurostal
Groups of NABS objectives
2-3-4-8 1-5-7-S 6 10 11 12 13 Total
I Human and social objectives ι Technological objectives
Agriculture
Research funded by GUF Non-oriented research Other civil research Defence
Final budgets
1996 1997
20.5 20.3 7.8 6.6 4.5 4.6 17.8 17.5 11.8 11.4 0.4 0.4 37.2 39.2 100.0 100.0
Provisional budgets
1997 1998
20.4 20.6 6.9 5.4 4.4 4.3 18.5 18.1 11.8 11.7 0.4 0.4 37.7 39.5 100.0 100.0
The defence category is by far the largest sector accounting of around 39% of the total UK GBAORD. In 1997-98, Government expenditure on R&D in Defence was GBP 2312 million, representing an increase of 8% from the previous year. Social Sciences & Humanities objective is the second biggest category and it shows a small increase In expenditure from GBP 1183 million in 1996-97 to GBP 1196 million in 1997-98.
Other categories showing an increase in expenditure between 1996-97 to 1997-98 were; Agriculture, Research financed from GUF, and Other Research. Expenditure on agriculture increased from GBP 257 to GBP 269 million (5%), Research financed from GUF increased from GBP 1027 to GBP 1033 million (1%) and Other Research increased from GBP 20 to GBP 21 million (5%). Technological objectives and Non-orientated research on the other hand decreased by 13% and 1% respectively over the same time period.
NORWAY
Table 9 :
l=M
eurostatGBAORD in Norway, by groups of objectives (in %)
Final budgets Groups of NABS objectives
2-3-4-8 1-5-7-9 6 10 11 12 13 Total
1996 1997 Human and social objectives 19.2 19.7 Technological objectives 22.9 21.7 Agriculture 9.4 9.3 Research funded by GUF 35.5 37.0 Non-oriented research 7.2 6.8 Other civil research
Defence 5.8 5.5 100.0 100.0
Provisional budgets
1997 1998 19.7 19.2 21.7 21.3 9.3 9.1 36.8 38.5
6.9 6.4
-5.6 5.5 100.0 100.0
CHAPTER 2: R&D Expenditure and R&D Personnel
2.1. R&D EXPENDITURE AND R&D PERSONNEL AT NATIONAL LEVEL
Introductory remark
R&D activities require both funding and qualified staff. For statistical purposes, two inputs are measured - R&D expenditure and R&D personnel - normally on an annual basis. Both have their strengths and weaknesses, hence both are necessary to secure an adequate representation of the effort dedicated to R&D activities.
The basic measure for R&D expenditure is the "intramural expenditures", which are all expenditures for R&D performed within a statistical unit or sector of the economy, whatever the source of funds (Frascati Manual, § 335). For statistical purpose, both current and capital expenditures are included.2
R&D personnel data measure the amount of resources going directly into R&D activities. This includes all persons employed directly in R&D plus persons supplying direct services to R&D, such as managers, administrative staff and office staff (Frascati Manual § 279). R&D personnel data are collected for both full-time equivalent (FTE) and in-terms of physical persons ("headcounf, HC).3
Both intramural R&D expenditure and R&D personnel are broken down by institutional sector, i.e. the sectors in which the R&D is performed are specified. Four sectors are relevant in the context of this publication where indicators for R&D performance are compiled: the business enterprise sector, the government sector, the higher education sector, and the private non-profit sector 4 (see part 2.5 for
further details).
2.1 .A. R&D EXPENDITURE OF THE EEA
R&D expenditure in the EEA in 1997 is over ECU 137 billion
In 1997, total R&D expenditure in the EEA (excluding Luxembourg and Liechtenstein) amounted to an estimated ECU 137,700 million, representing a nominal increase of 4.6% on the previous year. In constant prices (PPS 1990), the R&D expenditure of the EEA increased by 2.3% from the previous year.
R&D expenditure as a percentage of GDP was above 2% between 1988-90, but since then this ratio has continuously declined (except 1993) and in 1997 total R&D expenditure in the EEA amounted to 1.9% of its respective GDP (figure 6).
Data on R&D expenditures are performance based, i.e. they refer to R&D effort that has been made in a given year. Owing to the time it takes to carry out such surveys and to process their results, data on R&D expenditure do not become available until a substantial time after the R&D has been carried out. Data on R&D expenditure are available for all Member States of the European Union (excluding Luxembourg), Norway and Iceland from 1987 onwards.
The data on R&D personnel are also performance based; i.e. they refer to the personnel that were employed in R&D in a given year. Data on R&D personnel are available in terms of HC and FTE for all Member States of the European Union (excluding Luxembourg), Norway and Iceland from 1987 onwards.
Figure 6 : Trends in R&D expenditure of the EEA, 1990-97
160
2 120 ω
Q-o8
« 80
0)
o
LU
ω
40
eurostat
3.0%
2.5%
θ α 2.0% CD
1.5%
1.0%
90 91 92 93 94 97
1 R&D expenditure as a % GDP —Φ—R&D expenditure (BECU, current prices) ■■■X·· R&D expenditure (PPS, 1990 prices)
Germany, France and the UK accounts for 67% of the EEA R&D expenditure
As expected, most of the EEA R&D expenditure is accounted for by Germany, France and the United Kingdom. Latest available figures (1996) shows that they account for approximately 67% of the total EEA R&D expenditure; however the share of EEA R&D accounted by the above mentioned three countries have been on a downward path since 1993.
In constant prices (1990 PPS), R&D expenditure of the four large EU Member States (Germany, France, Italy and the United Kingdom) have remained fairly stable since the late 1980s and early 1990s. However, the R&D expenditure of the smaller EEA countries like Ireland, Sweden, Denmark and Finland has increased over same time period.
3.8% of the Swedish GDP is devoted to R&D activities
When R&D expenditure is expressed as a proportion of GDP, Sweden clearly stands out from the rest of the EEA countries (figure 7). In 1997, 3.8% of the Swedish GDP was devoted to R&D activities, which represents a substantial increase from the 1991 figure. The largest increase in the R&D expenditure over GDP ratio since 1991 is recorded for Sweden followed by Finland and Iceland and the largest decreases are recorded for the United Kingdom, Germany and Italy. To a certain extent there exists a northsouth divide, where the expenditure over GDP ratio for the most of the northern countries is above the EEA average and for the southern countries it is below the EEA average.
R&D EXPENDITURE BY INSTITUTIONAL SECTORS
More than 60% of R&D expenditure is carried out in the business enterprise sector
Figure 7 : R&D expenditure as a % of GDP of the EEA countries, 1997
5%
4% f ! >
3%
2% +
1%
0%
o \ o
« dr <r <Γ 0\o
III
m
eurostat
ja?—.,.«*>_
c? «îV»
S FIN F D NL DK EEA EU UK EUR NO Β A IS IRL I E P EL
(96) (96) (96) 15 11 (95) (95) (93)
HES is the second largest sector; R&D expenditure carried out by this sector has continuously increased since the late 80s. In 1997, HES accounted for around 2 1 % of the total EEA R&D expenditure, representing a 3% point increase from the 1990 figure. The share of the government sector has remained more or less stable since the late 80s and in 1997 this sector accounted for around 16% of the total EEA R&D expenditure (figure 8).
Figure 8 : R&D expenditure of the EEA by institutional sectors, 1990-97
150 "
120 -I
g 90
S 60
tu CD
■.M.I
30
90
nil
.
91 92 93 94 95 96 97
HZ
'Δ
eurostat
■ HES DGOVJ
Π BES
At country level:
By contrast, in Greece and Portugal, the largest share of their respective total R&D expenditure is accounted by the HES. Total R&D expenditure of Iceland on the other hand is more evenly distributed amongst the three sectors.
Figure 9 : R&D expenditure as a % of GDP - by institutional sectors, 1997
4%
3 %
■-2%
1%
0% '·
HZ
Δ
eurostat
Hfl«
■GOV D HES O BES
•ir;1
ItøSh
J
FIN F D NL DK UK NO Β IS A IRL (96) (96) (96) (95) (93) (95)
EL (93)
2.1.Β. R&D PERSONNEL OF THE EEA
Over 2.2 million R&D personnel in the EEA
In 1997, the number of R&D personnel in the EEA (excluding Luxembourg and Liechtenstein) was an estimated 2,167,100 in terms of head count, which translated as 1,628,600 full time equivalents (figure 10). In the late 80s, R&D personnel (both HC and FTE) within the EEA gradually increased, although since then it has stabilise around the 2.1 to 2.2 million (HC) mark. Expressed as a percentage of the labour force, approximately 1.27% of the EEA labour force were employed in R&D in 1997, representing a slight increase on the previous year.
Around 60% of the EEA R&D personnel are located either in Germany, France or the UK
In terms of HC, approximately 60% of the total EEA R&D personnel are located either in Germany, France or the United Kingdom. However, the number of R&D personnel located in Germany has been continuously declining since 1991 and the latest figures show that the German 1997 R&D personnel is some 13.5% lower than the 1991 level. The number of R&D personnel located in France has continuously increased over the last seven years and the latest figures show that the 1997 level of R&D personnel is some 11% higher than the 1990 level.
The numbers of R&D personnel (both in terms of head count and FTE) in many countries, namely the smaller countries or those with a relatively low base, continue to increase according to the latest available data. R&D personnel located within the Nordic countries (Denmark, Sweden, Finland and Norway) are at their highest levels. R&D personnel located in Norway and Sweden increased at an average annual growth rate of 8% and 6% respectively, between 199197.
Figure 10 : Trends in R&D personnel located within the EEA, 1990-97
Thousands 2500 τ
2000
1500 4 *·
•X * x X
1000
500
mimi
90 91 92 93 94 95 96 97
3a
eurostat 1.8%
1.6%
- 1.4%
1.2%
1.0%
Ì ΓΓΤϊΒΒ R&D personnel as a % LF ■ X R&D personel (FTE) Thousands —♦— R&D personel (HC) Thousands
Nordic countries have the highest proportion of R&D personnel as a % of the LF
For more comparable comparisons, R&D personnel (HC) are expressed as a percentage of labour force (figure 11). As with R&D expenditure, the highest proportion of R&D personnel as a percentage of the labour force in 1997 can be found in Sweden (2.3%) followed by Finland and Iceland (2.2% each).
The other Nordic countries are also well above the EEA average, and generally show an upward trend. In contrast, the proportion of R&D personnel as a percentage of the labour force of the Southern EEA countries (Greece, Spain, Italy and Portugal) are well below the EEA average, despite the upward trend in recent years.
R&D PERSONNEL BY INSTITUTIONAL SECTORS
Although at the EEA level the BES remains the largest employer of R&D personnel, its share has been on a downward path. In 1990, around 5 1 % of the total EEA R&D personnel were employed within the BES, but by 1997 this share had declined to around 47%. Employment of the R&D personnel within the HES on the other hand has been on an upward trend; its share of the R&D personnel has increased from around 3 1 % in 1988 to 38% by 1997.
Figure 12 shows the R&D personnel as a proportion of the labour force. In 1997, around 0.59% of the EEA labour force are engaged R&D activities within the BES, 0.47% (of the LF) in the HES and around 0.2% in the Government sector.
Figure 11 : R&D personnel (HC) as a % of the LF of the EEA countries, 1997
3%
Γ
2% +
1%
-0%
J? ^
f ¿>
ƒ
: : ■ ■ (
■ ' ' ■ - ' ' ■ '
o\o 0\o ._
*?
^ -y
«ff*· <f
·■"'
0°\°
^ eurostat
o\o .
O - <o\o
S FIN IS NO DK D F NL UK EEA Β IRL A E I EL Ρ
(96) (96) (96) (93) (95) (95) (93) (96) (93)
[image:33.590.67.492.52.319.2]The latest available data shows that the R&D personnel (HC) in the higher education sector are at a higher level in most countries (with the exception of Belgium, Germany and the Netherlands) than their respective 1991 level. The largest increase of R&D personnel in the HES has been in Greece, Ireland and Spain, i.e. those countries starting from the lowest base. Steady increases in FTE in the HES can also be seen in France, Finland, Sweden, the UK and Norway.
Figure 12 : R&D personnel (HC) as a % of LF of the EEA (institutional sectors)
1.5%
τ-1 .2%
0.9%
0.6%
0.3%
0.0%
HZ
'Δ
eurostat
l l l l l l l l
íâlP
90
■■:■"■
91
■'•'.ili'
~ 1":.? ÌÉÉ
92
mm.
93
■
94
Ι HES
D GOV
D BES
95 96 97
Figure 13 : R&D personnel (HC) as a % of LF of the EEA countries (institutional sectors)
3% τ eurostat
m
o%
Γ.MM
ΠΙι
¡Χ .!■■_
- , . ; · ■ : . .
■GOV
□HES
D BES
S IS FIN NO DK D NL F Β IRL A UK E I EL Ρ (96) (96) (96) (95) (95) (93) (96) (93)
2.2. R&D EXPENDITURE AND PERSONNEL AT REGIONAL LEVEL
Introductory remark
R&D expenditure and R&D personnel are broken down by region. Regional breakdowns of the R&D expenditures and R&D personnel are timeconsuming and problematic. In the case of R&D expenditures, there is a particular problem in the case of units, particularly enterprises, which consist of two or more local units in different regions. If, in extreme cases, there is no additional information, all the intramural R&D expenditure (or R&D personnel) of the unit must be attributed to the region in which its headquarters are located, including any R&D expenditures incurred (or employee working) in other local units in other regions. The extent of such errors varies according to the economic structure and size of the country, and according to their survey methods.
The size of each region must be taken into account when interpreting regional intramural R&D expenditures or R&D personnel and most particularly when comparing regions. For this reason, such comparisons are based on derived indicators such as the intramural R&D expenditure of a region as a percentage of its respective GDP or R&D personnel of a region as a percentage of the labour force.
French regional R&D data should be treated with slight caution because they are under estimated due to the fact 16.1% of R&D expenditure and 29.2% of R&D personnel could not be registered to any particular region.
Map 1
Regional R&D expenditure
Z^
Expenditure by region, all sectors, as % of GDP (NUTS 95 level 2**)
French regional data are underestimated because 16.1% of the data are not allocated to any specific regions>= 2.00
1.50-2.00
0.75-1.50
<0.75
No data available
* Data for 1995 except: 1993: EL, A
1996: F, UK, NO
** NUTS level 0: NL, IS, NO NUTSIeveM:B, S, UK NUTS level 3 (aggregated): DK
WÙ
Statistical data: Eurostat, A4.
Cartography and geographic information management: Eurostat A4, based on GISCQ - 7/99.