This is a repository copy of Ignition sensitivity of solid fuel mixtures. White Rose Research Online URL for this paper:
http://eprints.whiterose.ac.uk/130728/ Version: Accepted Version
Article:
Fernandez-Anez, N, Slatter, DJF, Saeed, MA et al. (3 more authors) (2018) Ignition sensitivity of solid fuel mixtures. FUEL, 223. pp. 451-461. ISSN 0016-2361
https://doi.org/10.1016/j.fuel.2018.02.106
(c) 2018 Elsevier Ltd. All rights reserved. Licensed under the Creative Commons Attribution-Non Commercial No Derivatives 4.0 International License
(https://creativecommons.org/licenses/by-nc-nd/4.0/).
eprints@whiterose.ac.uk https://eprints.whiterose.ac.uk/
Reuse
This article is distributed under the terms of the Creative Commons Attribution-NonCommercial-NoDerivs (CC BY-NC-ND) licence. This licence only allows you to download this work and share it with others as long as you credit the authors, but you can’t change the article in any way or use it commercially. More
information and the full terms of the licence here: https://creativecommons.org/licenses/
Takedown
If you consider content in White Rose Research Online to be in breach of UK law, please notify us by
IGNITION SENSITIVITY OF SOLID FUEL MIXTURES
Nieves Fernandez-Aneza,b, David J.F. Slatterc, Muhammad Azam Saeedc, Herodotos N. Phylaktouc, Gordon E. Andrewsc, Javier Garcia-Torrenta,d
a
Department of Energy and Fuels, Universidad Politecnica de Madrid, Alenza 4, 28003,
Madrid, Spain
b
Department of Mechanical Engineering, Imperial College, SW7 1AZ, London, United
Kingdom
c
Energy Research Institute, School of Chemical and Process Engineering, University of
Leeds, Leeds, LS2 9JT, UK
d
Laboratorio Oficial Madariaga, LOM (Universidad Politecnica de Madrid, Spain) C/
Eric Kandel, 1 – (TECNOGETAFE), Parque Científico y Tecnológico de la UPM,
28906 Getafe (Madrid), Spain
Abstract
Due to both environmental concerns and the depletion of the reserves of fossil fuels,
alternative and more environmentally friendly fuels, such as biomass and waste
products, are being considered for partial or full fossil fuel replacement. The main
disadvantage of these products is their lower energy density compared to fossil fuels. To
deal with this several heat and power generation facilities are co-firing fuel mixtures.
These processes involve mixtures of flammable dusts whose ignitability and
explosibility characteristics are not known and therefore present un-quantified safety
risk to the new technologies.
This study reports on these risks and on the reactivity characteristics of two and three
components dust mixtures of coal / sewage-sludge / torrefied-wood-pellet. In particular
chemical composition, ignition sensitivity parameters (including minimum ignition
energy, minimum ignition temperature on a layer, minimum explosive concentration)
and flame speed have been determined. In all cases the measured parameters for the
mixtures were within the range defined by the lower and upper value of the constituent.
However, the expected values do not agree with the experimentally obtained ones,
providing more relaxed values than the ones needed on this facilities. *Revised Manuscript
Click here to view linked References Fernandez-Anez N, Slatter DJF, Saeed MA, Phylaktou HN, Andrews
Keywords: ignition, co-firing, solid fuels, biomass, waste, coal.
1 INTRODUCTION
In 2013, fossil fuels provided 81.2% of the total energy consumed worldwide [1]. For
the European Union, this number is slightly smaller and it is decreasing each year, but it
still represents a 72.6% of total [1]. Fossil fuels present several disadvantages that are
well-known, mainly the environmental problems associated with their use [2] and the
depletion of their reserves [3]. Focusing on the future, the European Union members
adopted a plan to fight against climate change focusing measurements on emissions
cuts, renewables and energy efficiency [4].
Related to this plan, the recovery of energy from biomass and non-recyclable waste products is one of the priorities of the European countries. The “202020 targets” stablish that for year 2020 greenhouse gas emissions should be reduced by 20 percent,
renewable energy sources should represent 20 percent of Europe’s final energy
consumption and energy efficiency should increase by 20 percent [5].
To achieve these targets, several researches are focused on the study and development
of a range of new materials that can be classified as biomass. According to the United
Nations Framework Convention on Climate Change [6], the term biomass is defined as:
“non-fossilized and biodegradable organic material originating from plant, animals and micro-organisms. This shall also include products, by-products, residues and waste
from agriculture, forestry and related industries as well as the non-fossilized and biodegradable organic fractions of industrial and municipal wastes”
Materials that have been considered as waste for a long time are nowadays used as new
fuels, for example: sewage sludge [7], plastics [8] or organic shells and pits [9, 10].
Added to these, traditional solid fuels such as wood have been studied and modified in
order to improve their properties. Processes such as pelletization and torrefaction
upgrade these materials providing a higher energy density and lowering their handling
costs [11, 12].
The main problems of these new fuels are that their properties as fuels are not as good
as those of coal (that they seek to replace), and that the use of these fuels may require
One of the preferred solutions is the use of co-firing. Co-firing is defined as the
combustion of two or more different types of materials at the same time. This
technology has been mainly implemented by mixing coal and biomass, and several
environmental benefits have been observed such as the reduction of atmospheric
emissions of target pollutants compared to traditionally coal-fired power plants [13],
and the reduction of particulate matter emissions [14]. Instead of using biomass,
co-firing can also take place with waste materials, which not only results in the recovery of
energy but also in a substantial reduction of the disposed volume and in the safe
destruction of toxic organic residues, solving part of the problem of waste disposal [15]
[16] [17]. One of the main advantages of co-firing is that the equipment previously used
for coal combustion can be used for these mixtures with a much lower economical
investment, however , further studies are very much needed to be conducted such as
improvement in boilers design, materials and combustion technology [18].
One of the main disadvantages of the addition of these substances to the combustion
process is the large amount of moisture they present, which can cause ignition and
combustion problems [19]. Decreasing the moisture has positive effects on the flue gas
temperature, ignition property, wall heat flux, flame stability and char burnout [20], but
they increase the flammability tendency of these mixtures.
With this technology, mixtures of different materials are used in many already existent
industrial facilities, but they must be treated as new fuels, as their properties are still
unknown. These properties include the energetic properties that are the objective of the
mixing process, but also the properties related with their ignition and combustion
tendency. Solid dusts present ignition and combustion properties that have to be
determined and understood for the design of fire and explosion prevention and
protection measures needed in such facilities [21]. Some researchers have studied the
flammability behaviour of mixtures of dusts, mainly with an inert dust [22-24]. By
mixing any flammable dust with inert dusts, the ignition tendency can be decreased, but
the influence that mixing two or more flammable dusts has not been studied yet.
The flammability properties that characterize coal [25], waste [26] and biomass [27]
dusts have to be carefully determined in each single case due to their heterogeneity, but
mean values show that they present a high ignition risk. This risk will also be present in
the mixtures of these materials, and will depend on the proportion of each component
The main objective of this research was to determine the risk of ignition of coal / waste /
biomass mixtures and to what extent this risk may change with the mixture composition
make up. To achieve this, the ignition sensitivity of such samples has been studied in
this work. The term “ignition sensitivity” involves the parameters related with the ease
of ignition and included the Minimum Ignition Temperature on a layer (MITl),
Minimum Ignition Energy (MIE) for a dust cloud, and Minimum Explosive
Concentration (MEC). These have been determined for a range of mixtures made up
with varying the proportions of the component fuels.
2 MATERIALS AND METHODS
2.1 MATERIALS
This study presents the results obtained from the analysis of ten mixtures of coal,
thermally dried sewage sludge and torrefied wood pellets in different mass percentages,
as shown in Table 1.
Proximate analyses and granulometry of these materials and their mixtures are shown in
Tables 2 to 5. The content of moisture of the three base samples was less than 10%, so
they can be defined as dry samples. The three base samples were milled before their
use. Coal and thermally dried sewage sludge presented the smaller particle size, having
round and hard particles, while torrefied wood pellet particles were elongated and brittle
with a larger size.
2.2 METHODS
The chemical and physical characteristics of the ten studied mixtures were determined.
Elemental analyses were carried out using a Flash 2000 Thermo Scientific Analyser at
the University of Leeds. Proximate and granulometric analyses were performed at the
Universidad Politecnica de Madrid. Proximate analyses were performed according to
EN 32004 [29], EN 32019 [30] and EN 32002 [31], while granulometry was determined
using a Mastersizer 2000 Analyser.
Thermogravimetric and differential scanning calorimetric analyses have been developed
de Madrid with a Mettler Toledo TG 50. In TG, the weight of the samples is measured
as a function of its temperature. The procedure was developed from 30 ºC to 800 ºC
with a heating rate of 5 K/min. Three main parameters are obtained by studying these
graphs: initial temperature and the maximum loss of weight temperature for both peaks
of the sample. TG with an oxygen stream instead of an air stream was developed, and
the oxidation temperatures of the samples were determined in the points where the
maximum loss of rate occurred. DSC is used to study the heat exchange of the sample
during a heating process. The test was developed from 30 ºC to 550 ºC, under a heating
rate of 20 K/min. In this case, three main parameters are obtained: the temperatures at
which the exothermic reaction starts and finishes and the temperature of change of
slope, at which the slow exothermic reaction starts to accelerate and become a rapid
reaction.
In order to determine the ignition sensitivity of the fuel mixtures, we determined (i) the
Minimum Ignition Temperature of a layer (MITl); (ii) the Minimum Ignition Energy of
a dust cloud (MIE) and (iii) the Minimum Explosive Concentration (MEC), the pressure
rise rate (dP/dt) and the flame speed (Sf).
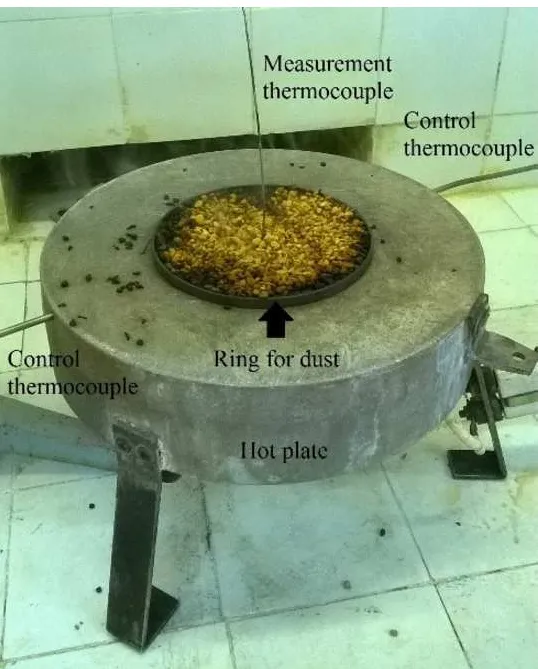
The Minimum Ignition Temperature of a layer (MITl) was determined at
Laboratorio Oficial Madariaga, Universidad Politecnica de Madrid, according to the EN
50281-2-1 [32]. The test equipment consisted of a round metallic surface of 20 mm
diameter, electrically heated. It could reach 400ºC and its temperature was controlled
with two thermocouples located at the middle point of the plate (Figure 1). One thinner
thermocouple (diameter of 0.20 to 0.25 mm) was located 2 or 3 mm above the surface
of the plate, measuring the temperature of the dust layer.
Dust layers were formed with a metallic ring of 100 mm of diameter located in the
middle of the plate. Once the target plate temperature was reached, dust was deposited
inside the ring with a spatula and distributed. Finally, the layer was levelled and all the
excess dust is removed.
It was considered that ignition occurred if (i) Incandescence or visible flame was shown,
(ii) a temperature of 450 ºC was reached in the middle point of the sample or (iii) a 250
K rise above the set plate temperature was measured in the middle point of the sample
If ignition was not observed within 30 minutes from the start of the test, the test was
test was repeated with a lower plate temperature (in multiples of 10) until ignition was
observed, defining the minimum ignition temperature as the lowest temperature at
which ignition occurred. The minimum ignition temperature had to be recorded, and the
first no ignition temperature had to be checked three times.
The standard thickness of the dust layer that is tested is 5 millimetres. However, in any
industrial facility the thickness of the dust layers cannot be limited to this value, and the
variation of this thickness could modify the minimum temperature at which a layer
ignites.
An indicator of the correlation between the maximum admissible surface temperature of
an equipment and the thickness of a dust layer deposited on this surface depending on
the minimum ignition temperature on a layer of 5 mm is shown in Standard EN
60079-14 [33] (Figure 2). However, these correlations are too crude and each line covers a
wide range of temperatures. As demonstrated by the actual MITl test data from this
work (see example points on Fig.2), there is a significant deviation between the
projected values for thicker layers and the actual measurements.
To study this variation, the procedure for MITl described above, was adapted for a 50
mm thickness ring, increasing the time of testing from 30 minutes to 8 hours.
The Minimum Ignition Energy (MIE) was determined with a Mike 3 apparatus in
Laboratorio Oficial Madariaga [34] (Figure 3). MIE is defined as the minimum amount
of energy required to ignite a dust cloud [35]. The apparatus consisted of a vertical
cylindrical glass tube with an inner diameter of 68 mm and a height of 300 mm giving a
volume of 1.2 L. The opposing ignition electrodes (6mm gap) were located half way up
the tube. The tube was connected at its base to a 50 ml air reservoir pressurised to 7 bar.
For each test a known mass of dust was placed in the dispersion cup and the dust was
dispersed into the tube by releasing opening the pressurised air reservoir. The spark was
automatically activated with an ignition delay of 120 ms, to allow time for dispersion
within the tube. The spark energy could be changed taking values of 1000, 300, 100, 30,
10, 3 and 1 mJ. A visual verification of a propagating flame in the glass tube was
required for an explosion to have occurred, in accordance with the Standard EN 13821
[36]. A total of 10 consecutive non-ignitions were required for a given test condition to
be considered non-ignitable. The MIE was estimated using the probability of ignition as
(1)
Where E1 is the highest energy at which no ignition occurs, E2 is the lowest energy at
which ignition occurs, I means ignition and NI means no ignition.
The Minimum Explosive Concentration (MEC), the pressure rise rate (dP/dt) and
the flame speed (Sf) were determined in the modified Hartmann tube located at
University of Leeds. The apparatus and methodology, previously described by Huescar
et al. [37], consisted on a 1 L vertical Perspex tube, 322 mm long with 61 mm internal
diameter mounted on a base that contained a 50 mL air reservoir connected to a line of
compressed air and pressurised to 0.8MPa, as shown in Figure 4. A remote control
handset operated the continuous ignition arc and the opening of the reservoir of air, and
therefore, the air dispersion. The constant electric arc was achieved from a high voltage
power supply.
Known masses of dust were loaded into the dispersion cup. The top of the tube was
always covered with a bursting vent (20 µm thickness aluminium foil secured with a
locking ring, with a dynamic bursting pressure of around 55 kPa). When the tube was
securely positioned vertically onto the base, compressed air was supplied to the internal
50 mL reservoir, pressurized to 0.8 MPa.
The modifications introduced to the apparatus included the fitting of a piezoelectric
Keller PAA-11 pressure transducer to record the pressure histories during each test and
three type-K thermocouples (mounted at 50 mm, 100 mm and 150 mm above the
ignitor) to record the time at which the flame arrived to each of the thermocouples.
The determination of MEC was achieved by testing decreasing mass of dust, repeating
each experiment three times, until a concentration was found at which no ignition
occurred in any of the three tests. Consequently, a curve representing probability of
explosion against concentration, or equivalence ratio, could be drawn. From such curve
the MEC or MEC for 50% and 100% probability of explosion could also be determined, as show on Figure 5 for three samples of the tested.
The modifications introduced on the Hartmann tube allowed the measurement of rates
of pressure rise and flame speeds which are good indicators of reactivity. The rate of
maximum pressure was reached (i.e. just before the aluminium foil cover burst). Flame
speeds were calculated through the times of flames arrival to the thermocouples situated
above the ignition source (based on the sudden change of the thermocouple output
voltage indicating the time of flame arrival), and were also confirmed by analysing the
images from a high speed camera [38], as shown in Figure 6.
3 RESULTS
Elemental and proximate analyses are shown in Tables 2 and 3. The samples composed
by torrefied wood pellets and one of the other tested materials (coal or sewage sludge)
exhibit an increase of carbon content when the percentage of the first one rises. The
content of nitrogen is higher when the woody biomass is not involved in the mixture,
and the same happens with the sulphur content, which is mainly present due to the coal
sample.
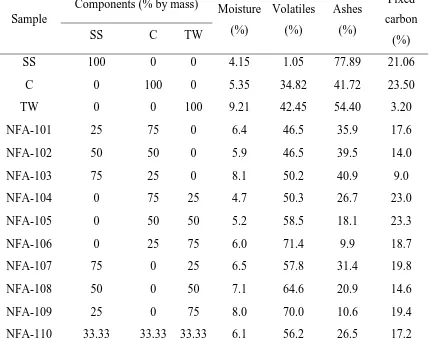
The particular coal sample used for these mixtures presented a low amount of volatiles,
and therefore samples without coal present higher volatiles content.
The C, H and O contents were used for the determination of the stoichiometric A/F (air
to fuel) ratios which were then used to express the mixture of dust and air as
equivalence ratio ( ), instead of as concentration, as this allow a more direct comparison
of different biomass materials and other fuels. The chemical reaction representing the
combustion of any biomass is represented by equation 2.
CnHmOpNqSr + (O2 + 3.76 N2) n CO2 + m/2 H2O + q NO + r SO2 + 3.76 N2 (2)
Where is determined by = n + m/4 – p/2 + q/2 + r
A simplified formula for biomass can be estimated neglecting N and S contents,
establishing an empirical formula CHyOz as stated in equation (3).
CHyOz + (O2 + 3.76 N2) CO2 + y/2 H2O + 3.76 N2 (3) Where is now determined by = 1+ y/4 –z/2 and the number of air moles is /0.21
Coefficients y and z represent, respectively, the atomic ratios H/C and O/C, which can
empirical formula of the biomass. From the balanced combustion equation in air, the
stoichiometric air to fuel mass ratio, A/F, can be obtained for a typical molecular mass
of air of 28.84 gram per mole (equation (4))
[A/F]stoich = (( /0.21) · 28.84)/(12 + y+ 16z) (4)
Also, for an air density of 1.2 kg/m3, dust concentration for stoichiometric concentration (equivalence ratio =1) can be obtained [37]. Table 4 shows these stoichiometry
parameters for the samples.
Each one of the former samples was milled and sieved through a sieve of 180 µm. They
were then mixed with the other components to obtain the samples for this study, which
have the granulometric characteristics shown in Table 5. The abbreviations d10, d50
and d90 represent the grain diameters at which 10%, 50% and 90% of the samples,
respectively, are finer than. SSA is the specific surface area that represents the total
surface area of a material per unit of mass. Coal sample presents a lower particle size, so
the samples prepared with higher amounts of coal resulted in lower d50 values, and
larger fractions of fine particles. The specific surface area of these thinner particles is
higher, while the values for the samples formed mainly by sewage sludge and torrefied
wood pellets are similar.
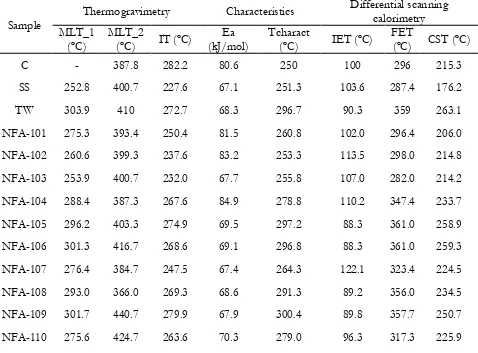
The data obtained from the TG and DSC analyses are showed in Table 6. When the
mixtures are formed by sewage sludge and coal, the addition of the first one causes an
increase on the values MLT_2, which means that the maximum loss of weight of the
sample takes place later. The first peak did not appear for coal samples, since it
represents the release of light volatiles which does not occur in this type of materials.
However, the combustion reaction starts earlier. When the samples are formed by
torrefied wood pellets and one of the other materials, the addition of torrefied wood
pellets causes a delay on the beginning of the combustion, as well as an increase on the
maximum loss of weight temperatures. Looking at the activation energy, only the
samples with higher amounts of coal present values of more than 79 kJ/mol, where the
self-ignition area changes.
The starting point of the exothermic reaction is lower when the content of torrefied
wood pellets is higher, taking place before the moisture loss in these cases, and after this
one of these materials. On the other hand, the end point of this reaction occurs later with
this addition of pellets, the same as the change of slope of the curve.
The values obtained for the minimum ignition temperature on a layer for both thickness
and the minimum ignition energy are shown in Table 7.
It can be observed that the ignition sensitivities of coal and sewage sludge samples are
almost constant independently of the percentage of them added to the mixture. The
value of the base samples (coal and sewage sludge) were very similar, and the three
studied mixtures present similar values, so no effect is added by mixing them.
In the case of torrefied wood pellets, its addition causes an increase on the MITl both to
coal and sewage sludge samples, i.e. the risk of ignition is lower, since the temperature
of the hot surface has to be higher to produce the ignition of the dust. Looking at the
MIE, the biomass has the opposite effect. By adding torrefied wood pellets, the energy
needed to ignite the cloud of dust is lower, so the ignition is easier. The ignition
mechanism of the MITl is thermal, by applying a constant temperature of the sample,
while the MIE presents an electrical mechanism. Additionally, the MIE is determined
by dispersing the sample in a cloud. Light samples as torrefied wood pellets can remain
longer in suspension than the heavier ones, so its ignition is easier.
Thanks to the probabilities of explosion and the photographic study of the high speed
camera obtained from the tests of the modified Hartmann tube, parameters shown in
Table 8 have been determined. Lower MEC suggests a higher reactivity and a greater
hazard presented by the material, since less concentration of dust is necessary for the
mixture to be ignitable. For typical hydrocarbon fuels (gases and vapours) the lower
flammability limit is of the order of =0.5. If the value determined for solids is near this
value, the evolved gases may be hydrocarbons (such as methane), but if the value is
lower, the evolved gases are flammable gases with much wider flammability range,
such as hydrogen.
Looking at the pressure rise and the flame speed, the most reactive mixture is defined as
the one where the peak values of these parameters is founded.
For the first three mixtures, formed by coal and sewage sludge (NFA-101 to 103), the
(NFA-104 to 106), a double effect is shown. In one hand, the higher the concentration
of biomass, the higher the (dP/dt)max and the Sf values so the samples present more reactivity. But on the other hand, the MEC is higher too, so the reactivity seems to be lower. In relation to the sewage sludge and torrefied wood pellets mixtures, the addition
of pellets made a more reactive sample, increasing the values of (dP/dt)max and the Sf and decreasing the values of MEC. Finally, looking at the sample formed by the three components, the values of both parameters are located in between the two-sample
mixtures, but closer to the highest reactive values.
4. DISCUSSION
The influence of both the physical and the chemical composition on the ignition
sensitivity of the mixtures was studied through a multivariate analysis. A correlation
matrix has been calculated with the software Statgraphics Centurion XVI, and the
significant correlations have been determined by a Pearson analysis with a significant
level of 5%.
Several well-known significant correlations have been observed, as the ones existing
between carbon and hydrogen content or between volatiles and ashes content. For the
present work, significant correlations between the studied ignition sensitivity
parameters and the chemical ones are highlighted and discussed in the following
subsections.
4.1. Parameters influencing the Minimum Ignition Energy of dust cloud (MIE)
The MIE presents significant correlations with four chemical parameters, positives with
sulphur, nitrogen and ash contents and negative with volatiles (Figure 7), i.e. the higher
the amount of volatiles and the lower the ash, sulphur and nitrogen contents, the more
reactive the sample is. It is well-known that the addition of inert dust is a common
technique used to avoid the ignition risk mainly of coals [39], so the influence of the ash
content on this parameter has been previously seen in many materials, as organic dusts
[40] or sewage sludge [26]. The influence of nitrogen and sulphur is due to their origin,
since they are mainly present on the coal and sewage the sludge samples, which have
sludge and coal, is higher than 1000 mJ, so the same happens with their mixtures and
the mixtures where they are the main components (NFA-101 to 104 and 107)
4.2. Parameters influencing the Minimum Ignition Temperature of a layer (MITl)
In the case of MITl, volatiles and ash contents produce the opposite behaviour than the
observed from the MIE, as shown in Figure 8. By increasing the volatiles content
(decreasing the ash content) MITl increases, so the ignition of a dust layer requires a
higher temperature - its reactivity is lower. Janès et al. [40] observed that the addition of
inert dusts modifies the layer porosity and the oxygen diffusion on this layer. The
mineral matter may generate a carbonaceous layer on the surface of the dust layer that
would restrict the oxygen access and promote the ignition process.
4.3. Parameters influencing the flame speed and rate of pressure rise
The effect of inert materials in the explosibility of biomasses has been previously
observed in several cases. An increase on these materials causes a decrease on the flame
speed and the rate of pressure rise [38], as can be seen in these samples (Figure 9).
4.4. Mixture characteristics in relation to the component characteristics
The expected mixture characteristics for any property W, were calculated assuming
mass weighted proportional contribution from each component i.e. ,
where xi are the percentages of i in the blend and Wi the values of the characteristic for each one of the components.
These calculated values were compared to the actual measurements and where these
were significantly different then a synergistic or antagonistic effect would be indicated.
Figure 10 shows that the correlation between the calculated and the measured values of
MIE does not fit a linear trend. The measured values are significantly lower than the
calculated ones, showing that the real risk existing for these mixtures is higher than the
calculated depending on the composition of the mixtures. Nevertheless, the comparison
parameters are extremely similar. The expected values are slightly smaller than the
measured ones, which means that this method of calculating the mixtures values will
provide stricter values.
This study show that torrefied wood pellets have a higher influence in the mixture than
the other samples. Firstly, in the case of the MIE, coal and sewage sludge present heavier particles that deposit quicker than the biomass’ ones, which can be suspended longer and generate an explosible cloud. Secondly, looking at the MITl a bigger
similarity is observed, and it is broken when the torrefied wood pellets quantity is
higher, when the MITl increases as it does when the layer is only formed by this
material.
However, tests should be done to be sure that all the industrial facilities are designing
their protection and prevention measures according to the right parameters.
5 CONCLUSIONS
The experimental determination of the ignition reactivity of dust mixtures is essential to
ensure safe working conditions at facilities where these materials are produced or
handled. A theoretical determination of these parameters through the base values of
their former components is not accurate and provides more relaxed values than the ones
needed on this facilities.
In order to determine the best composition of mixtures in terms of ignition risks, it has
been observed that the variation of the ignition sensitivity with the composition of the
mixtures depends on the way of distribution of the samples. When a cloud has to be
formed, torrefied wood pellets, formed by light and elongated particles, cause an
increase on the reactivity of the samples due to the ease of dispersion and suspension. A
cloud formed by this type of particles with high volatiles content remain longer, so the
propagation of the ignition through it is more probable. On the other hand, when a layer
is the cause of the ignition, the inert components of the samples cause a layer that
difficult the access of oxygen and promotes the ignition.
Nieves Fernandez-Anez was supported by the mobility program “Estancias breves en España y en el extranjero 2014” of the Universidad Politecnica de Madrid, Spain. Muhammad Azam Saeed was supported by “Faculty Development Program” from the University of Engineering and Technology, Lahore, Pakistan.
REFERENCES
[1] T. w. bank. (2015). Fossil fuel energy consumption Data. Available:
http://data.worldbank.org/indicator/EG.USE.COMM.FO.ZS/countries
[2] C D A B T A L
Natural gas, vol. 9, no. 25.3, p. 9.5, 2010.
[3] M. Höök and X. Tang, "Depletion of fossil fuels and anthropogenic climate change A review," Energy Policy, vol. 52, pp. 797-809, 2013.
[4] E. Commission. European Climate Change Programme. Available:
http://ec.europa.eu/clima/policies/eccp/index_en.htm
[5] E. Comission. 2020 climate & energy package. Available:
http://ec.europa.eu/clima/policies/strategies/2020/index_en.htm
[6] C. D. Mechanism. (2005). EB 20 report. Available:
https://cdm.unfccc.int/EB/020/eb20repan08.pdf
[7] W. Rulkens, "Sewage sludge as a biomass resource for the production of energy:
Energ Fuel, vol. 22, no. 1, pp. 9-15,
2007.
[8] J. Aguado, D. Serrano, and J. Escola, "Fuels from waste plastics by thermal and catalytic processes: a review," Industrial & Engineering Chemistry Research, vol. 47, no. 21, pp. 7982-7992, 2008.
[9] J. Caballero, J. Conesa, R. Font, and A. Marcilla, "Pyrolysis kinetics of almond shells and olive stones considering their organic fractions," Journal of Analytical and Applied Pyrolysis, vol. 42, no. 2, pp. 159-175, 1997.
[10] A. J. Tsamba, W. Yang, and W. Blasiak, "Pyrolysis characteristics and global kinetics of coconut and cashew nut shells," Fuel Processing Technology, vol. 87, no. 6, pp. 523-530, 2006.
[11] M. Van der Stelt, H. Gerhauser, J. Kiel, and K. Ptasinski, "Biomass upgrading by torrefaction for the production of biofuels: a review," Biomass and bioenergy, vol. 35, no. 9, pp. 3748-3762, 2011.
[12] W. Stelte, A. R. Sanadi, L. Shang, J. K. Holm, J. Ahrenfeldt, and U. B. Henriksen, "Recent developments in biomass pelletization A review," BioResources, vol. 7, no. 3, pp. 4451-4490, 2012.
[13] E. C. N. EP-C, "Environmental and Sustainable Technology Evaluation-Biomass Co-firing in Industrial Boilers University of Iowa," 2008.
[14] I. Al-Naiema, A. D. Estillore, I. A. Mudunkotuwa, V. H. Grassian, and E. A. Stone, "Impacts of co-firing biomass on emissions of particulate matter to the atmosphere,"
Fuel, 2015.
[15] J. Werther and T. Ogada, "Sewage sludge combustion," Progress in energy and combustion science, vol. 25, no. 1, pp. 55-116, 1999.
[17] E. Hughes, "Biomass cofiring: economics, policy and opportunities," Biomass and Bioenergy, vol. 19, no. 6, pp. 457-465, 2000.
[18] S. G. Sahu, N. Chakraborty, and P. Sarkar, "Coal biomass co-combustion: an overview,"
Renewable and Sustainable Energy Reviews, vol. 39, pp. 575-586, 2014.
[19] M. Sami, K. Annamalai, and M. Wooldridge, "Co-firing of coal and biomass fuel blends," Progress in energy and combustion science, vol. 27, no. 2, pp. 171-214, 2001. [20] P. Tan, L. Ma, J. Xia, Q. Fang, C. Zhang, and G. Chen, "Co-firing sludge in a pulverized
coal-fired utility boiler: Combustion characteristics and economic impacts," Energy,
vol. 119, pp. 392-399, 2017.
[21] N. Fernandez-Anez, D. J. F. Slatter, M. Azam Saeed, H. N. Phylaktou, G. E. Andrews, and J. Garciat-Torrent, "Ignition sensitivity of coal/waste/biomass mixtures " in
International Conference on Sustainable Energy & Environmental Protection, Paisley, Glasgow, United Kingdom, 2015.
[22] E. Danzi, L. Marmo, and D. Riccio, "Minimum ignition temperature of layer and cloud dust mixtures," Journal of Loss Prevention in the Process Industries, vol. 36, pp. 326-334, 2015.
[23] R. Sanchirico, P. Russo, V. Di Sarli, and A. Di Benedetto, "On the explosion and flammability behavior of mixtures of combustible dusts," Process Safety and Environmental Protection, vol. 94, pp. 410-419, 2015.
[24] O. Dufaud, L. Perrin, D. Bideau, and A. Laurent, "When solids meet solids: a glimpse into dust mixture explosions," Journal of Loss Prevention in the Process Industries, vol. 25, no. 5, pp. 853-861, 2012.
[25] K. L. Cashdollar, "Coal dust explosibility," J Loss Prevent Proc, vol. 9, no. 1, pp. 65-76, 1996.
[26] N. Fernandez-Anez, J. Garcia-Torrent, and L. Medic-Pejic, "Flammability properties of thermally dried sewage sludge," Fuel, 2014.
[27] J. G. Torrent, N. F. Anez, L. M. Pejic, and L. M. Mateos, "Assessment of self-ignition risks of solid biofuels by thermal analysis," Fuel, vol. 143, pp. 484-491, 2015.
[28] B. Binkau, C. Wanke, and U. Krause, "Influence of inert materials on the self-ignition of flammable dusts," Journal of Loss Prevention in the Process Industries, 2014.
[29] UNE 32004. Solid mineral fuels. Determination of ash, 1984.
[30] UNE 32019. Hard coal and coke - Determination of volatile matter content, 1984. [31] UNE 32002. Solid mineral fuels. Determination of moisture in the analysis sample,
1995.
[32] EN 50281-1. Electrical apparatus for use in the presence of combustible dust. Part 2-1: Test methods - Methods for determining the minimum ignition temperatures of dust, 1999.
[33] EN 60079-14. Explosive atmospheres - Part 14: Electrical installations design, selection and erection, 2010.
[34] A. Janes, J. Chaineaux, D. Carson, and P. A. Le Lore, "MIKE 3 versus HARTMANN apparatus: Comparison of measured minimum ignition energy (MIE)," Journal of hazardous materials, vol. 152, no. 1, pp. 32-39, 2008.
[35] Á. Ramírez, J. García-Torrent, and P. J. Aguado, "Determination of parameters used to prevent ignition of stored materials and to protect against explosions in food industries," J Hazard Mater, vol. 168, no. 1, pp. 115-120, 2009.
[36] EN 13821. Potentially explosive atmopheres. Explosion prevention and protection. Determination of minimum ignition energy of dust/air mixtures, 2002.
[38] M. A. Saeed, C. H. Medina, G. E. Andrews, H. N. Phylaktou, D. Slatter, and B. M. Gibbs, "Agricultural waste pulverised biomass: MEC and flame speeds," Journal of Loss Prevention in the Process Industries, 2014.
[39] B. B. Beamish and A. Arisoy, "Effect of mineral matter on coal self-heating rate," Fuel,
vol. 87, no. 1, pp. 125-130, 2008.
[40] A. Janès, A. Vignes, O. Dufaud, and D. Carson, "Experimental investigation of the influence of inert solids on ignition sensitivity of organic powders," Process Safety and Environmental Protection, vol. 92, no. 4, pp. 311-323, 2014.
Tables’ captions
Table 1. Composition (% by mass) of samples studied
Table 2. Elemental analysis (% by mass d.a.f.)
Table 3. Proximate analysis (% by mass d.b.)
Table 4. Stoichiometry parameters of mixtures
Table 5. Granulometric characteristics of mixtures
Table 6. Minimum Ignition Temperature of layer and Minimum Ignition Energy of dust
cloud
Table 7. Minimum Explosive Concentration
Figures’ captions
Figure 1. Hot place equipment
Figure 2. Correlation between maximum admissible surface temperature and thickness
of the dust layer [33]. The points shown are experimental measurements of MITl from
this work
Figure 3. Mike 3 apparatus
Figure 4. Modified Hartmann apparatus
Figure 5. Example of probability of explosion graph
Figure 6. Example of a high speed camera frame capture of the luminous flame after the
vent bursting.
Figure 8. Correlations minimum ignition temperature of a layer
Figure 9. Correlations flame speed and rate of pressure rise
Table 1. Composition (% by mass) of samples studied
Sample Sewage sludge
(SS) (%) Coal (C) (%)
Torrefied wood
pellets (TW) (%)
SS 100 0 0
C 0 100 0
TW 0 0 100
NFA-101 25 75 0
NFA-102 50 50 0
NFA-103 75 25 0
NFA-104 0 75 25
NFA-105 0 50 50
NFA-106 0 25 75
NFA-107 75 0 25
NFA-108 50 0 50
NFA-109 25 0 75
NFA-110 33.33 33.33 33.33
[image:19.595.71.490.100.442.2]Table 2. Elemental analysis (% by mass d.a.f.)
Sample
Components (% by
mass) C (%) H (%) N (%) S (%) O (%)
(diff.)
SS C TW
NFA-101 25 75 0 62.7 5.2 4.8 9.9 17.3
NFA-102 50 50 0 57.9 6.4 5.4 7.9 22.4
NFA-103 75 25 0 57.6 6.8 5.4 5.6 24.5
NFA-104 0 75 25 60.6 4.8 3.6 8.1 22.9
NFA-105 0 50 50 59.6 5.0 3.3 4.3 27.8
NFA-106 0 25 75 57.3 5.0 2.0 1.8 33.9
NFA-107 75 0 25 52.6 6.6 2.7 1.2 36.9
NFA-108 50 0 50 53.7 6.8 1.9 0.5 37.1
NFA-109 25 0 75 54.5 5.8 1.7 0.2 37.8
Table 3. Proximate analysis (% by mass d.b.)
Sample
Components (% by mass) Moisture
(%)
Volatiles
(%)
Ashes
(%)
Fixed
carbon
(%)
SS C TW
SS 100 0 0 4.15 1.05 77.89 21.06
C 0 100 0 5.35 34.82 41.72 23.50
TW 0 0 100 9.21 42.45 54.40 3.20
NFA-101 25 75 0 6.4 46.5 35.9 17.6
NFA-102 50 50 0 5.9 46.5 39.5 14.0
NFA-103 75 25 0 8.1 50.2 40.9 9.0
NFA-104 0 75 25 4.7 50.3 26.7 23.0
NFA-105 0 50 50 5.2 58.5 18.1 23.3
NFA-106 0 25 75 6.0 71.4 9.9 18.7
NFA-107 75 0 25 6.5 57.8 31.4 19.8
NFA-108 50 0 50 7.1 64.6 20.9 14.6
NFA-109 25 0 75 8.0 70.0 10.6 19.4
Table 4. Stoichiometry parameters of mixtures
Sample
Components (% by mass)
Stoich. A/F
(g/g)
Stoich.
concentration
(g/m3)
SS C TW
NFA-101 25 75 0 7.98 260.51
NFA-102 50 50 0 6.90 318.26
NFA-103 75 25 0 6.40 367.84
NFA-104 0 75 25 7.30 239.54
NFA-105 0 50 50 6.98 224.18
NFA-106 0 25 75 6.41 222.54
NFA-107 75 0 25 4.99 387.19
NFA-108 50 0 50 5.70 292.13
NFA-109 25 0 75 5.90 249.81
Table 5. Granulometric characteristics of mixtures
Sample
Components (% by
mass) d10
(µm) d50 (µm) d90 (µm)
SSA
(m2/g)
SS C TW
SS 100 0 0 24.47 98.11 204.28 0.125
C 0 100 0 4.40 26.79 68.22 0.620
TW 0 0 100 22.27 103.97 326.91 0.130
NFA-101 25 75 0 8.6 64.4 184.2 0.276
NFA-102 50 50 0 24.1 101.1 205.2 0.138
NFA-103 75 25 0 27.1 108.3 208.3 0.126
NFA-104 0 75 25 9.8 83.2 297.1 0.234
NFA-105 0 50 50 29.5 140.3 402.4 0.100
NFA-106 0 25 75 38.7 139.7 353.0 0.089
NFA-107 75 0 25 43.8 124.1 264.9 0.090
NFA-108 50 0 50 28.5 129.7 336.7 0.106
NFA-109 25 0 75 34.6 130.3 308.4 0.097
Table 6. Thermogravimetry and differential scanning calorimetry results for mixtures
Sample
Thermogravimetry Characteristics Differential scanning
calorimetry MLT_1
(ºC)
MLT_2
(ºC) IT (ºC)
Ea (kJ/mol)
Tcharact
(ºC) IET (ºC)
FET
(ºC) CST (ºC)
C - 387.8 282.2 80.6 250 100 296 215.3
SS 252.8 400.7 227.6 67.1 251.3 103.6 287.4 176.2
TW 303.9 410 272.7 68.3 296.7 90.3 359 263.1
NFA-101 275.3 393.4 250.4 81.5 260.8 102.0 296.4 206.0
NFA-102 260.6 399.3 237.6 83.2 253.3 113.5 298.0 214.8
NFA-103 253.9 400.7 232.0 67.7 255.8 107.0 282.0 214.2
NFA-104 288.4 387.3 267.6 84.9 278.8 110.2 347.4 233.7
NFA-105 296.2 403.3 274.9 69.5 297.2 88.3 361.0 258.9
NFA-106 301.3 416.7 268.6 69.1 296.8 88.3 361.0 259.3
NFA-107 276.4 384.7 247.5 67.4 264.3 122.1 323.4 224.5
NFA-108 293.0 366.0 269.3 68.6 291.3 89.2 356.0 234.5
NFA-109 301.7 440.7 279.9 67.9 300.4 89.8 357.7 250.7
Table 7. Minimum Ignition Temperature of layer and Minimum Ignition Energy of dust cloud
Sample
Components (% by mass) MITl 5
mm (ºC)
MITl 50
mm (ºC) MIE (mJ)
SS C TW
SS 100 0 0 260 210 >1000
C 0 100 0 270 210 >1000
TW 0 0 100 320 250 74
NFA-101 25 75 0 270 210 >1000
NFA-102 50 50 0 270 210 >1000
NFA-103 75 25 0 260 210 >1000
NFA-104 0 75 25 290 220 660
NFA-105 0 50 50 300 230 170
NFA-106 0 25 75 320 240 74
NFA-107 75 0 25 280 210 190
NFA-108 50 0 50 290 220 74
NFA-109 25 0 75 320 230 74
Table 8. Minimum Explosive Concentration
Sample Components (% by mass) Minimum explosive concentration Most reactive
SS C TW MEC0 MEC50 MEC100 (dP/dt)max Sf (m/s)
NFA-101 25 75 0 0.50 0.68 0.78 1.42 5.73 1.08
NFA-102 50 50 0 0.46 0.55 0.64 0.76 5.37 1.72
NFA-103 75 25 0 0.30 0.48 0.60 1.01 8.20 1.37
NFA-104 0 75 25 0.39 0.45 0.77 1.55 12.74 2.31
NFA-105 0 50 50 0.41 0.46 0.50 0.83 14.27 4.00
NFA-106 0 25 75 0.42 0.48 0.67 1.66 17.22 4.84
NFA-107 75 0 25 0.38 0.40 0.43 0.96 11.00 3.19
NFA-108 50 0 50 0.25 0.39 0.44 1.27 12.52 3.72
NFA-109 25 0 75 0.22 0.33 0.45 2.96 20.71 5.37
Figure 1
Figure 2
Figure 3
Figure 4
Figure 5
Figure 6
Figure 7
Figure 8
Figure 9
Figure 10
Figure 11