This is a repository copy of Impact breakage of pharmaceutical tablets. White Rose Research Online URL for this paper:
http://eprints.whiterose.ac.uk/125163/ Version: Accepted Version
Article:
Hare, C, Bonakdar, T, Ghadiri, M orcid.org/0000-0003-0479-2845 et al. (1 more author) (2018) Impact breakage of pharmaceutical tablets. International Journal of Pharmaceutics, 536 (1). pp. 370-376. ISSN 0378-5173
https://doi.org/10.1016/j.ijpharm.2017.11.066
© 2017 Elsevier B.V. This manuscript version is made available under the CC-BY-NC-ND 4.0 license http://creativecommons.org/licenses/by-nc-nd/4.0/
[email protected] https://eprints.whiterose.ac.uk/
Reuse
This article is distributed under the terms of the Creative Commons Attribution-NonCommercial-NoDerivs (CC BY-NC-ND) licence. This licence only allows you to download this work and share it with others as long as you credit the authors, but you can’t change the article in any way or use it commercially. More
information and the full terms of the licence here: https://creativecommons.org/licenses/
Takedown
If you consider content in White Rose Research Online to be in breach of UK law, please notify us by
Accepted Manuscript
Title: Impact Breakage of Pharmaceutical Tablets
Authors: C. Hare, T. Bonakdar, M. Ghadiri, J. Strong
PII: S0378-5173(17)31121-3
DOI: https://doi.org/10.1016/j.ijpharm.2017.11.066
Reference: IJP 17186
To appear in: International Journal of Pharmaceutics
Received date: 15-9-2017
Revised date: 15-11-2017
Accepted date: 27-11-2017
Please cite this article as: Hare C, Bonakdar T, Ghadiri M, Strong J, Impact Breakage of Pharmaceutical Tablets, International Journal of Pharmaceutics(2010), https://doi.org/10.1016/j.ijpharm.2017.11.066
1
Impact Breakage of Pharmaceutical Tablets
C. Hare1,2*, T. Bonakdar1, M. Ghadiri1, J. Strong3
1 The School of Chemical and Process Engineering, University of Leeds, Leeds, UK
2 Department of Chemical and Process Engineering, University of Surrey, Guildford, UK
3 AbbVie, North Chicago, Illinois, USA
*corresponding author contact details: Tel: +441843689472, e-mail: [email protected]
Graphical Abstract
Abstract
Tablets are the most common solid dosage form of pharmaceutical active ingredients due to
their ease of use. Their dissolution behaviour depends on the particle size distribution and
physicochemical properties of the formulation, and the compression process, which need to be
optimised for producing consistently robust tablets, as weaker tablets are often prone to
breakage during production, transport and end use. Tablet strength is typically determined by
2
a plane along the compression axis, whilst the latter, carried out in a rotating drum, incurs
surface damage and produces chips and debris. These tests produce different measures of
strength, neither of which have been correlated with mechanical properties that are accountable
for breakage, i.e. hardness, elastic modulus and fracture toughness. We propose a new method
based on single tablet impact testing, following the work of Ghadiri and Zhang (2002), who
analysed particle damage by propagation of sub-surface lateral cracks and identified the
fundamental form accountable for impact surface damage to be a lumped parameter related to
hardness and fracture toughness. Microindentation, carried out separately, to determine
fracture toughness led to complete failure of the tablets, hence an unreliable measurement of
fracture toughness and no correlation with the experimental trend. In addition, by assuming
the fracture toughness to be proportional to the square root of Young’s modulus, the indentation
measurements do not correlate well with the impact breakage. The discrepancy between the
impact and indentation methods is expected to be due to mechanical property variation across
the tablet surface, and with strain rate. The impact method is a more suitable test to describe
tablet propensity for attrition as it directly represents the failure mode tablets may experience
during processing under well-defined conditions. In contrast, the friability test subjects tablets
to a similar breakage mechanism but under less well-defined conditions, whilst the
compression test represents a different failure mode that is not representative of stresses
incurred during processing.
1. Introduction
Tablets are a very common dosage form of pharmaceutical active ingredients, due to their ease
of use and rapid manufacturing route. Weak tablets are often prone to breakage during
3
product specifications. Furthermore, surface damage by chipping is aesthetically undesirable
and can affect content uniformity. It is therefore necessary to have reliable means of
determining and predicting the extent of breakage tablets may experience during the production
process.
The most common method of characterising tablet strength in industry is by diametric
compression (Sinka et al., 2007), which is a standard test described by the United States
Pharmacopoeia monograph 1217 (USP35/NF30, 2011) often referred to as a “hardness” test.
This gives rise to propagation of a crack on a plane along the compression axis once the failure
force is reached. From this test the tensile strength, T, of the tablet is established following
the relationship of Fell and Newton (1970):
dt F 2
T (Eq. 1)
where F is the breakage force and d and t are the tablet diameter and thickness, respectively.
For flat, cylindrical tablets an analytical solution based on Linear Elastic Fracture Mechanics
(LEFM) exists for determining tensile strength from the failure force (Timoshenko and
Goodier, 1969). An empirical relationship between tensile strength and failure force which
takes into account the tablet dimensions has been developed for gypsum specimens of curved
cylindrical shape (Pitt et al., 1989) and elongated shape (Pitt and Heasley, 2013), whilst a
modified version of this relationship was proposed for microcrystalline cellulose tablets by
Shang et al. (2013). Fell and Newton (1970) determined that it is necessary to use padding
between the tablet and the platens in order to minimise shear stresses at the tablet boundary,
however if this padding is too soft then tensile failure may be prevented. The tensile strength
4
pressures defects may arise, such as cracking or delamination, which result in a strength
reduction (Sinka et al., 2007). In addition, compression speed and dwell time influence the
tablet strength (Sinka et al., 2007; Tye et al., 2005). Conflicting results have been reported on
the effect of binder particle size on tensile strength: Mangal et al. (2016) and Arndt and
Kleinebudde (2017) each investigated the tensile strength of paracetamol tablets of differing
formulations, with the tensile strength being linearly related to binder particle size for the
former work, and inversely related to the logarithm of binder particle size for the latter. In
manufacturing tablets, the intention is not to maximise strength – a guide tensile strength of 1.5
– 2.5 MPa is recommended by Stricker (1987) – since this may impede disintegration in the
digestive system, however it is necessary to have sufficiently robust tablets to prevent excessive
attrition during handling of tablets in production and by the end user. A wide range of
non-invasive techniques for analysis of tablet properties were reviewed by Dave et al. (2017), with
a number of soundwave-based methods identified for characterisation of tablet mechanical
properties. These methods are used in a supportive manner in some instances, however
analytical efficiency and operational complexity are cited as current barriers to widespread
adoption.
For testing the durability of tablets, the “Roche Friabilator” was introduced by Webster and
Abbé (1955). In this test, following the Method (2.9.7) of the European Pharmacopoeia (2010),
20 tablets are typically loaded into a rotating drum of 283 – 291 mm diameter and rotated at
25 rpm for four minutes. The drum contains a single curved baffle extending radially from a
central shaft to the wall, which lifts the tablets and subjects them to impacts at the base of the
drum. The percentage mass loss from the tablets is referred to as the friability of the tablets,
with a threshold of 1% given as the upper limit. Friability has been shown to reduce with an
5
in relative density (Sinka et al., 2009). Sinka et al. (2009) also showed an approximately linear
increase in friability of MCC tablets with rotation number, when tested beyond the standard
100 revolutions, until a weight loss of around 15%. Gong and Sun (2015) investigated a wide
range of tablet ‘brittleness’ indices and found the strongest correlation with results of the
friability test to be the reciprocal of the elastic strain to failure during diametric compression.
In the review of mechanical strength of tablets given by Podczeck (2012), the recommended
limit of 1% for friability is suggested to be too high for many applications. This test method
aims to characterise the susceptibility of tablets to attrition. However tablet impacts are not
controlled, and complex dynamic stressing conditions prevail, giving rise to a distribution of
impact numbers, angles and velocities, as well as impacts being with the base and with other
tablets. Furthermore, since the stresses to which tablets are exposed in processing and by
patients has not been established (Podczeck, 2012), the friability test lacks the credibility of
replicating these conditions.
Yüregir et al. (1986) introduced a method of subjecting single particles to impact breakage
under controlled conditions of impact velocity, speed and target material. To our knowledge
such an approach has not been reported for assessing breakage of tablets. Ghadiri and Zhang
(2002) proposed that for particles failing in a chipping mode, the attrition propensity (% mass
loss), W, is related to the particle’s physical and mechanical properties and impact conditions
as given by Eq 1.
2 c
2
K V H D
W (Eq. 1)
where is a proportionality factor which is related to the geometrical features of the shape of
6
plastic flow and crack propagation, , D, H and Kc are the particle density, characteristic length,
hardness and fracture toughness, respectively, and V is the impact velocity. Zhang and Ghadiri
(2002) validated the above dependency on attrition rate with material properties, particle size
and impact velocity for ionic crystals of KCl, MgO and NaCl, and found to vary from 1 × 10
-4 to 8 × 10⁻⁴ for MgO and NaCl, respectively. In addition, it was shown that no breakage occurs
below a threshold chipping velocity, and that the change in attrition rate with number of impacts
is material specific.
In this work we propose the single impact method as a means of quantifying the attrition
propensity of tablets. Furthermore, we explore the relationship between impact breakage of
the tablets and their mechanical properties. It is important to note that the mechanical
properties of tablets may vary from the centre to the edge (Sinka et al., 2003). Since damage
due to chipping occurs at the edges, the impact method is expected to offer a more accurate
prediction of attrition propensity than by mechanical property measurement.
2. Materials & methods
Cylindrical tablets of Avicel PH102 (a form of microcrystalline cellulose) with 10 mm diameter
and a mass of approximately 0.29 g were produced by AbbVie to obtain solid fractions, SF, of
0.65, 0.7, 0.75, 0.8 and 0.85, and thicknesses of 2.95 – 3.89 mm (see Table 1). The tablets
were produced using a Huxley Bertram ESH Tablet Press Simulator with a flat punch, using a
1% mass loading of magnesium stearate in the blend, under load control with a linear increase
in compaction pressure against time. The total compression time was of the order of one
7
literature. To assess impact damage, a single tablet was dropped from the top of a vertical tube
of given height to provide a single impact against a rigid stainless steel target at a speed set by
the tube height. Each tablet was manually released, with its cylindrical axis aligned
approximately horizontally. The impacted tablet was collected and dropped again from the top
of the tube until a given tablet experienced fifty successive impacts. After each five successive
impacts the tablet mass remaining was measured on a laboratory scale with a resolution of 0.1
mg. Tubes with heights of 0.85, 1.4, 4 and 5 m were used, with inner diameters of 16 and 25
mm for the shorter two tubes and the longer two tubes, respectively. The two shorter tubes
were made of glass and so the absence of impacts against the tube during freefall could be
confirmed. The longer two tubes were made of stainless steel, and whilst it could not be
confirmed that the tablets did not impact the tubes during freefall, no impacts were audibly
detected. One tablet was used for each height. The impact angle of the tablet varied between
successive impacts and at different velocities, with the impact always taking place on an edge
of the tablet rather than the tablet face, a typical example is shown in Figure 1. The impact
velocity at each height was measured using an HG-100K Redlake high-speed camera for ten
separate tablets, using the last ten frames before the tablet contacted the target. The average
value for each drop height is reported.
The mechanical properties of the tablets were measured using a Vickers indenter connected to
an Instron 5566 mechanical testing machine. Each tablet was placed onto a stainless steel
platen with its cylindrical axis aligned vertically, and penetrated at its centre by a Vickers
indenter at a loading rate of 0.01 N/s to a maximum load of 1 N, followed by unloading at the
same rate to determine hardness and Young’s modulus, E. Fracture toughness, Kc, was
8
rate of 0.5 N/s. The hardness, Young’s modulus and fracture toughness are given by Eqs 2, 3
and 5, respectively.
2 c ma x
kh
F
H
(Eq. 2)where Fmax is the maximum force during loading, k is a shape factor (equal to 24.5 for a
Vickers indenter) and hc is the indentation depth after unloading (Ghadiri, 2006).
A S 2
Er
(Eq. 3)where Eris the reduced Young’s modulus, S is the unloading stiffness and A is the projected
area of indentation (equal to khc2).
i 2 i s 2 s r E 1 E 1 E
1
(Eq. 4)
where is the Poisson ratio and subscripts s and i refer to the sample and indenter,
respectively. Many correlations exist in the literature for determination of fracture toughness
by indentation (Ponton and Rawlings, 1989). Here we use the correlation of Laugier (1987),
given in Eq. 5, as it is considered to be one of the most comprehensive, since it takes into
account the Young’s modulus, hardness and plastic zone size.
ma x32
2 1 3 2 c c F l a H E 143 . 0
K (Eq. 5)
where a is the average lateral distance from the centre to corner of the indent, l is the length
of the crack from the initiating corner to its tip and c is the distance from the centre of the
indent to the crack tip (equal to a + l).
9
3. Results & discussion
Impact breakage
The average impact velocity was measured to be 3.8, 4.0, 5.2 and 7.3 m/s for tablets dropped
from heights of 0.85, 1.4, 4 and 5 m, respectively. The cumulative mass losses for tablets of
each solid fraction dropped from a height of 0.85, 1.4, 4 and 5 m are shown in Figures 2a, b, c
and d, respectively. In all cases the tablets failed by attrition/chipping; no fragmentation was
observed. At all impact velocities the mass loss increases approximately linearly with the
number of impacts, and decreases as solid fraction is increased. Minor deviations from this
linearity are present, but for this material and for the range of conditions used, no significant
fatigue or work-hardening effects are observed.
Figure 3 shows the cumulative mass loss after fifty successive impacts at each impact velocity
for each tablet solid fraction. The mass loss increases with impact velocity, as expected and
observed in Figure 2. Figure 3 clearly shows the similarity in breakage behaviour of the tablets
with solid fractions of 0.8 and 0.85. For all tablets the mass loss is approximately doubled as
the impact velocity is increased from 5.2 to 7.3 m/s, which represents an increase in kinetic
energy at impact of 97%.
The Ghadiri & Zhang (2002) model, given by Eq. 1, can be rearranged to determine the
propensity for breakage of a solid under impact conditions, as given by Eq. 6.
2 2
2 c
DV C DV K
H
W (Eq. 6)
where C ( H/Kc2) is the material’s propensity for breakage (Ali et al., 2015). By assuming the
10
the linear fit of extent of breakage after fifty impacts (W) against DV2, as shown in Figure 4.
The propensity for breakage (C) for tablets of each solid fraction is compared to the mechanical
properties derived from indentation following determination of mechanical properties.
Hardness & Young’s modulus
The mechanical properties were measured for four tablets of each solid fraction with the
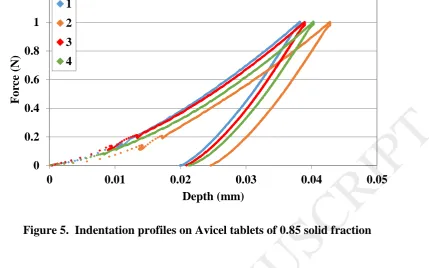
conditions described in the previous section. The measured load versus penetration depth for
the four indents on tablets of solid fraction 0.85 are shown in Figure 5.
The unloading curve is initially close to a linear relationship, though towards the end of
unloading there is a slight curvature. It is known that hardness is overestimated if the plastic
depth is assumed to equal the intercept with the depth axis (Stilwell and Tabor, 1961). Here
we approximate the unloading curve to be linear, and calculate the stiffness and plastic
deformation using a linear fit between 50 and 95% of the maximum indentation force.
Hardness and Young’s modulus are calculated using Eqs. 2 and 4, respectively, and are shown
in Figure 6 and Table 2 for tablets of each solid fraction. The error bars in Figure 6 indicate
one standard deviation. Both hardness and Young’s modulus increase with solid fraction, with
the values increasing by factors of approximately 2 and 3, respectively, when solid fraction is
increased from 0.65 to 0.85. The coefficient of variation is quite high for the hardness
measurements, but less so for Young’s modulus, with the variation being significantly higher
for tablets with a solid fraction of 0.65 for both parameters.
Fracture toughness – failure method
Tablets were indented using loads of 100, 150, 200, 250 and 300 N in an attempt to generate a
11
crack length, however no cracks were observed on any intact tablet indented at any load. At
higher load the tablets failed by crack propagation from each of the four corners of the
impression left by the Vickers indenter, as indicated in Figure 7. The average minimum failure
force of four tablets for each solid fraction is given in Figure 8, where error bars indicate one
standard deviation. The average failure force increases with solid fraction, from 143 N for a
solid fraction of 0.65 to 241 N for a solid fraction of 0.85. Indents were made at a force equal
to 90% of the failure force for tablets of each solid fraction, however no cracks were observed
for any of the tablets when analysed under SEM.
Determination of indentation fracture toughness requires generation of a crack, we therefore
analyse the fracture toughness of the tablets based on the crack length leading to failure, which
is generated at the failure force. Referring to Eq. 5, the crack length, l, is assumed to be equal
to the distance from the corner of the indent to the edge of the tablet, and c is equal to the tablet
radius (i.e. 5 mm) as the crack reaches the edge of the tablet, whilst a is calculated from the
penetration depth, h, and the Vickers indenter geometry, and l = c - a. In this method the crack
length is likely to be underestimated, since were the tablet wider the crack may propagate
further, and hence the fracture toughness is likely to be overestimated.
Fracture toughness – LEFM method
As an alternative method for determination of fracture toughness, we also consider Linear
Elastic Fracture Mechanics (Lawn, 1993), which states
E
2
K
c2
(Eq. 7)where is the fracture surface energy of the material. Since all tablets considered in this work
12
plastic flow which enlarges the interparticle contact areas, we assume the surface energy is
constant and independent of the packing density. Therefore, fracture toughness is proportional
to the square root of Young’s modulus of the tablet. For simplicity we take the value of Kc for
tablets of 0.65 solid fraction from the failure method to be correct and use the proportional
change in Young’s modulus to determine the fracture toughness for tablets of different solid
fraction.
Fracture toughness - comparison
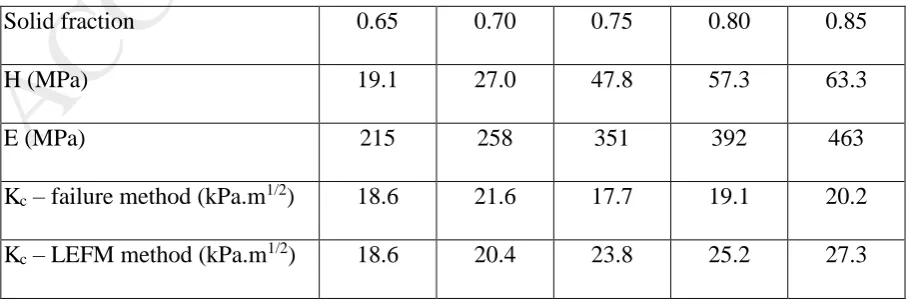
The fracture toughness values determined by both methods are given in Table 3, along with the
values of H/Kc2 determined by indentation by both methods, and the value of C ( H/Kc2)
determined by impact breakage. The fracture toughness determined by the crack length at
failure method is almost independent of the tablet solid fraction. This seems an unlikely trend
since fracture toughness is expected to increase with solid fraction; in fact Kc for single particles
is often estimated by extrapolation to zero porosity of the Kc variation with beam porosity using
the fitting equations of Spriggs (1986) or Spinner et al. (1963). However since the tablets of
greater solid fraction have a reduced thickness, this may have had a confounding effect on the
measured fracture toughness, though it should be noted that this effect is not present in the
results from the LEFM method.
Figure 9 compares the index (H/Kc2) determined using the failure method and LEFM method,
and the propensity for breakage ( H/Kc2) determined by impact tests. It should be noted that
is small, and therefore what is important for comparison is the trend of the data points rather
than the actual values. The index (H/Kc2) increases with solid fraction for both the failure
method and LEFM method, though more substantially for the failure method. In contrast, the
13
intuitively expected. A number of factors may give rise to the discrepancy in the trend between
the indentation methods and the impact breakage.
1. The assumption that the crack would terminate at a distance of 5 mm (the tablet radius)
from the centre of the indent, even if the tablet diameter were increased, is false.
2. LEFM method may not be applicable.
3. The Ghadiri and Zhang (2002) model is not applicable for tablets.
4. The mechanical properties of the tablet differ at the centre (measured by indentation)
and the corners, where breakage occurs by chipping under impact as the solid packing
density would be different.
5. The mechanical properties of the tablet may depend on the strain rate of the failure
mode, hence leading to different behaviour under quasi-static indentation and dynamic
impact.
The assumption that the crack would terminate at 5 mm from the indent appears to be too
simplistic (despite the fact that the minimum load required to get fracture propagation was
used), particularly since this leads to fracture toughness being almost independent of porosity.
The variation of fracture toughness with porosity for LEFM method is more reasonable,
however further work is required to characterise the variation of hardness, elastic modulus and
fracture toughness from the centre to the edge. Density and hardness have been shown to
exhibit variations along the radial direction under certain compaction conditions (Sinka et al.,
2003). Indeed this seems the most likely reason for the discrepancy between the indentation
and impact methods, along with the strong possibility of the mechanical properties changing
with strain rate. However, deformations around the edges are less confined, so in addition to
the solid fraction likely being lower than the centre, the edges will fail much easier by
propagation of sub-surface cracks. Therefore, impact testing is a more appropriate method to
assess tablet attrition/chipping due to the above two main reasons.
14
4. Conclusions
The breakage behaviour of Avicel PH102 tablets has been assessed using repeated single
impacts at fixed heights. The extent of breakage increases approximately linearly with
number of impacts, and the breakage propensity decreases as tablet solid fraction is
increased. The extent of impact breakage correlates well with the kinetic energy of the
impact. On this basis the propensity for breakage, represented by the lumped parameter
H/Kc2, has been determined using the model of Ghadiri and Zhang (2002). The Young’s
modulus, hardness and fracture toughness of the tablets were determined independently by
(quasistatic) microindentation, and the index (H/Kc2) calculated for comparison with impact
tests. Fracture toughness could not be measured reliably since generated cracks led to
complete failure of the tablets. The index H/Kc2 determined in this way did not correlate well
with the propensity for breakage, nor did applying the LEFM approach, i.e. Kc being
correlated with Young’s modulus. Tablet attrition and chipping occur at edges, where the
solid fraction is likely to be different from the internal regions (Sinka et al., 2003). This
feature together with deformation being less confined at the edges and its possible strain rate
sensitivity will make the quasi-static characterisation of tablet damage mechanics
challenging. Therefore impact testing and damage analysis by the use of Ghadiri and Zhang
(2002) model may provide a quicker and easier way to assess tablet impact damage, as it
better represents the dynamic mechanical properties.
15
The authors would like to thank Julian Klinglmayr for his contribution in generating some of
the impact breakage data as part of his MEng research project.
References
Ali, M., Bonakdar, T., Ghadiri, M., Tinke, A., 2015. Particle Breakage in a Scirocco
Disperser. Powder Technol. 285, 138–145. doi:10.1016/j.powtec.2015.06.048
Arndt, O.-R., Kleinebudde, P., 2017. Influence of binder properties on dry granules and
tablets. Powder Technol. doi:https://doi.org/10.1016/j.powtec.2017.04.054
Dave, V.S., Shahin, H.I., Youngren-Ortiz, S.R., Chougule, M.B., Haware, R. V, 2017.
Emerging technologies for the non-invasive characterization of physical-mechanical
properties of tablets. Int. J. Pharm. 532, 299–312.
doi:https://doi.org/10.1016/j.ijpharm.2017.09.009
European Pharmacopoeia, 7th ed, 2010. . European Directorate for the Quality of Medicines
and Healthcare, Strasbourg.
Fell, J.T., Newton, J.M., 1970. Determination of tablet strength by the diametral-compression
test. J. Pharm. Sci. 59, 688–691. doi:10.1002/jps.2600590523
Ghadiri, M., 2006. Hardness, Stiffness, and Toughness of Particles, in: Powder Technology
Handbook, Third Edition. CRC Press. doi:doi:10.1201/9781439831885.ch1.5
Ghadiri, M., Zhang, Z., 2002. Impact attrition of particulate solids. Part 1: A theoretical
model of chipping. Chem. Eng. Sci. 57, 3659–3669.
doi:10.1016/S0009-2509(02)00240-3
Gong, X., Sun, C.C., 2015. A new tablet brittleness index. Eur. J. Pharm. Biopharm. 93, 260–
266. doi:https://doi.org/10.1016/j.ejpb.2015.04.007
Laugier, M.T., 1987. New formula for indentation toughness in ceramics. J. Mater. Sci. Lett.
6, 355–356. doi:10.1007/BF01729352
16
Lawn, B.R., 1993. Fracture of Brittle Solids, 2nd ed. Cambridge University Press,
Cambridge, UK.
Mangal, H., Kirsolak, M., Kleinebudde, P., 2016. Roll compaction/dry granulation:
Suitability of different binders. Int. J. Pharm. 503, 213–219.
doi:10.1016/J.IJPHARM.2016.03.015
Pitt, K.G., Heasley, M.G., 2013. Determination of the tensile strength of elongated tablets.
Powder Technol. 238, 169–175.
Pitt, K.G., Newton, J.M., Richardson, R., Stanley, P., 1989. The Material Tensile Strength of
Convex-faced Aspirin Tablets. J. Pharm. Pharmacol. 41, 289–292.
doi:10.1111/j.2042-7158.1989.tb06458.x
Podczeck, F., 2012. Methods for the practical determination of the mechanical strength of
tablets—From empiricism to science. Int. J. Pharm. 436, 214–232.
doi:10.1016/j.ijpharm.2012.06.059
Ponton, C.B., Rawlings, R.D., 1989. Vickers indentation fracture toughness test Part 1
Review of literature and formulation of standardised indentation toughness equations.
Mater. Sci. Technol. 5, 865–872. doi:10.1179/mst.1989.5.9.865
Shang, C., Sinka, I.C., Jayaraman, B., Pan, J., 2013. Break force and tensile strength
relationships for curved faced tablets subject to diametrical compression. Int. J. Pharm.
442, 57–64. doi:https://doi.org/10.1016/j.ijpharm.2012.09.005
Sinka, I.C., Cunningham, J.C., Zavaliangos, A., 2003. The effect of wall friction in the
compaction of pharmaceutical tablets with curved faces: a validation study of the
Drucker–Prager Cap model. Powder Technol. 133, 33–43.
doi:http://dx.doi.org/10.1016/S0032-5910(03)00094-9
Sinka, I.C., Motazedian, F., Cocks, A.C.F., Pitt, K.G., 2009. The effect of processing
parameters on pharmaceutical tablet properties. Powder Technol. 189, 276–284.
17 doi:https://doi.org/10.1016/j.powtec.2008.04.020
Sinka, I.C., Pitt, K.G., Cocks, A.C.F., 2007. Chapter 22 The strength of pharmaceutical
tablets. pp. 941–970. doi:10.1016/S0167-3785(07)12025-X
Spinner, S., Knudsen, F.P., Stone, L., 1963. Elastic Constant-Porosity Relations for
Polycrystalline. J. Res. Natl. Bur. Stand. Eng. Instrum. 67C, 39–46.
Spriggs, R.M., 1986. Expression for Effect of Porosity on Elastic Modulus of Polycrystalline
Refractory Materials, Particularly Aluminum Oxide. Sci. Sinter. 18, 68–70.
doi:10.1111/j.1151-2916.1961.tb11671.x
Stilwell, N.A., Tabor, D., 1961. Elastic Recovery of Conical Indentations. Proc. Phys. Soc.
Lond. 78, 169–179.
Stricker, H., 1987. Physical Pharmacy, 3rd ed. Wissenschaftliche Verlagsgesellschaft,
Stuttgart.
Timoshenko, S., Goodier, J.N., 1969. Theory of elasticity, McGraw-Hill classic textbook
reissue series. McGraw-Hill.
Tye, C.K., Sun, C. (Calvin), Amidon, G.E., 2005. Evaluation of the effects of tableting speed
on the relationships between compaction pressure, tablet tensile strength, and tablet solid
fraction. J. Pharm. Sci. 94, 465–472. doi:10.1002/jps.20262
United States Pharmacopoeia/National Formulary (USP35/NF30), 2011. The United States
Pharmacopoeial Convention, Rockville, MD.
Vercruysse, J., Díaz, D.C., Peeters, E., Fonteyne, M., Delaet, U., Assche, I. Van, Beer, T. De,
Remon, J.P., Vervaet, C., 2012. Continuous twin screw granulation: Influence of process
variables on granule and tablet quality. Eur. J. Pharm. Biopharm. 82, 205–211.
doi:https://doi.org/10.1016/j.ejpb.2012.05.010
Webster, A.R., Abbé, N.J. Van, 1955. a Test for the Mechanical Strength of Compressed
Tablets. J. Pharm. Pharmacol. 7, 882–891. doi:10.1111/j.2042-7158.1955.tb12100.x
18
Yüregir, K.R., Ghadiri, M., Clift, R., 1986. Observations on impact attrition of granular
solids. Powder Technol. 49, 53–57. doi:10.1016/0032-5910(86)85004-5
Zhang, Z., Ghadiri, M., 2002. Impact attrition of particulate solids. Part 2: Experimental
work. Chem. Eng. Sci. 57, 3671–3686. doi:10.1016/S0009-2509(02)00241-5
Figure 1. Tablet impact test setup
(b)
19
Figure 2. Cumulative mass loss due to impact for Solid fractions (SF) of 0.65, 0.70,
0.75, 0.80 and 0.85 at impact velocities (a): 3.8 m/s; (b): 4.0 m/s; (c): 5.2 m/s; (d): 7.3 m/s
0 0.1 0.2 0.3 0.4 0.5 0.6 0.7 0.8 0.9
0 20 40 60
M a ss lo ss ( %)
Number of impacts
0.65 0.70 0.75 0.80 0.85 0 0.2 0.4 0.6 0.8 1 1.2
0 20 40 60
M a ss lo ss ( %)
Number of impacts
0.65 0.70 0.75 0.80 0.85 0 0.5 1 1.5 2 2.5
0 20 40 60
M a ss lo ss ( %)
Number of impacts
0.65 0.70 0.75 0.80 0.85 0 0.5 1 1.5 2 2.5 3 3.5 4 4.5
0 20 40 60
M a ss lo ss ( %)
Number of impacts
0.65 0.70 0.75 0.80 0.85
(c) (d)
(a)
20
Figure 3. Total mass loss after 50 impacts at different impact velocities
Figure 4. Impact breakage propensity of the tablets
0 0.5 1 1.5 2 2.5 3 3.5 4 4.5
0.6 0.65 0.7 0.75 0.8 0.85 0.9
M
ass l
oss af
te
r 50 im
p ac ts (% ) solid fraction 7.3 m/s 5.2 m/s 4.0 m/s 3.8 m/s 0 0.5 1 1.5 2 2.5 3 3.5 4 4.5
0 100 200 300 400 500 600 700
M
ass l
oss af
te
r 50 im
p
ac
ts
(%
)
DV2(J/m2) SF = 0.65
SF = 0.70 SF = 0.75 SF = 0.80 SF = 0.85
21
Figure 5. Indentation profiles on Avicel tablets of 0.85 solid fraction
[image:23.595.100.530.90.358.2]Figure 6. Hardness and Young’s modulus of Avicel tablets
Figure 7. Crack propagation at failure force 0 0.2 0.4 0.6 0.8 1 1.2
0 0.01 0.02 0.03 0.04 0.05
F or ce (N ) Depth (mm) 1 2 3 4 0 100 200 300 400 500 600 0 10 20 30 40 50 60 70 80
0.6 0.65 0.7 0.75 0.8 0.85 0.9
22
Figure 8. Failure force of the Avicel tablets as a function of solid packing density
Figure 9. Comparison of brittleness index and propensity for breakage
0 50 100 150 200 250 300
0.6 0.65 0.7 0.75 0.8 0.85 0.9
B re ak age F or ce (N ) Solid fraction 0 1 2 3 4 5 6 7 8 9 0 2 4 6 8 10 12 14 16 18
0.6 0.65 0.7 0.75 0.8 0.85 0.9
.H /K c 2 × 10 5 (m 2 /J) H /K c 2× 10 2(m 2/J) Solid fraction
failure method LEFM method impact method
23
Table 1. Tablet dimensions and density
Solid fraction Diameter
(mm)
Average thickness
(mm)
Average mass
(g)
Density
(kg/m3)
0.65
10
3.89 0.2896 947
0.70 3.55 0.2908 1042
0.75 3.34 0.2938 1121
0.80 3.16 0.2932 1181
0.85 2.95 0.292 1260
Table 2. Hardness and Young’s modulus of Avicel tablets
Property Solid fraction Average value Standard deviation Coefficient of variation (%)
Hardness
(MPa)
0.65 19.1 7.9 41.5
0.70 27.0 5.6 20.7
0.75 47.8 8.1 16.9
0.80 57.3 10.5 18.4
0.85 63.3 8.1 12.8
Young’s
modulus
(MPa)
0.65 215 49 23.0
0.70 258 22 8.4
0.75 351 31 8.7
0.80 392 53 13.5
0.85 463 32 6.9
Table 3. Fracture toughness and breakage propensity of Avicel tablets
Solid fraction 0.65 0.70 0.75 0.80 0.85
H (MPa) 19.1 27.0 47.8 57.3 63.3
E (MPa) 215 258 351 392 463
Kc– failure method (kPa.m1/2) 18.6 21.6 17.7 19.1 20.2
24
H/Kc2– failure method (m2/J) 5.52 × 10⁻² 5.77 × 10⁻² 1.53 × 10⁻² 1.58 × 10⁻¹ 1.55× 10⁻¹
H/Kc2– LEFM method (m2/J) 5.52 × 10⁻² 6.48 × 10⁻² 8.44 × 10⁻² 9.06 × 10⁻² 8.47 × 10⁻²
H/Kc2– impact method (m2/J) 8.29 × 10⁻⁵ 5.87 × 10⁻⁵ 4.24 × 10⁻⁵ 2.65 × 10⁻⁵ 2.43 × 10⁻⁵
*please note the uncertainty in the accuracy of these values, as detailed below