OOMMISSION OF THE EUROPEAN COMMUNITIES
REPORT FROM THE COMMISSION
COM(95) 38 final Brussels, 23.~2.1995
ON THE STATE OF THE SHIPBUILDING INDUSTRY
IN THE EUROPEAN UNION
Table
pf
contents
I. Introduction
II. General economic background
Ill. Shipping trends
IV. Fleet trends
v.
Situation in the shipbuilding industryVI. International aspects
VII. Internal policy
VIII. Employment
[image:2.516.14.481.49.743.2]I. INTRODUCDON
This report, issued pursuant to the Council Resolution of 19 September 1978, is aimed at providing an overview of the shipbuilding industry and market in 1993.
The report sets out the main features of the year, namely :.
•
•
•
a comparatively larger increase (+ 3,1 %) than in 1992 in the tonne-mile volume of seaborne trade, with a similar increase(+ 2,9 %} in world fleet tonnage;
continued steady growth in deliveries (in cgt) of new vessels, with an increase of
about 2 %; ,
a fairly marked revival (+ 64,7 %) in the demand for new vessels, and a significant increase (+ 10 %) in order book volume.
II. GENERAL ECONOMIC BACKGROUND
In 1993, world economic activity remained depressed, with world GDP increasing as in the preceding year by only 1 ,6 % in real terms. This was largely the result of a recession in the Community, which experienced a decline of 0,3% in GDP, contrasting with a moderate expansion in the rest of the world (+ 2,3 %). The differing European and world performances were essentially due to the recovery in the USA and to the substantial growth registered in the non-OECD countries, especially those of South-East Asia and Latin America. Japan and most of the other OECD countries, on the other hand, registered unsatisfactory growth figures.
The divergence in the GDP performances is mirrored in the trade figures. The combined imports of the rest of the world increased by more than 8 % in real terms, while EU imports from the rest of the world declined by about 3 %.
Economic recovery is currently under way in the Community. Buoyant exports and more dynamic investment are expected to produce
a
GDP expansion of 1 ,5 % in 1994 and 2,5 % in 1995. The main factors underlying the more upbeat growth outlook are a favourable international economic environment, a further decline in· short-term interest rates in the Community, a restoration of business and consumer confidence and benign . household saving behaviour.Output outside the Community is expected to accelerate further to above 3 % in 1994 and around 3,5 % in 1995. Economic activity should be expanding at a heatthy 3 % i.n
industrialized countries outside the EU and even faster in developing countries, particularly the dynamic Asian economies, China and Latin America. Output growth is also expected to pick up in a number of Central and Eastern European countries, but continued adjustment problems are ltkety to weigh down on economic activity in the former Soviet Union.
3-"'
In line with these relatively buoyant growth prospects, imports into non-EU countries are . expected to rise at a strong pace of some '8% (in volume terms) per year up to the end of 1995. The rapid expansion of world trade reflects the continuing strength of imports in North America, the dynamic Asian economies, China and Latin America. The growing trade of the Central and Eastern European countries (excluding the former USSR) reflects stronger integration with Western Europe. Overall, the expected growth of rion-EU markets for Community exports of goods should amount to some 7 % (in volume terms) in both 1994 and 1995.
Ill.
SHIPPING TRENDSSeaborne trade has been on the increase since 1985.
In tonne-miles the increase was 3,1 % on the 1992 figure, giving a total of 18.800 billion tonne-miles.
WORLD SEABORNE TRADE (1973 ~ 1993)
18
4500
Cll
~' 16
-::e ~ = ' Ill
"'-l §
~
- 14Cll
c "'-l
4000 ~
~
e 0
!:-3500 12
10 3000
1973 1975 1977 1979 1981 1983 1985 '1987 1989 1991 1993 Est.
1974 1976 1978 1980 1982 1984 '1986 1988 1990 1992
- - tonne-miles - - tonnes ·
Est. : Estimates
Source : FEARNLEYS REVIEW
Overall, liquid cargo increased by 5,1 %; 4,0 % in oil and 9,6 % in petroleum products.
The trend for dry cargo goods was not so uniform : on the one hand, iron ore increased bY,2,3 %, and, on the other hand, coal and grain fell by 2,3% and 4,7% respectively.
Concerning other shipments for the year 1993, there was a growth of 4,1 %, which was 1 % greater than that of 1992.
As regards volume, the trend in seaborne trade continued in spite of a smaller increase (2,4 %) and reached 4,318 billion tonnes at the end of 1993 compared to the 4,215 billion tonnes of the previous year.
WORLD SEABORNE TRADE (1973- 1993)
1973 1975 1977 1979 1981 1983 1985 1987 1989 1991 1993 Est 1974 1976 1978 1980 1982 1984 1986 1988 1990 1992
- Oil and Oil Products
D
Other CargoEst. : Estimates
Source: FEARNLEYS REVIEW
To a certain extent freight rates for petroleum products recovered from the poor performance in 1992. There were gains of about 40 % for VLCCs, 65 % for Suezmax and 60 % for Aframax tankers.
Dry
cargo ships had freight rates which, on average, were higher than those of the previous year. Nevertheless, after the favourable trend during the first half year, sluggish market activity led to a considerable reduction in rates towards the end of the year.-IV. FlEETTRENDS
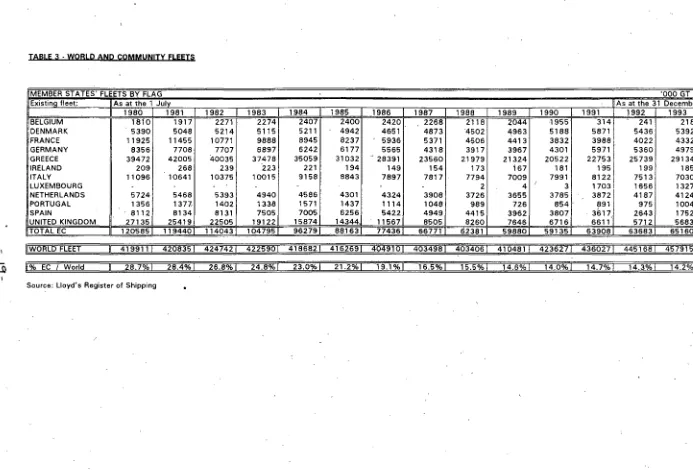
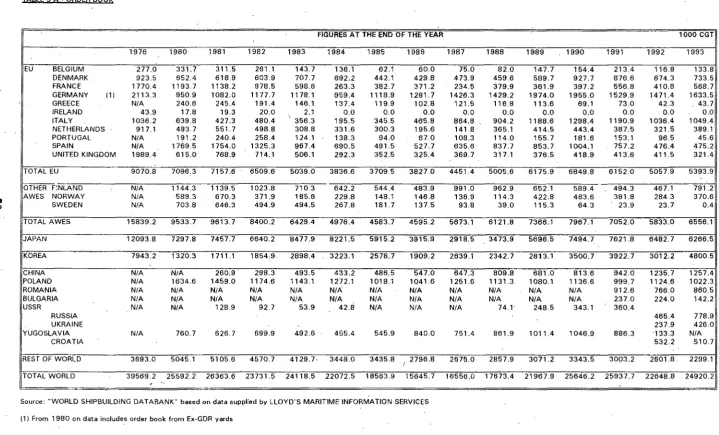
At the end of 1993 the world fleet was 458 million gt, which represents an increase of 2,9 % on the 1992 figure and confirms the upward trend started in 1989.
This rise ·is largely due to new tankers and. dry-cargo carriers completed in the course of the year and to the still low level of tonnage scrapped (1 0,2 million gt in 1993 and
10,7 million gt in 1992).
-TONNAGE WITHDRAWN (19a0 ·1992)
mo 1981 1982 1983 198~ 19BS 1986. 1987 1988 1989 1990 1991 1992 1993
-LAID UP ~FOR STORAGE 6 BROKEN UP
Tonnage LAID UP : Situation as at mid-December; Tonnage USED FOR STORAGE : Situation as at the end of December Tonnage BROKEN UP: Situation as at the end of the year
Sources : Institute of Shipping Economics- Brensen; FEARNLEYS REVIEW- Oslo
The ave~age age of the world fleet rose from 17 years in 1992 to 18 years in 1993.
In gross tonnage 18,7% of the fleet was at least 20 years old; 45,1 % of ships were between 1 0 and 19 years _alp and 17,4 % between 5 and 1 0 years old.
The balance between supply and demand for tonnage continued to show signs of slight improvement which was clear in the case of tankers but to a much lesser extent in the case of dry-cargo carriers.
In spite of this expansion the Community's share of the world fleet declined once again, albeit slightly, to 14,2 % at the end of the year. -: ·
WORLD AND EUROPEAN UNION JILEETS (1980 • 1113)
!!00
400
300
....
t
c200
...
100
19110 19111 19112 1983 19114 1911, 1986 19117 1918 I~ 1990 1991 1992 1993
Source : LLOYD'S REGISTER OF SHIPPING
,·
·,·
- E U -+-WORLD
V. SITUATION IN THE SHIPBUILDING INDUSTRY
A) General overview
Production and new orders
..
..
;:;::
~ :2
a
~
...
..
..
20M.
~
::>
LLl
I~
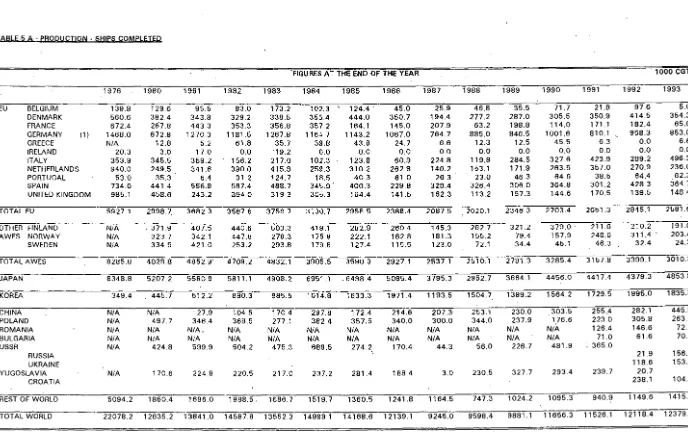
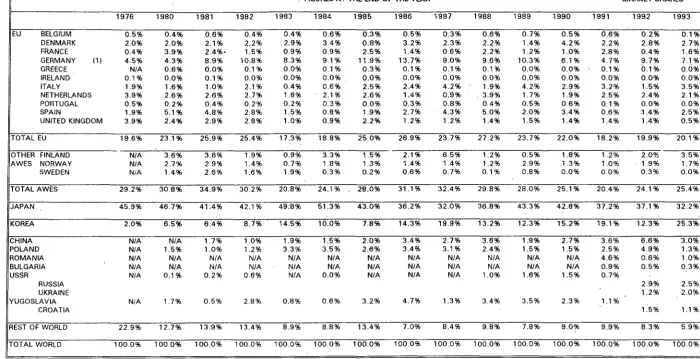
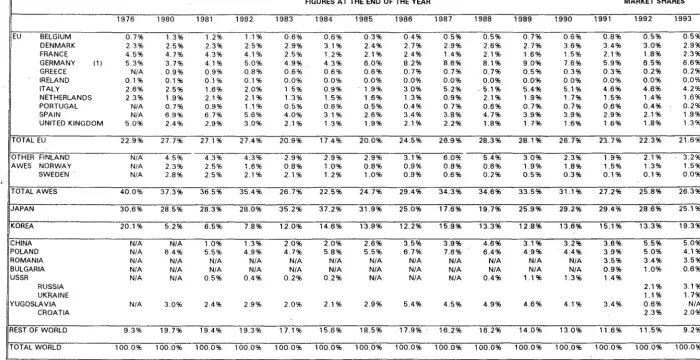
Whilst remaining higher than 12 million cgt, world production increased by only 2,2 % on the 1992 figure. This reflects, among other things, the fact that most shipyards are tending to consolidate the position they hold in the world market whilst continuing in their drive for investment, especially in technology aimed at strengthening and improving their productivity and international competitiveness (particular note should be taken of Japanese shipyards).
-7-PRODUCTION· SHIPS COMPLETED (1976 -1993)
~
r---.
Wo1lLI20
15
1976 1980 1981 1982 1983 1984 1985 1986 1987 1988 1989 1990 1991 1992 1993
---- EU --Japan _._Korea --World
Source: 'WORLD SHIPBUILDING DATABANK' based on data supplied by LLOYD'S MARITIME INFORMATION
SERVICES _
Note : From 1980 on data for the EU includes production from Ex-GDR yards.
As far as new orders are concerned, however, there was a definite upturn ( + 64,7 %) in 1993, which contrasts to the decline in 1991 and 1992 (16, 7 % and 26% respectively) and the sluggishness of 1990. The increase in new orders was stimulated by a series of factors such as the constant ageing of the fleet (average 18 years old), short-term prospects for a general economic upturn, more of a balance between supply and demand in shipping and, due to falling prices, a certain propensity on the part of shipowners to place orders; the fall in orders in 1992 led to a general price reduction of about 1 0 %.
NEW ORDERS (1976 ·1993)
20
WorioJ
1$
1- .~ 0
~ 10
u
5
1m 1~ 1~ 1m 1m 1 - 1m 1~ 1m 1~ 1 - 1m 1m 1m 1m
..,._ EU --Japan ... Korea --World
Source: 'WORLD SHIPBUILDING DATABANK' based on data supplied by LLOYD'S MARITIME INFORMATION SERVICES
This increase in new orders focused particularly on the tonnage of bulk and goods carriers. The demand for tankers, whi!st being maintained, did not increase significantly. Shipbuilders' marked propensity for good carriers in 1992 could be partly explained by the fact that shipyards in the Far East - the "price leaders" for these types of ships - pursued a particularly agressive price policy at the. beginning of the year.
Order books
Due to the increase in orders for new ships the world order book volume rose by almost 10 %. This tonnage should ensure, especially with respect to large shipyards, a work load equivalent to an average of 2 years . of the production recorded in the year under consideration : more precisely, for Korea 2,6, the EU 2,1 and Japan 1 ,3. These figures particularly highlight Korea's increasingly important role and position. in the world. During 1993 Korea's market share, usually between about 13 and 15 %, exceeded 19 %. The Community experienced a slight increase (- 0,7 points) but did not suffer to the same extent as Japan (- 3,5 points) from the recent aggressive onslaught from the Korean .shipyards.
1- c
c .!1
u 1
ORDER BOOK (1976 -1993)
1916 1980 1911 1982 1983 1914 1915 1986 1987 1988 1989 1990 1991 1992 1993
- EU --+-Japan _._.Korea --World
Source: "WORLD SHIPBUILDING DATABANK" based on data supplied by LLOYD'S MARITIME INFORMATION SERVICES
Note : From 1980 on data for the EU includes order book from Ex-GDR yards.
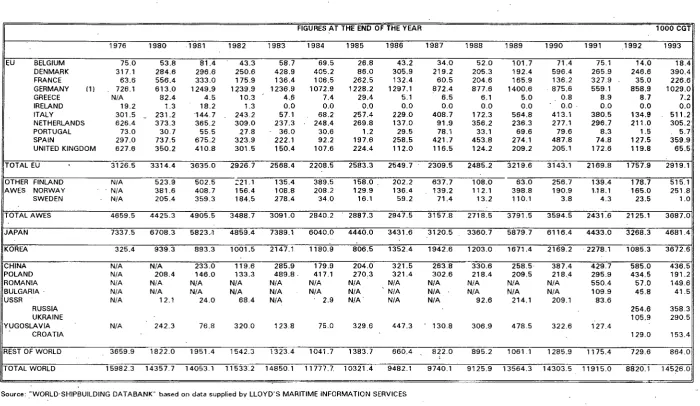
Shipbuilding prices
Available reference prices concerning Japanese and Korean shipyards - given in US dollars - above all reveal a continued downward trend for tankers (between 9 % and 10% as opposed to the 11-13% of 1992).
-9-Cargo ships - the prices of which significantly decreased in 1992 and during the first months of 1993 - registered a slight improvement overall (between 3 and 6 % in terms of tonnage) on the previous year.
It is clear that Korea has been the "price leader" for almost all tankers and bulk carriers.
CONTRACT PRICES FOR ORDERS OF NEW VESSELS (1980 -1993)
90
80
70
ISO
...
e lO0
"'
=·::J -~ 40
JO
20 10 0
1980 1981 1982 198J 1984 19U 1986 1987 1988 1989 1990. 1991 1992 1993 - - - - Tanker JO ()(X) DWT ...,_ Tanker(OoubleHuli)40000DWT ____.Bulk 120CXX>DWT
- - Ro-Ro 5000DWT - - U'G 7' 000 n\1
Source : FEARNLEYS REVIEW
Note :'Japanese and Korean yards are used as basis.
B) · Situation in the Community. Japan and Korea
The Community
In the general context of the worldwide situation in the sector, the position in the Community industry was as follows :
a reduction of 8,9% in tonnage delivered .. This tonnage nevertheless ensured a work load for all shipyards within the ·Union of about 80 % in relation to production capacity in these shipyards (3,0 million cgt according to the OECD);
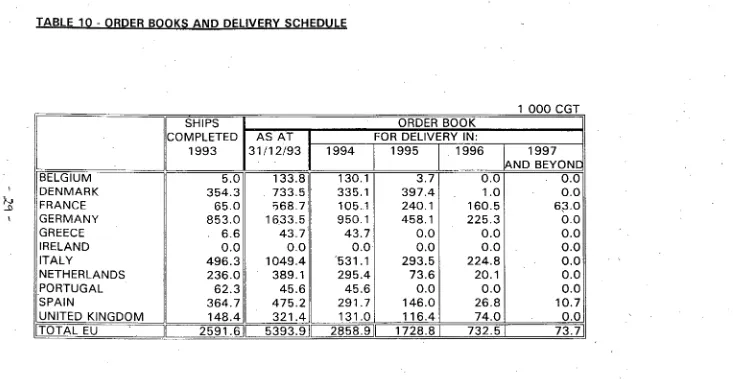
an improvement in the tonnage registered in the order books of 6,6 %, against a world average of 10 %, a reduction of 3,3 % for Japan and the South Korean record of 59,4 %. Of this tonnage 53 %, which amounts to 5,4 million cgt, should be delivered in 1994, 32,1 % in 1995 and the remainder in 1996 and 1997 (see table nr. 10).
· The market share of shipyards in the Union shows a slight reduction, particularly in production, but remains clearly above 20% if one takes into account performance as a whofe (new orders, order books).
Japan
This country seems to have suffered particularly badly from the effects of the constant increase in the value of its currency in relation to the US dollar and the particularly dynamic policy implemented by the Korean shipyards. To guard against the consequences of the increased value of the yen - which since the introduction of the floating exchange system in 1973 has more than tripled in value in comparison to the US dollar-, the shipyards in this country plan to turn increasingly to external markets - notably Korea and Europe - to buy steel and necessary equipment in an attempt to reduce production costs as much· as possible.
In 1993 Japan saw its order books fall by 3,3 % on the previous year : it intends to maintain its position as "leader" at all cost and is increasingly basing its drive for success on finding the best technological use of its capacities. Its international focus is prompting it, among other things, to diversify its production towards openings for ships of greater added value with the ultimate aim of finding niches in which it can be a formidable competitor for the European shipyards.
South Korea
After its rather disappointing performance during 1992, the Korean industry, in a particularly aggressive way, has undoubtedly dominated the spectacular revival in new orders. It was responsible for almost 50 % of the increase in the tonnage ordered worldwide (between 1992 and 1993) and recorded an increase of 238,4 %
in its orders. ·
The shipyards in this country have taken full advantage of changes in currency parities (the increase in the value of the yen and the fall in the value of the won against the US dollar) to become the international "price leaders" particularly with regard to tankers and bulk carriers. They have not, however, neglected other types of more specialized ships such as containers and car carriers.
Taking world orders as a whole, between 1992 and 1993, this country's share of the market more than doubled (12,3% and 25,3% respectively).
1.1-After the expiry on 31 December 1993 of the national rationalization plan, the Koreans envisage a vast expansion in their production capacities which would allow them - as it did about fifteen years ago - to have almost as much production potential as Japan does at present. In several forum~ {notably the. OECD) the Union and other large producer countries have emphasized the unrealistic character . ~ of such a "target-oriented" policy and the dangers of a new imbalance between
supply and demand which can only lead to a new price war.
V!. iNTIERNATUONAL ASPECTS
Parallel to the internal policies, international efforts have been deployed since 1989 within the OECD framework to .reach a multilateral agreement between the world's major shipbuilding nations on a rapid phasing-out of all direct and indirect public support measures to shipbuilding, ship conversion and ship repair and other obstacles to re-establishing normal and fair competition conditions in the sector. The Commission was given its negotia1ing mandate by the Council in 1990, and agreement was reached on 17 July 1994, meeting the main objectives of the European Union. The Agreement will entry into force on 1 January 1996, after signature, which is expected before the end of 1995, and ratification by all participating countries. The EU has signed the Agreement on 21 Decem.ber 1994 after political approval by the Council. Other shipbuilding nations are invited to participate in this Agreement. ·
This Agreement aims to eliminate all existing measures or practices which constitute obstacles to normal competitive conditions, namely direct and indirect support, anti-competitive regulations and unfair practices. Home credit schemes were aligned with the terms and conditions of the Understanding on Export Credits and aid to Research and Development is subject to a specific discipline. Moreover, the Agreement establishes a new anti-dumping instrument, specific to ship transactions, i.e. the Injurious Pricing Instrument. Sanctions are provided for against shipbuilders entering in such practices.
VII. INTERNAL POLICY
A) Maritime Industries forum
Launched in 1991, the Maritime Industries Forum has now achieved 3 years of · intensive, constructive and valuable dialogue between all parties concerned.
· The Forum brings together all maritime industries (shipping, shipbuilding, marine equipment, ports, fisheries and related industries and services), trade unions, research institutes, Member States, the European Parliament .and the Economic and Social Committee, representatives of Member States, 'the Nordic EFT A countries and the European Commission.
After having presented reports to the Commission in 1992 and 1993 at the plenary sessions in Genoa and Athens, the Forum cor:ttinued its work focusing on :
Short-Sea Shipping; Marine Resources; Ship Financing;
Electronic Data Interchange.
On the basis of the work of panels created with respect to these different issues, the Forum presented a further report to the Commission at its plenary session on 20-21 June 1994 in Rotterdam.
At this meeting, it was decided to continue the work on these issues and to hold another plenary session in mid-1995.
The Commission participated actively in the dialogue with the Forum. After having given a political evaluation on the Athens report (1),the Commission presented at the Rotterdam meeting a progress report on actions and initiatives taken relating to recommendations made by the Forum in the Genoa and Athens reports in order to create a basis for the continuation of a dynamic dialogue.
( 1) COM(93)526 final of 04.11.1993 : "Towards the implementation of a comprehensive approach for the maritime industries : the first tangible results'.
13-B) Research and development
The 4th Framework Programme of Community activities in the field of research and technological development and demonstration (1994-1998) was adopted by the European Parliament and the Council on 26 April 1994 (2). Proposals for Council Decisions concerning the specific programmes implementing the 4th Framework Programme were submitted by the Commission on 30 March 1994 (3). The Council at its meeting of 27 ·June 1994 adopted the specific programmes on lndustrfal and Materials Technologies and on Communication Jechnologies. The remaining 18 specific programmes have been adopted at the end of 1994.
As compared wjth earlier Framework Programmes, many innovations have been introduced (transport, telematics, policy and optimisation strategies for short-sea shipping and inland waterways, technologies for surface transport means).
In parallel with the formulation of the 4th Framework Programme, a series of interface meetings with representatives of the maritime industries were organized by the Commission. Valuable contributions, horizontally across the themes of the 4th Framework Programme, were presented by industry, notably shipbuilders and the marine resources panel of the Maritime Industries Forum ..
C) Technical harmonization
A Directive on the approximation of the laws, regulations and. administrative provisions of the Member States relating to recreational craft was adopted by the European Parliament and the Council on 16 June 1994 (4).
VIII. EMPLOYMENT
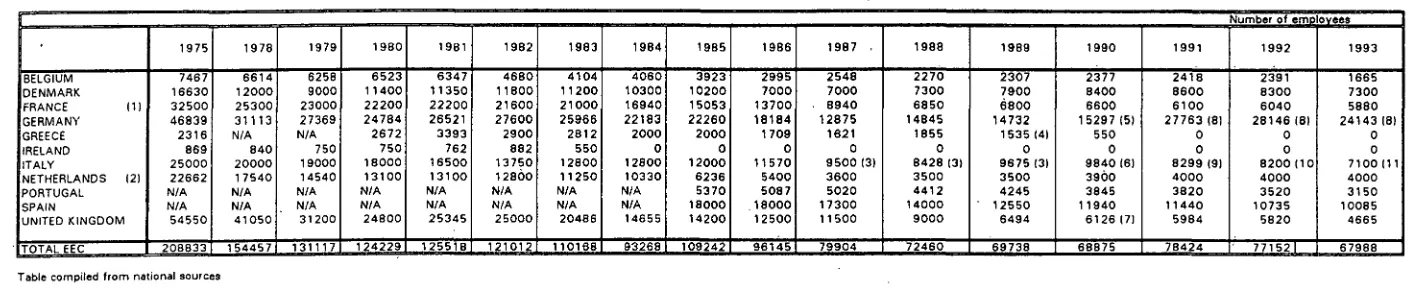
During 1993 employment in shipbuilding in the Community declined overall by 11 %.
This figure applies to all Member States except the Netherlands.
The United Kingdom was most affected by the reduction (- 20 %), followed by Germany (- 14 %), Italy (-13 %), Denmark (-12 %) and Portugal (-11 %). As far as Germany is concerned the reduction in the number of jobs in the new "Lander" (former GDR) is 28 %
whilst the old "Lander" have a reduction of only 4 %.
Finally, the RENAVAL Community programme of the European Regional Development Fund, which disposed of a budget of 300 MECU, came to an end in 1993. Launched in 1988 by the Council (5), the programme was successful in assisting with the conversion of 26 regions in 9 Member States affected by the restructuring of the shipbuilding industry .. By developing new economic activities, RENAVAL has contributed in particular to the creation of alternative employment opportunities in these regions.
EMPLOYMENT IN THE CONSTRUCTION OF NEW VESSELS IN THE EUROPEAN UNION
"'
.,
>-o"'
!1
.... ~0
.a
250 , - - - ,
ISO
~ ,_ 100
~
so
1975 1978 1979 t9ao 1981 1982 1m 1984 1985 1986 1987 1988 1989 t99o 1991 tm 1m
Graphic compiled from national sources
ANNEX
, TABLE 1 - WORLD SEABORNE TRADE AND CARGO FLEET
D
OIL AND OIL PRODUCTS . OTHER CARGO TOTAL=
Seaborne trade Fleet(*) Seaborne trade Fleet(*) Seaborne trade Fleet("')
'000 million index . million index '000 million index million 1. index '000 million index million index
tonne-miles '73=100 DWT '73=100 tonne-miles '73=100 DWT '73=100 tonne-miles '73 = 100 DWT '73= 100
1973 10217 100 234.3 100 5187 100 20,5.6 100 15404 100 . 439.9 100 1974 10621 104 275.4 118 5766 111 218.5 106 16387 106. 493.9 112 1975 '9730 95 31.3.0 134 5666 109 230.7 112 15396 100 543.7 124 1976 11149 109 343.9 147 5929 114 247.4 120 17078 111 591.3 134 1977 11403 112 356.1 152 6086 117 268.5 131 17489 114 624.6 142 1978 10546 103 353.0 151 6407 124 279.7 136 16953 110 632.7 144 1979 1()497 103 350.9 150 7058 136 287.0 140 17555 114 637.9 145 1980 9239 90 348.4 149 7415 143 292.9 142 16654 108 641.3 146 1981 8193 80 342.9 146 7523 145 305.8 149 15716 102 648.7 147
1982 6282 61 322.5 138 7269 140 320.5 156 13551 88 643.0 146
-+>
1983 5558 54 301.4 129 7078 136 331.0 161 12636 82 632.4 1441984 5648 55 285.1 122 7836 151 341.1 166 13484 88 626.2 142
1985 5157 50 257.1 110 7929 153 348.2 169 13086 85 605.3 138
1986 5905 58 249.7 107 7951 153 345.5 168 13856 90 595.2 135
1987 6016 59 245.8 105 8284 160 342 .. 2 166 14300 93 588.0 134
1988 6510 64 248.8 106 8789 169 345.0 168 15299 99 593.8 135
1989 7276 71 255.6 109 9109 176 353.6 172 16385 106 609.2 138
1990 7821 77 262.2 112 9300 179 365.5 178 17121 111 627:7 143
1991 8287 81 270.9 116 9586 185 372.0 181 17873 116 642.9 146
1992 8590 84 276.1 118 9638 186 376.3 183 18228 118 652.4 148
1993 Est. 9025 88 279.8 119 9775 188 382.1 186 1'8800 122 661.9 150
Est.: Estimates
( *) As at the end of the year
!ABliE 2 -TONNAGE WITHDRAWN
TONNAGE LAID UP
TONNAGE BROKEN UP
TONNAGE FOR STORAGE
as at mid
number
million
million
during
number
million
million.
as at the end
million
December · of ships
GT
DWT
of shiR_s
GT
DWT
of December
DWT
1980
237
5.1
8.9
1980
887
9.2
15.9
1980
12.9
1981
297
11.3
20.9
1981
824
9.8
17.5
1981
20.8
1982
1247
38.8
73.8
1982
1081
18.1
32.2
1982
13.1
1983
1409
40.9
77.6
1983
1323
20.3
36.9
1983
10.6
1984
1060
31.9
59.6
1984
1500
19.7
34.8
1984
10.5
1985
884
25.9
48.6
1985
1722
26.3
47.8
1985
9.6
1986
633
12.2
21.5
1986
1576
20.9
36.2
1986
14.6
1987
390
8.5
14.6
1987
1094
12.9
22.0
1987
11.9
1988
276
4.5
7.0
1988
812
6.1
9.9
1988
10.4
fX,
1989
200
2.6
4.0
1989
512
4.0
6.6
1989
7.9
1990
164
2.4
3.9
1990
479
3.3
5.3
1990
12.4
1991
191
2.7
4.3
1991
445
5.0
8.4
1991
6.1
1992
273
5.3
9.4
1992
603
10.7
19.8
1992
5.2
1993
227
3.6 .
5.8
1993
547
10.2
19.3
1993
5.9
.
..
TABLE 3 -WORLD ANp COMMUNITY FLEETS
!MEMBER STATES' FLEETS BY FLAG '000 GT
Existinq fleet: As at the 1 July As at the 31 Decembe
1980 1981 1982 1983 1984 1985 1986 1987 1988 1989 1990 1991 1992 1993 BELGIUM 1810 1917 2271 2274 2407 2400 2420 2268 2118 2044 1955 314 241 218 DENMARK 5390 5048 5214 5115 5211 4942 4651 4873 "4502 4963 5188 5871 5436 5392 FRANCE 11925 11455 10771 9888 8945 8237 . 5936 5371 4506 4413 3832 39881 4022 4332 GERMANY 8356 7708 7707 6897 6242 6177 5565 4318 3917 3967 4301 5971 5360 4979 GREECE 39472 42005 40035 37478 35059 31032 - 28391 23560 21979 21324 20522
227531
25739 29134IRELAND 209 268 239 .223 221 194 149 154 173 i67 181 195 199 185:
ITALY 11096 10641 10375 10015 9158 8843 7897 7817 7794 7009 7991 8122 7513 7030
LUXEMBOURG - 2 4 I 3 1703 1656 1327
NETHERLANDS 5724 5468 5393 4940 4586 4301 4324 3908 3726 3655 3785 3872 4187 4124 PORTUGAL 1356 1377. 1402 1338 1571 1437 1114 1048 989 726 854 .. 89l 975 1004 SPAIN 8112 8134 8131 7505 7005 6256 5422 4949 4415 3962 3807 . 3f>l7 2643 1752 UNITED KINGDOM 27135 25419 22505 19122 15874 14344 11567 8505 8260 7646 6716 6611 5712 5683 TOTALEC 120585 119440 114043 104795 96279 88163 77436 66771 62381 59880 59135 63908 63683 65160
!WORLD FLEET II 4199111 4208351 4247421 4225901 4186821 4162691 4049101 4034981 4034061 410481 1 4236271 4360271 4451681 4579151
]) % EC I World 24. .5% 14.6% 14.0 14.3% 14.2°/o"
[image:19.761.46.739.30.500.2]TABLE 4 - CONTRACT PRICES FOR ORDERS OF NEW vESSELS
L TYPE SIZE ~ 1980 I 1981 I 1982 I 1983 I 1984 I 1985 . 1 1986 I 1987 I 1988 I 1989 I 1990 I 1991 I 1992 I 1993 TANKER 30 000 DWT 26.0 25.0 17.0 16.0 14.5 13.0 14.0 20.0 27.0 31.0 30.0 30.5 27.0 28.0 TANKER 80 000 DWT 34.5 38.0 24.0 23.0 21.0 18.5 21.0 29.0 38.0 43.0 44.0 44.5 40.0
TANKER 130 000 DW 45.0 51.0 32.5 31.5 29.0 25.0 26.5 34.0 46.0 54.0 55.0 55.5 49.5 TANKER 250 000 DW 63.0 72.5 50.5 48.5 44.0 37.0 42.5 54.0 73.0 82.0 86.0 90.0 85.0 TANKER 400 000 DW 85.0 90.0 61.0 57.0 51.0 44.0 50.5 60.0 88.0 101.0 120.0 125.0 119.0
TANKER (Double Hull) 40 000 DWT 36.0 37.0 33.0 31.0
TANKER (Double Hull) 95 000 DWT 51.0 52.0 47.0 44.0
TANKER (Double Hull) 130 OOODWI 68.0 70.0 62.0 56.0
TANKER (Douple Hull1280 OOO.DW 110.0 115.0 100.0 90.0
OBO 96 000 DWT 47.0 44.0 30.0 28.0 26.0 22.5 25.5 32.0 44.0 55.0 62.0 64.5 56.0 52.0 BULK CARRIER 27 000 DWT 20.0 19.0 13.0 12.0 11.0 10.0 11.5 14.0 20.0 22.5 21.5 22.0 20.0 20.0 BULK CARRIER 38 ooo DWT 14.3 13.7 13.5 11.3 12.7 16.2 22.3 25.0 24.8 25.3 23.5 25.0 BULK CARRIER 60 000 DWT 28.5 27.5 18.0 17.0 15.5 14.0 15.0 20.5 27.0 30.0 31.5 32.0 28.0 29.0 BULK CARRIER 120 000 DW 44.0 42.0 .26.0 25.0 24.0 20.5 23.0 30.0 39.0 45.0 46.0 50.0 44.0 45.0 RO-RO 5 000 DWT 16.0 20.0 15.0 12.0 10.0 9:o 10.0 13.0 16.0 19.0 21.0 22.0 19.0 19.0 LNG CARRIER 125 000 m3 150.0 175.0 150.0 150.0 130.0 130.0 120.0 145.0 175.0 220.0 260.0 290.0 260.0 240.0 LPG CARRIER 3 000 m3 12y5 12.0 10.0 9.0 8.5 8.5 8.5 9.0 13.0 16.0 16.0 16.0 15.0 15.0 LPG CARRIER 12 000 m3 28.0 30.0 27.0 27.0 21.0 21.0 21.0 25.0 30.0 37.0 43.0 45.0 38.0 38.0
LPG CA~RIER 24 000 m3 34.5 37.0 33.0 31.0 27.0 26.0 26.0 27.0 39.0 46.0 52.0 55.0 48.0 48.0
LPG CARRIER __ 15 000 m3 75,9 ____IQ_.O 5~0 - 50.0 _A_!LQ 42.5 _47.5 -~'- 61,Q ______2j .0 80.0 85.0 _ _____l§J) - 75.0
~
Source: FEARNLEYS REVIEWTABLE 5 A - PRODUCTION - SHIPS COMpLETED
! FIGURES AT THE END OF THE YEAR 1000 CGT
1976 1980 1981 1982 1983 1984 1985 1986 1987 1988 1989 1990 1991 1992 1993
EU BELGIUM 139.8 129.6 95.5 83.0 173.2 102.3 124.4. 45.0 25.9 46.8 35.5 71.7 21.8 97.6 5.0
DENMARK 560.6 382.4 343.8 329.2 338.5 355.4 444.0 350.7 194.4 277.2 287.0 305.5 350.9 414.5 354.3
FRANCE 672.4 267.8 443.3 353.3 .356.8 357.2 164.1 145.0 207.9 63.2 198.8 114.0 171.1 182.4 65.0
GERMANY (1) 1468.0 672.8 1270.3 1181.5 1267.8 1164.7 1143.2 1067.0 764.7 885.0 846.5 1001.6 810.1 958.3 853.0
GREECE N/A 12.8 5.2 61.8 35.7 39.8 43.8 24.7 6.6 12.3 12.5 45.5 6.3 0.0 6.6
IRELAND 20.3 3.0 17.0 0.0 '19.2 0.0 0.0 0.0 0.0 0.0 0.0 0.0 0.0 0.0 0.0
ITALY 353.9 345.5 359.2 156.2 217.0 182.3 123.8 60.9 224.8 119.9 284.5 327.6 423.9 289.2 496.3
NETHERLANDS 940.0 249.5 341.6 390.0 415.8 259.3 310.2 262.8 146.2 153.1 171.9 263.5 357.0 270.9 236.0
PORTUGAL 53.0 35.3 6.4 31.2 124.7 18.5 40.3 61.0 . 26.3 23.0 46.3 64.6 38.5 64.4 62.3
SPAIN 734.0 441.4 556.8 587.4 488.7 345.9. 400.3 229.8 328.4 326.4 306.0 364.8 301.2 428.3 364.7
UNITED KINGDOM 985.1 458.6 243.2 394.0 . 319.3 305.3 164.4 141.5 162.3 113.2 157.3 ·144.6 170.5 139.5 148.4
TOTAL EU 5927.1 2998.7, 3682.3 3567.6 3756.7 3130.7 2958.5 2388.4 2087.5 2020.1 2346.3 2703.4 2651.3 2845.1 2591.6
'
OTHER FINLAND N/A . 371.9 407.5 440.6 503.3 419.1 282.9 260.4 145.3 262.7 321.2 379.0 ,. 211.6 2:0.2 191.0
AWES NORWAY N/A 323.7 342.1 447.8 278.3 175.9 222.1 162.8 181.3 155.2 79.4 157.9 248.6 311.4 ' 203.4
SWEDEN N/A 334.5 421.0 253.2 293.8 179.8 127.4 115.5 123.0 72.1 34.4 45.1 46.3 32.4 24.3
~
TOTAL AWES 8285.8 4028.8 4852.9' 4 709.2 4832 .. 1 3905.5 3590.9 2927.1 2537.1 2510.1 2781.3 3285.4 3157.8 3399.1 3010.3
JAPAN 8348.8 5207.2 5580.9 5811.1 4908.2 6951.1 . 6498.4 5085.4 3795.3 2952.7 3664.1 4456.0 4417.4 4379.3 4853.8
KOREA 349.4 445.7 512.2 880.3 985.5 1014.9 1633.3 1971.4 1193.5 1504.7 1389.2 1564.2 1729.5 1995.0 1835.3
CHINA N/A N/A 27.9 104.5 170.4 297.8 172.4 214.6 207.3 253.1 230.0 303.5 255 .. 4 282.1 445.9
POLAND N/A 497.7 346.4 369.5 277.1 382.4 357.5 340.0 300.0 344.0 237.9 176.6 223.0 305.8 263.5
ROMANIA N/A N/A N/A. N/A N/A N/A N/A N/A N/A N/A N/A N/A 126.4 146.6 72.1
BULGARIA N/A N/A N/A N/A N/A N/A N/A N/A N/A N/A N/A N/A 71.0 61.6 70.6
USSR N/A 424.8 599.9 504.2 475.3 689.5 274.2\ 170.4 44.3 56,0 226.7 481.9 ; 365.0
RUSSIA 21.9 156.0
UKRAINE 118.6 153.0
YUGOSLAVIA N/A 170.6 224.8 220.5 217.0 237.2 281.4 188.4 3.0 230.5 327.7 293.4 239.7 20.7
CROATIA 238.1 104.0
REST OF WORLD 5094.2 1860.4 1696.0 1988.5. 1686.7 1519.7 1360.5 1241.8 1164.5 747.3 1024.2 1095.3 940.9 1149.6 1415.2
TOTAL WORLD 22078.2 12635.2 13841.0 14587.8 13552.3 14998.1 14168.6 12139.1 9245.0 8598.4 9881.1 11656.3 11526.1 12118.4 12379.7
Source: "WORLD SHIPBUILDING.DATABANK" based on data supplied by LLOYD'S MARITIME INFORMATION SERVICES·
[image:21.767.46.734.31.463.2]BRJ.E .. ~.JL: .. ffiQ.D_u_cno_!!..:...f"ilile8_<._Q~~~;.r::IF.Q.
,,.
li
;87·':- 1~80 1981 1982 1e33f-K;li('!}~S [:{(fi-fE f:NQ. OF TMf: Y'=/'.R
---·-l
MARtU:T SHAP.ES1984 19P.5 1986 19R7 1983 1989 1990 1991 1992 1993
l
lru ___
BELGIUM G.Fl9', 1.0% 0.7% ·a.6% . ! .3% 0.7% 0.8% 0.4% 0.3% 0.5% OA% 0.6% 0.2% 0.8% 0.0% DENMARK :1.5% 3.0% 2.5% 2.3% 2.5% 2.4-% 3.1% 2.9% 2.1% 3.2% 2.9% 2.6% 3.0% 3.4% 2.9% 'I FRANCE 3.0% 2.1% 3.2% 2.4% 2.6% 2.4% 1.2% 1.2% 2.2% 0.7% 2.0')1, 1.0% 1.5% 1.5% 0.5%II
GERMANY !11 fl.6% 5.3% 9.2% 8.1% 9.4% 7.8% 8.1% 8.8% 8.3% 10.3% 8.6% El.R% 7.0% 7.8% 5.9% GREECE N//1. 0.1% 0.0% 0.4% 0.3% 0.3% 0.3% 0.2% 0.1% 0.1% 0.1% 0.4% 0.1% 0.0% O.i%
I IRELA.ND 0.1 <r, 0.0% 0.;% 0.0')1. \).1% 0.0% 0.0% 0.0% 0.0% 0.0% 0.0% 0.0% 0.0% 0.0% 0.0%
II !TALY 1.6% 2.7% 2.6%- 1.1% 1.6% 1.2% 0.9% 0.5% 2.4% 1.4% 2.9% 2.8% 3.7% 2.4% 4.0%
I, NETHERLANDS 4.3% 2.0% /..5% 2.7% 3.1% i.7~>!. 2.2% 2.2% 1.6% 1.8% 1.7% 2,3% 3.1% 2.2% 1.9% II PORTUGAL C.2% 0.3% 0.0% 0.2% 0.9% 0.1
'*'
0.3% 0.5% 0.3% 0.3% 0.5% 0.5% 0.3% 0.5% 0.5%I
f'DAIN 3.3% 3.5% ll..O% 4.0% 2.3"1, 2.3% 2.8% U~% 3.6% . 3.8% 3.1 o/o 3.1% 2.6% 3.5% 2.9%jl UNITW KINGC•OM 4.5% 2.6'1'> 1.8% 2. 7% :1.4% 2.0% 1.2% 1 .2% 1.8% 1 .3% 1.6% .. 1 .2% 1 .5% 1 .2% 1.2%
!
·~~TAL
Ell2~.8%
23.7')1. -- 26.6o/,--~4~5%
:n.7% 20.8% 20.9':'619~7%
22.8% 23.5%23.~%
23.2% 23.0%23.~%
20.9%I
lAWES NORWAY N/A 2.6% 2.5% 3.1% :1.1% 1.2% 1.6% 1.3% 2.0% 1.8% 0.8% 1.4% 2.2% 2.6% 1.8%
!
OTHER FINLAND N/A 2.9% 2.9~f. ~.0% 3.7% 2.8% 2.0% 2.1% i.6% 3.1% 3.3% 3.3% 1.R% 1.7% 1.5%1
I. SWEDEN N/1-, .2.5% 3.0% 1.7% 2.2% 1.291- 0.9% 1.0% 1.3% 0.8% 0.3% 0.4% --0~ 0.3%
'0.2%1
rOT.ALAWES 37.5% 31.9% 35.1% 32.3% 35.7% 211.0% 2f:i.3% ;>1 •. 1% 7.7 ... % 29 .. 2% 28.1% 28.'2% 27.4% 28.0% 2~,.3%1,I · · -.. - - - _ j i
!
:·JAPAN 37.2% 41.29'. ~-0.3% 38.2'11. 3fl.2% 4A.3% t..G.f.l% tl.1.9o/, 41.1% 34.3% 37.1% 38.2% 38.39'> 313.1% 39.2%'
! - - -
---'!KOREA 1.5% 3.!>% 3.7% 13.0% 7.3% 13.8% 11.5% 15.2% 12.9% 17.S% i4.1% 13./?% 15.0% 1J.5% 14.8%
I: cHINA JpoLAND
I
ROMAIIJIA BULGARIA USSR
i
RUSSIAI
I YUGOSLAVIA UKRAINEL-·
CROATIA !!REST OF WORLD1\1//·. 1'1/1\ ~1/P. N/A '·If,\ Nff, 2:.:;.1% N/A 3.8~t NJ!, fiiJA ::1.4% 1,1,% 1"-.7% 0.2% 2.5%
.'-If .I\
Nf.\. 4.3% 1.n% 12.3% 8.7% 2.5% ~.1/!\ N/.t•.
::· .. 5%
1.5% 13.6% 1.3% 2.0% ~·l//1 Nf.A 3.5% 1.6% 12.4%
2 0%
TABLE 6 A - NEW ORQERS
-- - - · - - -
-FIGURES AI THE END OF THE YEAR 1000 CGI
1976 1980 1981 1982 1983 1984 1985 1986 1987 1988 1989 1990 1991 1992 1993
EU BELGIUM 75.0 53.8 81.4 43.3 58.7 69.5 26.8 43.2 34.0 52.0 101.7 71.4 75.1 14.0 18.4
DENMARK 317.1 284.6 296.6 250.6 428.9 405.2 86.0 305.9 219.2 205.3 192.4 596.4 265.9 246.6 390.4
FRANCE 63.6 556.4 333.0 175.9 136.4 106.5 262.5 132.4 60.5 204.6 165.9 136.2 327.9 35.0 226.6
GERMANY (1) 726.1 613.0 1249.9 1239.9 1236.9 1072.9 1228.2 1297.1 872.4 877.6 1400.6 875.6 559.1 858.9 1029.0
GREECE N/A 82.4 4.5 10.3 4 .. 6 7.4 29.4 5.1 6.5 6.1 5.0 0.8 8.9 8.7 7.2
IRELAND 19.2 1.3 18.2 1.3 0.0 0.0 0.0 0.0 0.0 0.0 0.0 0.0 0.0 0.0 0.0
ITALY 301.5 - 231.2 •144. 7 243.2 57.1 68.2 257.4 229.0 408.7 172.3 564.8 413.1 380.5 134.9 511.2
NETHERLANDS 626.4 373.3 365.2 309.0 237.3 248.4 269.8 137.0 91.9 3.56.2 236.3 277.1 296.7 211.0 305.2
PORTUGAL 73.0 30.7 55.5 27.8 36.0 30.6 1.2 29.5 78.1 33.1 69.6 79.6 8.3 1.5 5.7
SPAIN 297.0 737.5 675.2 323.9 222.1 92.2 197.6 258.5 421.7 453.8 274.1 487.8 74.8 127.5 359.9
UNITED KINGDOM 627.6 350.2 410.8 301.5 150.4 107.6 224.4 112.0 116.5 124.2 209.2 205.1 172.6 119.8 65.5
TOTAL EU 3126.5 3314.4 3635.0 2926.7 2568.4 2208.5 2583.3 2549.7 2309.5 2485.2 3219.6 3143.1 2169.8 1757.9 2919.1
I OTHER FINLAND N/A 523.9 502.5 :21.1 135.4 389.5 158.0 . 202.2 637.7 108.0 63.0 256.7 139.4 178.7 515.1 AWES NORWAY · N/A 381.6 408.7 156.4 108.8 208.2 129.9 136.4 139.2 112.1 398.8 190.9 1-18.1 165.0 251.8
~
SWEDEN N/A 205.4 359.3 184.5 278.4 34.0 16.1 59.2 71.4 13.2 110.1 3.8 4.3 23.5 1.0TOTAL AWES 4659.5 4425.3 4905.5 3488.7 3091.0 2840.2 2887.3 2947.5 3157.8 2718.5 3791.5 3594.5 2431.6 2125.1 3687.0
JAPAN 7337.5 6708.3 5823.'1 4859.4 7389.1 6040.0 4440.0 3431.6 3120.5 3360.7 5879.7 6116.4 4433.0 3268.3 4681.4
KOREA 325.4 939.3 893.3 1001.5 2147.1 1180.9 806.5 1352.4 1942.6 1203.0 1671.4 2169.2 2278.1 1085.3 3672.6
CHINA N/A N/A 233.0 11"9.6 285.9 179.9 204.0 321.5 263.8 330.6 258.5· 387.4 429.7 585.0 436.5
POLAND N/A 208.4 146.0 133.3 489.8. 417.1 270.3 321.4 302.6 218.4 209.5 218 .. 4 295.9 434.5 191.2
ROMANIA N/A N/A N/A N/A N/A N/A N/A N/A N/A N/A N/A N/A 550.4 57.0 149.6
BULGARIA· N/A N/A N/A N/A N/A N/A N/A N/A N/A N/A N/A N/A 109.9 45.8 41.5
USSR N/A 12.1 24.0 68.4 N/A 2.9 N/A N/A N/A 92.6 214.1 209.1 83.6
RUSSIA 254.6 358.3
UKRAINE 105.9 290.5
YUGOSLAVIA N/A 242.3 76.8 320.0 123.8 75.0 329.6 447.3 130.8 306.9 478.5 322.6 127.4
CROATIA 129.0 153.4
REST OF WORLD 3659.9 1822.0 1951 .4 1542.3 1323.4 1041.7 1383.7 660.4 822.0 895.2 1061.1 1285.9 1175.4 729.6 864.0
TOTAL WORLD 15982.3 14357.7 14053.1 11533".2 14850.1 11777.7. 10321.4 9482.1 9740.1 9125.9 13564.3 14303.5 11915.0 8820.1 14526.0
- - -
-Source: _"WORLD·SHIPBUILDING DATABANK" based on data supplied by LLOYD'S MARITIME INFORMATION SERVICES
[image:23.760.42.743.65.471.2]I N
-F
)
TABLE 6 B - NEW ORQERS
- - -
-FIGURES AT THE END OF THE YEAR
1976 1980 1981 1982 1983 1984 1985 1986 1987
EU BELGIUM 0.5% 0.4% 0.6% 0.4% 0.4% 0.6% 0.3% 0.5% 0.3% DENMARK 2.0% 2.0% 2.1% 2.2% .2.9% 3.4% 0.8% 3.2% 2.3% FRANCE 0.4% 3.9% 2.4%· 1.5% 0.9% 0.9% 2.5% 1.4% 0.6% GERMANY (1) 4.5% 4.3% 8.9% 10.8% 8.3% 9.1% 11.9% 13.7% 9.0% GREECE N/A 0.6% 0.0% 0.1% 0.0% 0.1% 0.3% 0.1% 0.1% IRELAND 0.1% 0.0% 0.1% 0.0% 0.0% 0.0% 0.0% 0.0% 0.0% ITALY 1.9% 1.6% 1.0% 2.1% 0.4% 0.6% 2.5% 2.4% 4.2% NETHERLANDS 3.9% 2.6% 2.6% 2.7% 1.6% 2.1% 2.6% 1.4% 0.9% PORTUGAL 0.5% 0.2% 0.4% 0.2% 0.2% 0.3% 0.0% 0.3% 0.8% SPAIN 1.9% 5.1% 4.8% 2.8% 1.5% 0.8% 1.9% 2.7% 4.3% UNITED KINGDOM 3.9% 2.4% 2.9% 2.6% 1.0% 0.9% 2.2% 1.2% 1.2%
TOTAL EU 19.6% 23.1% 25.9% 25.4% 17.3% 18.8% 25.0% 26.9% 23.7%
OTHER FINLAND N/A 3.6% 3.6% 1.9% 0.9% 3.3% 1.5% 2.1% 6.5% AWES NORWAY N/A 2.7% 2.9% 1.4% 0.7% 1.8% 1.3% 1.4% 1.4% SWEDEN N/A 1.4% 2.6% 1.6% 1.9% 0.3% 0.2% 0.6% 0.7%
TOTAL AWES 29.2% 30.8% 34.9% 30.2% 20.8% 24.1% 28.0% 31.1% 32.4%
JAPAN 45.9% 46.7% 41.4% 42.1% 49:8% 51.3% 43.0% 36.2% 32.0%
KOREA 2.0% 6.5% 6.4% 8.7% 14.5% 10.0% 7.8% 14.3% 19.9%
CHINA N/A N/A 1.7% 1.0% 1.9% 1.5% 2.0% 3.4% 2.7%
POLAND N/A .1.5% 1.0% 1.2% 3.3% 3.5% 2.6% 3.4% 3.1%
ROMANIA N/A N!A N/A N/A N/A N/A N/A N/A N/A
BULGARIA N/A N/A N/A N/A N/A N/A N/A N/A N/A
USSR N/A 0.1% 0.2% 0.6% N/A 0.0% N/A N/A N/A
RUSSIA UKRAINE
! YUGOSLAVIA N/A 1.7% 0.5% 2.8% 0.8% 0.6% 3.2% 4.7% 1.3%
CROATIA
7.0% 8.4%
-MARKET SHARES
1988 1989 1990 1991 - 1992 1993
0.6% 0.7% 0.5% 0.6% 0.2% 0.1% 2.2% 1.4% 4.2% 2.2% 2.8% 2.7% 2.2% 1.2% 1.0% 2.8% 0.4% 1.6% 9.6% 10.3% 6.1% 4.7% 9.7% 7.1% 0.1% 0.0% 0.0% 0.1% 0.1%- 0.0% 0.0% 0.0% 0.0% 0.0% 0.0% 0.0% 1.9% 4.2% 2.9% 3.2% 1.5% 3.5% 3.9% 1.7% 1.9% 2.5% 2.4% 2.1% 0.4% 0.5% 0.6% 0.1% 0.0% 0.0% 5.0% 2.0% 3.4% 0.6% -1.4% 2.5% 1.4% 1.5% 1.4% 1.4% 1.4% 0.5%
27.2% 23.7% 22.0% 18.2% 19.9% 20.1%
1.2% 0.5% 1.8% 1.2% 2.0% 3.5% 1.2% 2.9% 1.3% 1.0% 1.9% 1.7% 0.1% 0.8% 0.0% 0.0% 0.3% 0.0%
29.8% 28.o%· 25.1% 20.4% 24.1% 25.4%
36.8% 43.3% 42.8% 37.2% 37.1% 32.2%
13.2% 12.3% 15.2% 19.1% 12.3% 25.3%
3.6% 1.9% 2.7% 3.6% 6.6% 3.0% 2.4% 1.5% 1.5% 2.5% 4.9% 1.3% N/A N/A N/A 4.6% 0.6% 1.0% N/A N/A N/A 0.9% 0.5% 0.3% 1.0% 1.6% 1.5% 0.7%
2.9% 2.5% 1.2% 2.0% 3.4% 3.5% 2.3_% 1.1%
[image:24.762.36.736.79.438.2]1-.J.
v\
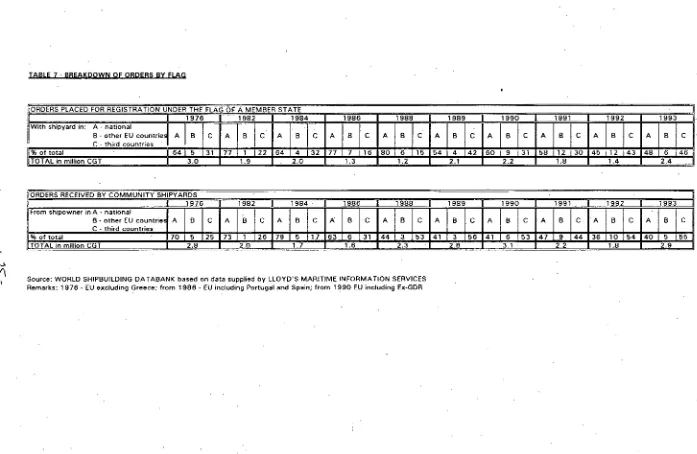
TABLE 7 - BREAKDOWN OF ORDERS BY FLAG
i:_Q_R_p_j;_B_S PLACE_Q_FOR_!1fli1STRATION UNDER THE FLAG OF A MEMBER STATE
1986 1988
c A B c A B c
I
With shipyard in: A- national ~I
I
B -other EU countrie A B I C I A I B I C I A I B' C - third countries
1976 I 1982 I 1984
ll% of total I 64 I 5 ·I 31 177 I 1 122 164 I 4 32 77 7 16 80 6 15
IITOTAL in million CGT I 3.0 I 1.9 I 2.0 1.3 1.2
iiORDERS RECEIVED BY COMMUNITY SHIPYARDS
'I I 1976 I 1982 I 1984' I 1986 I 1988
I
From shrpowner rnA - natronalil B- other EU countrie• A B c A B c A B c A B ·c A B c
r
c -third countries%of total 70 5 25 73 1 26 79 5 17 63 6 31 44 3 53
TOTAL in million CGT 2.8 2.0 1.7 1.6 2.3
Source: WORLD SHIPBUILDING DATABANK based on data supplied by LLOYD'S MARITIME INFORM A !ION SERVICES Remarks: 1976- EU excluding Greece; from 1986- EU including Portugal and Spain; from 1990 EU including Ex-GDR
19B9 1990 1991 1992 1993
A B I C
Abc
A B c AI
B C lA B I C 54 4 142 6 0 __l_jL__i 3 1 58 12 30 45 I 12 43 148 6 1462.1 2.2 1.8 1.4 2.4
I 1989 I 1990 I 1991 I 1992 I 1993
A B c A B c A B c .A B c A 8 c
41 3 56 41 6 53 47 9 44 36 10 54 40 5 55
[image:25.761.48.745.32.486.2]9-J
lJ' I
TABLE 8- TREND OF NEW ORDERS BY TYPE OF VESSEL
- -
-OIL TANKERS BULK CARRIERS CARGO SHIPS !'JON CARGO VESSEL TOTAL
'000 CGT %. '000 CGT % '000 CGT % '000 CGT % '000 CGT %
1977 WORLD 790.6 1783.2 8497.3 2969.8 14040.9
EU 30.9 3.9 75.1 4.2 1764.4 20.8 670.5 22.6 2540.9 1 8.1
1978 WORLD 1 185.4 534.6 6163.8 1912.7 9796.5
EU 56.2
'
4.7 23.6 4.4 1341 .3 21.8 591.5 30.9 2012.6 20.51979 WORLD 3364.8 2744.9 5148.4 2949.8 14207.9
EU 168.1 5.0 466.5 17.0 11 72.6 22.8 747.6 25.3 2554.8 18.0
1980 WORLD 2960.2 4325.3 4780.1 2291.9 14357.5
EU 273.7 9.2 425.9 9.8 1023.4 21.4 740.8 32.3 2463.8 17.2
1981 WORLD 1166.7 4934.9 4967.9 2433.0 13502.5 I
EU 75.1 6.4 487.9 9.9 1342.7 27.0 606.4 24.9 2512.1 18.6
1982 WORLD 662.6 2335.3 5679.9 2135.4 10813.2
EU 70.3 10.6 197.5 8.,5 1093.2 19.2 628.0 29.4 1989.0 18.4
1983 WORLD 1682.1 5370.3 5910.8 1886.9 14850.1
1
1984EU 92.3 5.5 110.7 2.1 1039.9 17.6 380.9 20.2 1623.8 10.9
WORLD 1176.2 3890.6 4742.2 1956.8 11765.8 .
--'---,
EU 179.3 15.2 165.6 4.3 944.2 19.9 448.8 22.9 1737.9 14.8
1985 'WORLD 470.1 3918.4 5299.9 2089.2 11777.6
EU 15.3 3.3 152.8 3.9 1029.7 19.4 459.3 22.0 1657.1 '14.1
1985 WORLD 575.4 2454.5 5138.8 2152.4 10321.1
EU 18.0 3.1 154.9 6.3 1033.5 20.1 769.6 35.8 1976.0 19.1
1986 WORLD 1199.7 1296.0 4208.4 2778.0 9482.1
EU 0.0 0.0 108.0 8.3 768.6 18.3 704.7 25.4 1581.3 16.7
1987 WORLD 1404.6 1033.2 4899.7 2402.7 9740.2 11
EU 107.5 7.7 45.3 4.4 1128.1 23.0 690.1 28.7 1971.0 20.211
1988 WORLD 781.8 2164.5 3985.6 2194.0 9125.9
"
ii
EU 116.7 14.9 0.0 0.0 1095.5 27.5 1048.1 47.8 2260.3 24.8!1
1989 WORLD 1943.6 2483,1 6798.4 2339.3 13564.4 !!
I
EU 219.9 11.3 70.8 2.9 1454.3 21.4 1008.8 43.1 2753.8 20.3 ~:
1990 WORLD 4127.9 1639.0 6530.2 2006.5 14303.6
EU 542.6 13.1 207.0 12.6 1541.0 23.6 852.0 42.5 3142.6 22.0il
1991 WORLD 1917.9 2218.0 6507.9 1271.3 11915.0
I
N
~ I
TABLE 9 A -ORDER BOOK
~-- -~ - -
-FIGURES AT THE END OF THE YEAR
1976 1980 1981 1982 1983 1984 1985 1986
EU BELGIUM 277.0 331.7 311.5 261.1 143.7 136.1 62.1 60.0
DENMARK 923.5 652.4 618.9 603.9 707.7 692.2 442.1 429.8
FRANCE 1770.4 1193.7 1138.2 978.5 598.6 263.3 382.7 371.2
GERMANY (1) 2113.3 950.9 1082.0 1177.7 1178.1 959.4 1118.9 1281.7
GREECE N/A 240.6 245.4 191.4 146.1. 137.4 119.9 102.8
IRELAND 43.9 17.8 19.3 20.0 2.1 0.0 0.0 0.0
ITALY 1036.2 639.8 427.3 480.4 \ 356.3 195.5 345.5 465.8
NETHERLANDS 917.1 493.7 551.7 498.8 308.8 331.6 300.3 195.6
PORTUGAL N/A 191.2 240.4 258.4 124.1 138.3 94.0 67.0
SPAIN N/A 1769.5 1754.0 1325.3 967.4 690.5 491.5 527.7
UNITED KINGDOM 1989.4 615.0 768.9 714.1 506.1 292.3 352.5 325.4
TOTAL EU 9070.8 7096.3 7157.6 6509.6 5039.0 3836.6 3709.5 3827.0
OTHER F:NLAND N/A 1144.3 1139.5 1023.8 710.3 642.2 544.4 483.9
AWES NORWAY N/A 589.3 670.3 371.9 185.6 229.8 148.1 146.8
SWEDEN N/A 703.8 646.3 494.9 494.5 267.8 181.7 137.5
TOTAL AWES 15839.2 9533.7 9613.7 8400.2 6429.4 4976.4 4583.7 4595.2
JAPAN 12093.8 7297.8 7457.7 6640.2 8477.9 8221.5 5915.2 3915.9
KOREA 7943.2 1320.3 1711 .1 1854.9. 2898.4 3223.1 2578.7 1909.2
CHINA N/A N/A 260.9 298.3 493.5 433.2 486.5 547.0
POLAND N/A 1634.6 1459.0 1174.6 1143.1 1272.1 1018.1 1041.6
ROMANIA N/A N/A N/A N/A N/A N/A N/A N/A
BULGARIA N/A N/A N/A N/A N/A N/A N/A N/A
USSR N/A N/A 128.9 92.7 53.9 42.8 N/A N/A
RUSSIA UKRAINE
YUGOSLAVIA N/A 760.7 626.7 699.9 492.6 455.4 545.9 840.0
CROATIA
RES! OF WORLD 3693.0 5045.1 5105.6 4570:7 4129.7· 3448.0 3435.8 I 2796.8
TOTAL WORLD 39569.2 25592.2 26363.6 23731.5 24118.5 22072.5 18563.9 15645.7 '
·-Source: ""WORLD SHIPBUILDING DATABANK"" based on data supplied by LLOYD'S MARITIME" INFORMATION SERVICES
(1) From 1980 on data includes order book from Ex-GDR yards
1000 CGT
1987 1988 1989 1990 1991 1992 1993
75.0 82.0 147.7 154.4 213.4 116.8 133.8
473.9 459.6 589.7 927.7 876.6 674.3 733.5
234.5 379.9 361.9 397.2 556.8 410.8 568.7
1426.3 1429.2 1974.0 1955.0 1529.9 1471.4 1633.5
121.5 116.8 113.6 69.1 73.0 42.3 43.7
0.0 0.0 0.0 0.0 0.0 0.0 0.0
864.8 . 904.2 1188.6 1298.4 1190.9 1036.4 1049.4
141.8. 365.1 414.5 443.4 387.5 321.5 389.1
108.3 114.0 155.7 181.6 153.1 96.5 45.6
635.6 837.7 853.7 1004.1 757.2 476.4 475.2
369.7 317.1 376.5 418.9 413.6 411.5 321.4
4451.4 5005.6 6175.9 6849.8 6152.0 5057.9 5393.9
991.0 962.9. 652.1 589.4 494.3 467.1 791.2
136.9 114.3 422.8 463.6 381.8 284.3 370.6
93.8 39.0 115.3 64.3 23.9 23.7 0.4
5673.1 6121.8 7366.1 7967.1 7052.0 5833.0 6556.1
2918.5 3473.9 5696.5 7494.7 7621.8 6482.7 6266.5
2639.1 2342.7 2813.1 3500.7 3922.7 3012.2 4800.5
647.3 809.8 681.0 813.6 942.0 1235.7 1257.4
1251.6 1131.3 1080.1 1136.6 999.7 1124.6 1022.3
N/A N/A N/A N/A 912.6 766.0 860.5
N/A N/A N/A N/A 237.0 224.0 142.2
N/A 74.1· 248.5 343.1 360.4
465.4 778.9
237.9 426.0
751.4 861.9 1011.4 1046.9 886.3 "133.3 N/A
532.2 510.7
2675.0 2857.9 3071.2 3343.5 30()3.2 2601.8 2299.1
[image:27.763.32.751.56.491.2]TABLE 9 B • ORDER BOOK
FIGURES AT THE END OF THE YEAR MARKET SHARES
1976 1980 1981 1982 1983 1984 1985 1986 1987 1988 1989 1990 1991 1992 1993
EU BELGIUM 0.7% 1.3% 1.2% 1.1% 0.6% 0.6% 0.3% 0.4% 0.5% 0.5% 0.7% 0.6% 0.8% 0.5% 0.5% DENMARK 2.3% 2.5% 2.3% 2.5% 2.9% 3.1% 2.4% 2.7% 2.9% 2.6% 2.7% 36% 3.4% 3.0% 2.9% FRANCE 4.5% 4.7% 4.3% 4.1% 2.5% 1.2% 2.1% 2.4% 1.4% 2.1% 1.6% 1.5% 2.1% 1.8% 2.3% GERMANY 11) 5.3% 3.7% 4.1% 5.0% 49% 4.3% 6.0% 8.2% 8.6% 8.1% 9.0% 7.6% 5.9% 6.5% 6.6% GREECE N/A . 0.9% 0.9% ·0.8% o:6% 0.6% 0.6% 0.7% 0.7% 0.7% 0.5% 0.3% 0.3% 0.2% 0.2% IRELAND 0.1% 0.1% 0.1% 0.1% 0.0% 0.0% 0.0% 0.0% 0.0% 0.0% 0.0% 0.0% 0.0% 0.0% 0.0% ITALY 2.6% 2.5% 1.6% 2.0% 1.5% 0.9% 1.9% 3.0% 5.2% 5.1% 5.4% 5.1% 4.6% 4.6% 4.2% NETHERLANDS 2.3% 1.9% 2.1% 2.1% 1.3% 1.5% 1.6% 1.3% 0.9% 2.1% 1.9% 1.7% 1.5% 1.4% 1.6% PORTUGAL N/A 0.7% 0.9% 1.1% 0.5% 0.6% 0.5% 0.4% 0.7% 0.6% 0.7% 0.7% 0.6% 0.4% 0.2% SPAIN N/A 6.9% 6.7% 5.6% 4.0% 3.1% 2.6% 3.4% 3.8% 4.7% 3.9% 3.9% 2.9% 2.1% 1.9% UNITED KINGDOM 5.0% 2.4% 2.9% 3.0% 2.1% 1.3% 1.9% 2.1% 2.2% 1.8% 1.7% 1.6% 1.6% 1.8% 1.3%
TOTALEU 22.9% 27.7% 27.1% 27.4% 20.9% 17.4% 20.0% 24.5% 26.9% 28.3% 28.1% 26.7% 23.7% 22.3% 21.6%
So'
OTHER FINLAND AWES NORWAY N/A N/A 4.5% 2.3% 4.3% 2.5% 4.3% 1.6% 0.8% 2.9% 2.9% 1.0% 0.8% 2.9% 0.9% 3.1% 0.8% 6.0% 0.6% 5.4% 3.0% 1.9% 1.8% 2.3% 1.5% 1.9% 1.3% 2.1% 3.2% 1.5% SWEDEN N/A 2.8% 2.5% 2.1% 2.1.% 1.2% 1.0% 0.9% 0.6% 0.2% 0.5% 0.3% 0.1% 0.1% 0.0%TOTAL AWES 40.0% 37.3% 36.5% 35.4% 26.7% 22.5% 24.7% 29.4% 34.3% 34.6% 33.5% 31.1% 27.2% 25.8% 26.3%
JAPAN 30.6% 28.5% 28.3% 28.0% 35.2% 37.2% 31.9% 25.0% 17.6% 19.7% 25.9% 29.2% 29.4% 28.6% 25.1%
KOREA 20.1% 5.2% 6.5% 7.8% 12.0% 14.6% 13.9% 12.2% 15.9% 13.3% 12.8% 13.6% 15.1% 13.3% 19.3%
I
CHINA N/A N/A 1.0% 1.3% 2.0% 2.0% 2.6% 3.5% 3.9% 4.6% 3.1% 3.2% 3.6% 5.5% 5.0%: POLAND N/A 6.4% 5.5% 4.9% 4.7% 5.8% 5.5% 6.7% 7.6% 6.4% 4.9% 4.4% 3.9% 5.0% 4.1%
ROMANIA N/A N/A N/A N/A N/A N/A N/A N/A N/A N/A N/A N/A 3.5% 3.4% 3.5%
BULGARIA N/A N/A N/A N/A N/A N/A N/A N/A N/A N/A N/A N/A 0.9% 1.0% 0.6%1
USSR N/A N/A 0.5% 0.4% 0.2% 0.2% N/A N/A N/A 0.4% 1.1% 1.3% 1.4%
RUSSIA 2.1% 3.1%
UKRAINE 1.1% 1.7%
YUGOSLAVIA N/A 3.0% 2.4% 2.9% 2.0% 2.1% 2.9% 5.4% 4.5% 4.9% 4.6% 4.1% 3.4% 0.6% N/A
CROATIA 2.3% 2.0%
[image:28.765.37.737.73.433.2]';-.J
...!)
TABlE 10- ORDER BOOKS AND DEliVERY SCHEDULE
1 000 CGT
I
I
SHIPS ORDER BOOKAS AT FOR DELIVERY IN:
31/12/93 1994 1995 1996 1997
COMPLETED 1993
~ND BEYOND
BELGIUM 5.0 133.8 130.1 3.7 0.0 0.0
DENMARK 354.3 733.5 335.1 397.4 1.0 0.0
FRANCE 65.0 568.7 1 05 .. 1 240.1 160.5 6;3.0
GERMANY 853.0 1633.5 950.1 458.1 225.3 0.0
GREECE 6.6 43.7 43.7 0.0 0.0 0.0
IRELAND 0.0 0.0 0.0 0.0 0.0 0.0
ITALY 496.3 1049.4 '531.1 293.5 224.8 0.0
NETHERLANDS 236.0 389.1 295.4 73.6 20.1 0.0
PORTUGAL 62.3 45.6 45.6 0.0 0.0 0.0
-SPAIN 364.7 475.2 291.7 . 146.0 26.8 10.7
UNITED KINGDOM 148.4 321.4 131.0 116.4 74.0 0.0
ITOTAL EU II 2591.611 5393.911 2858.911 1728.81 732.51 73.7
Source: WORLD SHIPBUILDING DATABANK based on data supplied by LLOYD'S MARITIME INFORMATION SERVICES
[image:29.761.29.762.35.414.2]w
0TABLE 11 - EMPLOYMENT IN THE CONSTRUCTION OF NEW VESSELS fN THE EUROP£AN UNION
1975 1978 1979 1980 1981 1982 1983 1984 1985 1986 1987 1988 BELGIUM 7467 6614 6258 6523 6347 4680 4104 4060 3923 2995 2548 2270 DENMARK 16630 12000 9000 11400 11350 11800 11200 10300 10200 7000 7000 7300 FRANCE 111 32500 25300 23000 22200 22200 21600 21000 16940 15053 13700 8940 6850 GERMANY 46839 31113 27369 24784 26521 27600 25966 22183 22260 18184 12875 14845 GREECE 2316 N/A N/A 2672 3393 2900 2812 2000 2000 1709 1621 1855 IRELAND 869 840 750 750 762 882 550 0 0 0 0 0 ITALY 25000 20000 19000 18000 16500 13750 12800 12800 12000 11570 9500 131 8428 131 NETHERLANDS 121 22662 17540 14540 13100 13100 12800 11250 10330 6236 5400 3600 3500 PORTUGAL N/A N/A N/A N/A N/A N/A N/A N/A 5370 5087 5020 4412 SPAIN N/A N/A N/A N/A N/A N/A N/A N/A 18000 < 18000 17300 14000
UNITED KINGDOM 54550 41050 31200 24800 25345 25000 20486 14655 14200 12500 11500 9000 TOTAL EEC 208833 154457 131117 124229 125518 121012 110168 93268 109242 96145 79904 72460
Table compiled from national sources
(1 J From 1986 on the figure covers jobs in new shipbuilding and naval and para-naval building (convertion, naval vessels and off-shorel.
F1gures for rr~ preceding years using the same method are: 1 9 75 · 32500, 1980 -23 700, 1985 - 1 7 700.
121 From 1 9 75 '" 1 984 includ.ng naval dockyards estimated to be: 19 75 - 1 BOO, 1 9 78 and 1 979 - 3200, 1980 · ~400, 1981 and 1982 - 3200, 1 983 and 1984 - 2800 (3) 2780unemployed should be added to 1987's figure, 2850 to 1988's f1gure and 2581 to 1989's figure.
Of these 2000 represent a structural over capacity for whom no new jobs can be found
14) Includes haval building !51 Excluding jobs in Ex·GDR's yards !61 Of which 1838 currently inllctive
( 71 Revised figure
181 Including 11 700 jobs in Ex-GDR's yards in 1991, 12441 jobs in 1 992 and 9000 in 1993
191 1321 unemployed should be ~dded to this figure, representing a structural over capacity, whose elimination is foreseen during 1992
! 101 700 unemployed should be ~dded to this f1gure, representing a structural over capacity, for whom re employment is not. foreseen I 1 1 ) 1160 currently inactive should be added to this figure
Number of em lovees 1989 1990 1991 1992 1993 2307 2377 2418 2391 1665 7900 8400 8600 8300 7300 li8oo 6600 6100 6040 5880 14732 15297 151 27763 181 28146 181 24143181!
1535141 550 0 0 0
0 0 0 0 0
[image:30.762.43.747.68.213.2]