White Rose Research Online URL for this paper: http://eprints.whiterose.ac.uk/132162/
Version: Accepted Version
Article:
Ali, U., Font-Palma, C., Akram, M. et al. (3 more authors) (2017) Comparative potential of natural gas, coal and biomass fired power plant with post - combustion CO2 capture and compression. International Journal of Greenhouse Gas Control, 63. pp. 184-193. ISSN 1750-5836
https://doi.org/10.1016/j.ijggc.2017.05.022
eprints@whiterose.ac.uk https://eprints.whiterose.ac.uk/
Reuse
This article is distributed under the terms of the Creative Commons Attribution-NonCommercial-NoDerivs (CC BY-NC-ND) licence. This licence only allows you to download this work and share it with others as long as you credit the authors, but you can’t change the article in any way or use it commercially. More
information and the full terms of the licence here: https://creativecommons.org/licenses/
Takedown
If you consider content in White Rose Research Online to be in breach of UK law, please notify us by
Comparative Potential of Natural Gas, Coal and Biomass Fired
Power Plant with Post - combustion CO
2Capture and Compression
Usman Alia1
, Carolina Font-Palmab,Muhammad Akrama, Elvis O. Agbonghaec, Derek B Inghama, Mohamed Pourkashaniana
aEnergy 2050, Energy Engineering Group, Faculty of Engineering, University of Sheffield, Faculty of
Engineering, S10 2TN, UK
bDepartment of Chemical Engineering, Thornton Science Park, University of Chester, CH2 4NU, UK cResearch and Development Division, Nigerian National Petroleum Corporation (NNPC), E.P.C.L.
Life Complex, P.M.B. 5373, Eleme, Rivers State, Nigeria
Abstract
The application of carbon capture and storage (CCS) and carbon neutral techniques should be adopted to reduce the CO2 emissions from power generation systems. These environmental concerns have renewed interest towards the use of biomass as an alternative to fossil fuels. This study investigates the comparative potential of different power generation systems, including NGCC with and without exhaust gas recirculation (EGR), pulverised supercritical coal and biomass fired power plants for constant heat input and constant fuel flowrate cases. The modelling of all the power plant cases is realized in Aspen Plus at the gross power output of 800 MWe and integrated with a MEA-based CO2 capture plant and a CO2 compression unit. Full-scale detailed modelling of integrated power plant with a CO2 capture and compression system for biomass fuel for two different cases is reported and compared with the conventional ones. The process performance, in terms of efficiency, emissions and potential losses for all the cases, is analysed. In conclusion, NGCC and NGCC with EGR integrated with CO2 capture and compression results in higher net efficiency and least efficiency penalty reduction. Further, coal and biomass fired power plants integrated with CO2 capture and compression results in higher specific CO2 capture and the least specific losses per unit of the CO2 captured. Furthermore, biomass with CO2 capture and compression results in negative emissions.
Keywords: Biomass firing; exhaust gas recirculation; constant heat input; constant fuel flow rate
1 Introduction
There is a wide consensus that human activities influence and cause global warming, which results in climate change due to greenhouse gas (GHG) emissions (Pachauri et al., 2014). Further, the major contributor of GHG has already crossed the limit of 400 ppm of CO2 equivalent emissions into the atmosphere. The power generation sector is a major contributor of CO2 emissions from combusting coal and natural gas. The application of carbon capture and storage (CCS) to thermal power plants or carbon neutral techniques should be adopted at a faster rate in order to mitigate the effect of global warming and to reduce the level of CO2 emissions (IPCC, 2014). The
technologies or techniques that can remove and/or reduce the large amount of CO2 from the atmosphere should be a considerable part of the energy mix in order to limit the global temperature rise to 2 oC (Bhave et al., 2014). The post-combustion CO2
capture using aqueous amines is the most developed process and it has already been
demonstrated (Liang et al., 2015; Tontiwachwuthikul et al., 2013). The progress in
research, development and demonstration in the post-combustion CO2 capture can be
found in the literature (Liang et al., 2015; Tontiwachwuthikul et al., 2013; Wang et
al., 2011).
It is generally agreed that the most efficient and inexpensive means of reducing CO2 emissions is by replacing coal with biomass and/or co-firing coal with biomass (Baxter, 2005). There is a growing evidence that bioenergy with carbon capture and storage will contribute to approximately half of the UK emissions targets (ETI, 2016; McGlashan et al., 2010). In the past, biomass was not used -in large scale power generation systems as a substitute for fossil fuels due to the low energy density, scarcity, considerable cost of transportation and its environmental impact (McIlveen-Wright et al., 2013). However, environmental concerns have renewed the interest in the use of biomass as an energy source for power generation (McKendry, 2002; Thornley, 2006; Thornley et al., 2008). As a result, Drax has converted and upgraded
first of three coal boilers (with unit capacity of 645 MW) to use compressed wood pellets in the UK since 2013 (DRAX, 2016). Sustainably-grown biomass still emits
fuel. It is worth pointing that there is a time lag between the instantaneous release of the CO2 due to the biomass burning and the eventual consumption of the released CO2 by the newly grown biomass (McKendry, 2002). Further, if CCS is applied to sustainably-grown biomass, it would effectively result in negative CO2 emissions (Eisentraut and Brown, 2012). Therefore, biomass usage results in no net CO2 emissions when coal is replaced by sustainably-grown biomass and/or results in a reduction of the net CO2 emissions when co-firing coal with biomass. To attain the projected biomass contribution to the electricity generation market, and to further
reduce the CO2 emissions, biomass will contribute to a considerable proportion towards commercial-scale power generation systems in the near future, as discussed
in the literature (Faaij, 2006; Van den Broek et al., 2001). The major barriers to the demonstration and deployment of biomass for thermal power generation systems are the economics and sustainable biomass availability, rather than being of a technical nature (Bhave et al., 2014; Kraxner et al., 2014).
The use of biomass in thermal power generation systems may affect the system performance and efficiency due to the low heating value of biomass (McIlveen-Wright et al., 2011). However, biomass will result in additional benefits, such as lower SOx emission, and negative emissions if CCS is applied. The techno-economic assessment and specific reduction in the CO2 emissions for co-firing of coal and biomass in different types of technologies, including pulverized fuel firing, pressurized fluidised bed firing and atmospheric pressure circulating fluidised bed firing using the process simulator ECLIPSE have been reported in the literature (McIlveen-Wright et al., 2011; McIlveen-Wright et al., 2007; McIlveen-Wright et al., 2013). An energy analysis has been performed for the co-firing of biomass with coal in order to analyse the impact of the co-firing coal and biomass on the system performance (Mehmood et al., 2012). Similarly, a cost analysis and optimum plant size for co-firing of coal with biomass has also been reported (De and Assadi, 2009; Kumar et al., 2003).
and Abbas, 2011; Lucquiaud and Gibbins, 2011a, b; Pfaff et al., 2010; Rao and Rubin, 2006; Romeo et al., 2008; Sanpasertparnich et al., 2010; Strube and Manfrida, 2011) have reported the integration of a CO2 capture and CO2 compression system to a coal fired power plant. The integration is based on comparing the parametric and sensitivity effects on the performance of the whole system in order to make coal based power plants as a favourable approach to be adopted for CCS. However, NGCC due to the higher efficiency is the most attractive option to be adopted for the integration to a CO2 capture and CO2 compression system in the present scenario of interest
towards gas-CCS. Further, various studies (Botero et al., 2009; Jonshagen et al., 2011; Jonshagen et al., 2010; Li et al., 2011; Sipà cz and Assadi, 2010) have reported that
the NGCC with and without EGR to be an innovative approach when integrated with a CO2 capture and compression system. However, comparison of different power
plants based on the same power rating is not to be found in the literature on natural
gas, coal and biomass firing.
1.1 Novelty
None of the above-mentioned literature has reported the impact of biomass on power plants integrated with a carbon capture technology. A techno-economic assessment of
a standalone biomass fired power plant with two different kinds of CCS technologies, including PCC and oxy-fuel system, have compared the cost and emissions incentives to that of a coal fired power plant using IECM (Al-Qayim et al., 2015). IEA (2009) reported different case studies for the co-firing of biomass with coal for different technologies, including pulverised fuel firing, circulating fluidised bed firing and bubbling fluidised bed firing. Similarly, the same results as that of the IEA (2009) have been reported in (Domenichini et al., 2011). Benchmarking comparison of NGCC, coal and biomass fired power plants integrated with a MEA-based CO2 capture plant has been reported (Berstad et al., 2011) with emphasis on the efficiency losses and specific CO2 emissions for varying stripper operating pressure. It is found
that coal and biomass power plants with CCS are more favourable targets from an energy point of view (Berstad et al., 2011). Berstad et al. (2011) compared NGCC,
coal and biomass power plant integrated with CO2 capture plant, however, the base
power rating for each case varies. Further, it lacks the NGCC with EGR and this is an
innovative approach to lessen the energy penalty. Furthermore, it is unsure whether
result in less penalty. In order, to have a comprehensive comparison of different power
plant cases integrated with a CO2 capture and compression system to have a
meaningful understanding. The complete inclusion and reporting of each section of
the power plant is seldom found in the literature, especially emission control
technologies.
Figure 1 Basic schematic of the NGCC with EGR integrated with an amine-based CO2 capture plant and CO2 compression system.
Figure 2 Basic schematic of the solid fuel fired power plant integrated with an amine-based CO2 capture plant and CO2 compression system.
In addition, the reported literature is limited in comparison to different power plant
very limited work has been presented in the literature on the application of CCS towards the standalone biomass fired power plant and co-fired power plant. Therefore, the aim of this paper is to investigate and compare natural gas, coal and biomass fired power plants integrated with a CO2 capture and CO2 compression system and analyse the process performance in terms of efficiency, emissions and potential losses. In addition, different types of natural gas, coal and biomass fired power plants integrated with a CO2 capture and CO2 compression system are discussed and compared.
2 Process Configuration and Case Studies
Each of the natural gas, coal and biomass fired power plants can be sub divided into different case studies integrated with a CO2 capture system and CO2 compression unit and these are investigated in this paper. Natural gas fired power plant is sub divided into NGCC with and without EGR. Pulverised supercritical solid fuel fired power plant is divided into constant heat input and constant fuel flow rate for both coal and biomass.
Table 1 Input specifications for the NGCC models (U.S.DOE., 2013 ).
Parameter Without EGR With EGR
Gas turbine inlet temperature [Cifre, #31] 1487 1487 Gas turbine outlet temperature [Cifre, #31] 619 619 Air inlet temperature [Cifre, #31] 15 15 Flue gas temperature at HRSG exit [Cifre, #31] 88 106 Exhaust gas recirculation rate [%] 0 35
Pressure ratio 20 20
Compressor efficiency [%] 85 85
HP steam turbine efficiency [%] 88.9 88.9 IP steam turbine efficiency [%] 92.6 92.6 LP steam turbine efficiency [%] 94.0 94.0
Natural gas molar composition [%]
CH4 93.1
C2H6 3.2
C3H8 0.7
iso-C4H10 0.4
CO2 1.0
N2 1.6
Oxidiser composition at combustor inlet [%]
N2 77.32 78.99
O2 20.74 16.54
Ar 0.92 0.94
CO2 0.03 2.41
2.1 Natural Gas Fired Power Plants
The natural gas fired power plant modelled is based on the Siemens 8000H frame gas turbine with ISO output of 275 MW from the gas turbine section as in the 2013 Report of the US Department of Energy (U.S.DOE., 2013 ). A schematic of the NGCC with EGR integrated to the CO2 capture and compression system is shown in Figure 1. The pressure ratio of the compressor is 20 with a gas turbine inlet temperature 1487 oC and a gas turbine outlet temperature 619 oC. The bottom Rankine cycle consists of a triple pressure level single reheat cycle with a steam cycle specification of 16.5/566/566 MPa/oC/oC. The HRSG generates both main and reheat steam for the
steam cycle. The flue gas temperature is 88 oC at the HRSG exit and it is then directed to the CO2 capture system; the captured CO2 stream is compressed through a CO2 compression system. The specifications of the NGCC power plant modelled, along with natural gas and oxidizer compositions, are given in Table 1.
For NGCC with EGR, 35 % of the exhaust gas is recirculated to the compressor inlet of the gas turbine. The remaining 65 % of the flue gas is sent to the MEA-based CO2 capture plant and the captured CO2 is sent for compression through a CO2 compression unit. For NGCC with EGR, the gas turbine inlet and outlet temperatures are the same as that of the NGCC without EGR; however, the flue gas exit temperature is 106 oC at the HRSG exit. The specifications of the NGCC with EGR are listed in Table 1.
2.2 Coal Fired Power Plant
The pulverised coal fired power plant modelled in this paper is based on supercritical pulverised coal cases reported in the 2010 Report of the US Department of Energy (Black, 2010). The pulverised coal fired power plant has a gross power output of 800 MWe. A schematic of the coal fired power plant is shown in Figure 2 and it is integrated with a CO2 capture system and CO2 compression unit. For the supercritical case, the steam specification is 24.1/593/593 MPa/oC/oC and the steam generator is once-through with a super-heater, re-heater, economizer and air preheater (Black,
2010). The coal fired is bituminous type Illinois No. 6 coal, and its proximate and ultimate analysis with heating value is given in Table 2 for as-received and dry
analysis. The air composition used for combustion is the same as given in Table 1.
of steam turbines; high pressure, intermediate pressure and low pressure turbines. There are 8 feed water heaters, 3 upstream of the deaerator; heating the boiler feed water from the HP and IP turbines steam bleeds. The remaining 4 feed water heaters are at the downstream of the deaerator and LP turbine bleed steam is used for the boiler feed water heating. The condenser operates at a condensing pressure of 7 kPa with a corresponding saturation temperature 38 oC. In addition, the steam required by the MEA-based CO2 capture plant is extracted from IP-LP cross-over and the condensate return from the MEA-based CO2 capture plant is returned to the steam
cycle at the deaerator.
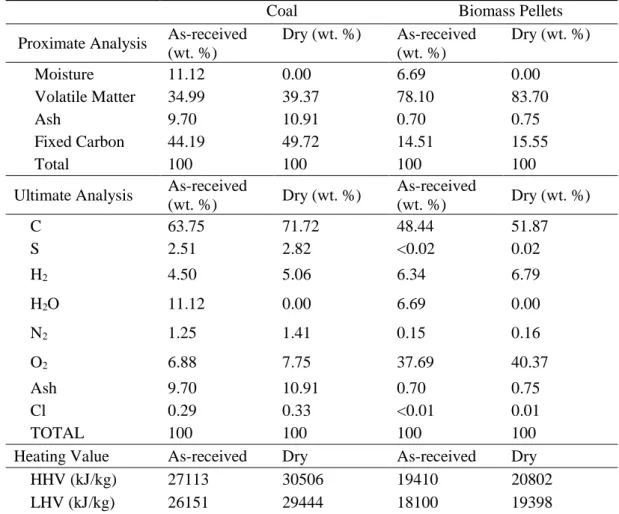
Table 2 Proximate, ultimate and heating value of coal (Black, 2010) and biomass (Al-Qayim et al., 2015).
Coal Biomass Pellets
Proximate Analysis As-received (wt. %)
Dry (wt. %) As-received (wt. %)
Dry (wt. %)
Moisture 11.12 0.00 6.69 0.00
Volatile Matter 34.99 39.37 78.10 83.70
Ash 9.70 10.91 0.70 0.75
Fixed Carbon 44.19 49.72 14.51 15.55
Total 100 100 100 100
Ultimate Analysis As-received
(wt. %) Dry (wt. %)
As-received
(wt. %) Dry (wt. %)
C 63.75 71.72 48.44 51.87
S 2.51 2.82 <0.02 0.02
H2 4.50 5.06 6.34 6.79
H2O 11.12 0.00 6.69 0.00
N2 1.25 1.41 0.15 0.16
O2 6.88 7.75 37.69 40.37
Ash 9.70 10.91 0.70 0.75
Cl 0.29 0.33 <0.01 0.01
TOTAL 100 100 100 100
Heating Value As-received Dry As-received Dry
HHV (kJ/kg) 27113 30506 19410 20802
LHV (kJ/kg) 26151 29444 18100 19398
fabric filters for removing the solid contaminants. Then the flue gas enters the FGD unit for SO2 removal before it enters the CO2 capture assembly.
2.2.1 Emission Control Technologies
The SCR unit uses ammonia with catalysts for the conversion of the NOx pollutant into nitrogen and water. The SCR unit removes 86 % of the NOx released during combustion with 2 ppmv of the ammonia slip at the end of the catalyst life. The number of active metals which can be used as catalyst, along with temperature ranges, can be found in the literature (Black, 2010; Veatch, 1996). The principal reactions involved in the SCR unit are as follows (Agbonghae, 2015; Veatch, 1996):
4NO + 4NH3 + O2 4N2 + 6H2O + heat (1)
2NO2 + 4NH3 + O2 3N2 + 6H2O + heat (2)
The fabric filter removes any solid particulate contaminant carried away beyond the boiler assembly by the flue gas and works at 99.8 % efficiency. The same ratio of 80/20 percent split is applied between the fly ash and the bottom ash as reported in the 2010 Report of the US Department of Energy (Black, 2010). The FGD unit is a wet limestone forced oxidation process with gypsum as a by-product. The removal efficiency of the FGD unit is 98 % and it reduces the SO2 content up to 10 ppmv (Black, 2010). The principal reactions involved in the FGD unit are as follows (Agbonghae, 2015; Veatch, 1996):
CaCO3(s) + SO2(g) + 0.5H2O CaSO30.5H2O + CO2(g) (3)
CaCO3(s) + SO2(g) + 0.5O2 + 2H2O CaSO42H2O + CO2(g) (4)
2.2.1.1 CO2 Capture Plant
The MEA-based reactive absorption and desorption are considered for the CO2 capture from the flue gas at the CO2 capture rate of 90 %. The flowsheet of the CO2 capture unit is shown in Figure 2. The CO2 capture unit consists of two absorbers and one stripper. The flue gas from the FGD unit is sent to the booster fan for the pressure increase before it is split into two streams and fed at the bottom of the absorber column. The flue gas is contacted with the lean amine solution in a counter-contact
lean/rich heat exchanger. The CO2 is stripped from the amine solution and the uncondensed CO2 stream from the condenser is sent to the CO2 compression unit. The lean amine solution flows down the stripper column and is pumped back for recirculation to the top of the absorber. Further, there is a water wash section at the top of the absorbers to remove entrained droplets of the amine solution in the treated gas exiting the absorber columns.
2.3 Biomass Fired Power Plant
The components and details of the supercritical cases of the pulverised biomass fired plant are the same as that of the coal fired plant model explored in Section 2.2. The
pulverised biomass fired plant model is also based on the 800 MWe of gross power output. The boiler, steam cycle and emission control configuration is kept the same in order to have a thorough comparison of the coal and biomass firing systems. The biomass used is US forestry residue shipped in pellet form. The proximate and ultimate analyses of the biomass used, along with heating value, are reported in Table 2 in the form of an as-received and dry basis. Biomass has 24 and 88 % lower carbon and nitrogen, respectively, while 41 and 448 % higher hydrogen and oxygen, respectively, as compared to coal. Further, biomass has approximately 28 % lower calorific value compared to coal as reported in Table 2.
Due to these varying properties of the biomass, two case studies are performed, one based on constant heat input and the other based on constant fuel flow rate. In the constant heat input case, the flow of the fuel varies to maintain the same heat transfer from the flue gas to the water/steam in the super-heater, re-heater and economiser; while for the case based on the constant fuel flow rate, the fuel flow rate to the boiler is kept constant irrespective of the fuel type, whether coal or biomass, which results in varying heat transfer to the super-heater, re-heater and economiser. The case with constant heat input results in a large increase in the fuel flow rate due to with lower heating value of biomass. The case with a constant fuel flow rate results in a
degradation of the total power output from the power plant due to the lower heating value of the fuel.
3 Modelling Strategy
Peng-Robinson with Boston-Mathias modification; the HRSG and steam side are based on IAPWS-95 property package. More details of the NGCC with and without EGR models can be found in Ali et al. (2016).
The theoretical air, excess air, air leakages and infiltration air for the constant boiler efficiency of 88 % are calculated based on recommendations found in the literature (Chou et al., 2012, 2014; Veatch, 1996). The ammonia required in the SCR unit is estimated based on the principal reactions given in Section 2.2.1, which shows that the ammonia required will be theoretically equal to the number of moles of NOx
present in the flue gas at the economiser outlet while keeping 2 ppmv of the ammonia slip into account. The limestone, O2 and make-up water required in the FGD unit are
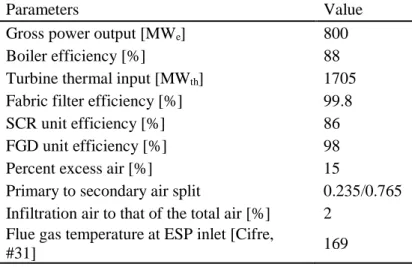
estimated based on the principal reactions mentioned in Section 2.2.3. The assumptions made during the process modelling of the different parts of the solid fuel fired power plant, including the boiler, SCR, FGD, and steam cycle section can be found in the quality guidelines for energy process system studies provided by the US Department of Energy (Chou et al., 2012, 2014). However, a summary of the input specifications, irrespective of the solid fuel fired power plant type, can be found in Table 3.
Table 3 Summary of the input specifications for the solid fuel fired power plant.
Parameters Value
Gross power output [MWe] 800
Boiler efficiency [%] 88
Turbine thermal input [MWth] 1705 Fabric filter efficiency [%] 99.8 SCR unit efficiency [%] 86 FGD unit efficiency [%] 98
Percent excess air [%] 15
Primary to secondary air split 0.235/0.765 Infiltration air to that of the total air [%] 2
Flue gas temperature at ESP inlet [Cifre,
The MEA-based CO2 capture plant model is based on second generation, rigorous rate based models. The model is based on the ENRTL-RK thermodynamic property package. The model has been extensively validated against experimental data and optimized (Agbonghae et al., 2014). The design data applied for the commercial-scale amine-based CO2 capture plant used in this paper is given in Table 4, and this is based on the optimal design data reported by Agbonghae et al. (2014) for the
commercial-scale coal fired power plant.
Table 4 Optimal design data for an amine-based CO2 capture plant (Agbonghae et al., 2014).
Parameter Value
Flue Gas Flowrate (kg/s) 821.26
Optimum Lean CO2 loading (mol/mol) 0.2
Optimum Liquid/Gas Ratio (kg/kg) 2.93
Absorber
Number of Absorbers 2
Absorber Packing Mellapak 250Y
Diameter (m) 16.13
Optimum Height (m) 23.04
Stripper
Number of Stripper 1
Packing Mellapak 250Y
Diameter (m) 14.61
Optimum Height (m) 25.62
Specific Reboiler Duty (MJ/kg CO2) 3.69
The CO2 compression system modelled is a multiple-stage compression system with inter-stage coolers and knock out drums with the total stages being 6. The CO2 compression system data for the inter-stage pressure is given in Table 5 and the final CO2 compression pressure is set at 153 bar. The CO2 compression system is modelled
based on the Lee Kesler Plocker thermodynamic property package along with assumptions mentioned by the quality guidelines for energy process system studies provided in the US Department of Energy (Chou et al., 2012, 2014). The CO2 stream cooling temperature is set at 30 oC and at the third-stage the CO2 stream is dried with a tetra ethylene glycol (TEG) unit with a H2O specification in the CO2 stream specified at 20 ppmv. The pressure drop of 2 % is specified in the knock-out drums of the CO2 compression system (Chou et al., 2012, 2014).
Stage Outlet Pressure (bar)
1 3.6
2 7.8
3 17.1
4 37.6
5 82.7
6 153.0
4 Results and Discussion
4.1 NGCC with and Without EGR Results
The NGCC power plants with and without EGR integrated with the CO2 capture and CO2 compression units, and the key performance results are shown in Table 6. During the application of the EGR to the NGCC power plant, the steam cycle configuration and parameters are kept the same. The effect of the application of the EGR on the performance of the NGCC is clear from the results presented in Table 6. The EGR application results in 35 % decrease in air and flue gas flow rate. The EGR percentage of 35 % is selected based on the recommendation made by the 2013 Report of the US Department of Energy (U.S.DOE., 2013 ).
Table 6 Summary of the key performance results for the NGCC with and without EGR integrated to CO2 capture and CO2 compression units.
Case NGCC NGCC with EGR
Natural gas [kg/s] 29.2 29.5
Air [kg/s] 1177.1 771.1
EGR percentage [%] 0 35
Recirculated gas [kg/s] - 398.8
Main steam [kg/s | bar | oC] 135 | 166.5 | 566 135 | 166.5 | 566
Reheat from furnace/boiler [kg/s | bar | oC] 98.5 | 24.8 | 566 98.5 | 24.8 | 566
Steam to stripper reboiler [kg/s | bar | oC] 110 | 5.2 | 338 108 | 5.2 | 338
Flue Gas Composition
CO2 [mol%] 4.16 6.53
H2O [mol%] 8.90 9.22
N2 [mol%] 74.23 75.76
O2 [mol%] 11.83 7.59
Ar [mol%] 0.88 0.90
CO2 Capture Plant NGCC NGCC with EGR
Rich CO2 loading [mol/mol] 0.476 0.478
CO2 captured [kg/s] 69.95 70.50
Specific reboiler duty [MJ/kg CO2] 3.933 3.841
CO2 Compression System NGCC NGCC with EGR
Total compression duty [MWe] 20.76 20.94 Total intercooling duty [MWth] 35.50 35.81
The EGR results in a 1 % increase in the fuel flow requirements which are due to the varying properties of the working fluid due to the EGR. Further the EGR results in a 57 % increase in the CO2 molar composition in the exhaust gas. The increased CO2 composition in the flue gas with its reduced flow rate, results in less solvent requirements and lower specific reboiler duty for the CO2 capture plant. The solvent flow rate and specific reboiler duty decrease by about 2.3 % in comparison to the values obtained when there is no EGR. However, the amount of the CO2 captured increases, which results in more specific CO2 compression work as shown in Table S.1 of supplementary material. Further, detailed key performance results of the NGCC with and without EGR power plants integrated with CO2 capture and CO2 compression systems are shown in Table S.1 of supplementary material for more interpretation and explanation.
Table 7 Summary of the energy performance results for the NGCC with and without EGR integrated to CO2 capture and CO2 compression units.
Case NGCC NGCC with
EGR
Fuel heat input, HHV [MWth] 1528 1543
Total power, without steam extraction [MWe] 800 800 Gas turbine power, with steam extraction [MWe] 551 550 Steam turbine power, with steam extraction [MWe] 163 160 Total power, with steam extraction [MWe] 714 665 Power output without CO2 capture and compression [MWe] 785 782
Power output with CO2 capture only [MWe] 670 672 Power output with CO2 capture and compression [MWe] 650 651
Efficiency without CO2 capture and compression [%] 51.40 50.60
Efficiency with CO2 capture only [%] 43.89 43.50
The summary of the energy performance of the NGCC with and without EGR power plants integrated with CO2 capture and CO2 compression is shown in Table 7. Specific CO2 compression work per unit of the CO2 captured increases as the amount of the CO2 captured also increases. It is evident that the net efficiency of the NGCC with EGR without CO2 capture and compression systems decreases in comparison to the NGCC without EGR. This decrease is due to higher fuel flow rate requirements. Similarly, the net efficiency of the NGCC with an EGR power plant with and without CO2 capture and compression decreases. However, the efficiency penalty of the
NGCC with EGR is less in comparison to the NGCC without EGR due to the increased specific CO2 emissions from the NGCC with an EGR power plant.
Similarly, the specific efficiency losses per unit of the CO2 captured decrease as more CO2 is captured. This decrease is 9 % of the specific efficiency losses per unit of the CO2 captured obtained through the NGCC power plant without EGR. Detailed energy performance results in the NGCC with and without EGR power plants integrated with CO2 capture and CO2 compression system are shown in Table S.2 of supplementary material for more interpretation and explanation.
Table 8 Summary of the key performance results for the pulverised supercritical coal and biomass fired power plants integrated with CO2 capture and CO2 compression systems for constant heat input and constant fuel flow rate cases.
Case Constant heat
input
Constant heat Input
Constant fuel flow rate
Fuel type Coal Biomass Biomass
Coal [kg/s] 71.3 99.6 71.3
Total air [kg/s] 729 702 502
NH3 injected [kg/s] 1.7 1.1 0.8
Slag + Fly Ash [kg/s] 6.9 0.7 0.5
Main steam [kg/s | bar | oC] 630 |242.3
|593 630 |242.3 |593 452 |242.3 |593 Reheat from furnace/boiler
[kg/s | bar | oC]
514 |45.2
|593 514 |45.2 |585 367 |45.2 |593 Steam to stripper reboiler
[kg/s | bar | oC]
223 |5.07
|296 230 |5.07 |296 163 |5.07 |296 Gypsum, moisture-free [kg/s] 9.6 0.1 0.1
Flue Gas Composition
CO2 [mol%] 13.28 14.35 14.35
H2O [mol%] 15.48 14.17 14.18
N2 [mol%] 68.05 68.28 68.28
O2 [mol%] 2.37 2.38 2.37
Ar [mol%] 0.81 0.81 0.81
Flue gas, absorber inlet [kg/s] 832 803 574 Lean MEA solution, absorber
inlet [kg/s] 2403 2470 1743
Rich CO2 loading [mol/mol] 0.479 0.480 0.480
CO2 captured [kg/s] 152.0 157.1 112.1
Specific reboiler duty [MJ/kg
CO2] 3.686 3.673 3.634
CO2 Compression System
Total compression duty [MWe] 44.90 46.46 33.18 Total intercooling duty [MWth] 76.90 79.64 56.83
Table 9 Summary of the energy performance results for the pulverised supercritical coal and biomass fired power plants integrated with CO2 capture and CO2 compression systems for constant heat input and constant fuel flow rate cases.
Case Constant
heat input
Constant heat input
Constant fuel flow rate
Fuel type Coal Biomass Biomass
Fuel heat input, HHV [MWth] 1933 1933 1384 Steam turbine power, without steam
extraction [MWe] 800 800 574
Steam turbine power, with steam
extraction [MWe] 664 656 473
Power output without CO2 capture and
compression [MWe] 758 758 536
Power output with CO2 capture only
[MWe] 602 596 421
Power output with CO2 capture and
compression [MWe] 557 549 388
Efficiency without CO2 capture and
compression [%] 39.22 39.30 38.70
Efficiency with CO2 capture only [%] 31.16 30.82 30.40 Efficiency with CO2 capture and
compression [%] 28.84 28.41 28.01
Efficiency penalty with CO2 capture
only [%] 8.1 8.5 8.3
Efficiency penalty with CO2 capture and
compression [%] 10.4 10.9 10.9
Specific CO2 emissions from power
plant [g/kWh] 1092 1142 1293
Specific CO2 compression work
[MJ/kg] 0.2954 0.2957 0.2959
Specific losses per unit of CO2 captured
[%/kgs-1] 0.053 0.054 0.071
Electricity output penalty [kWh/tCO2] 257 262 228
4.2 Solid Fuel Power Plant Results
constant fuel flow rate cases are considered and the addition of the CO2 capture and CO2 compression system. The gross power output for constant heat input cases is set at 800 MWe. The key performance results for standalone coal and biomass fired supercritical power plants integrated with a CO2 capture and compression system with constant heat input and constant fuel flow rate cases are reported in Table 8 and the energy performance results for the cases are reported in Table 9.
4.2.1 Constant Heat Input Results
Constant heat input cases are performed for both subcritical and supercritical; coal and biomass fired power plants integrated with CO2 capture and CO2 compression
systems. The CO2 molar composition in the flue gas of the supercritical coal and biomass fired power plants is comparable with the CO2 molar composition reported in the literature (Al-Qayim et al., 2015; Berstad et al., 2011; Black, 2010). Due to the lower sulphur content in the biomass, the FGD unit may not be required for the biomass-fired power plant with a CO2 capture system and the requirement of the reduction of the SO2 content before the CO2 capture system can be met by a SO2 polisher using an alkali wash. Similarly, due to the low ash content, the slag and fly ash produced by the biomass fired power plant is minimal, however, the true nature and properties of the slag and fly ash cannot be predicted by the present model. The key performance results are given in Tables S.3 and S.4 of supplementary material.
Due to the lower heating value of the biomass as discussed in Section 2.3, the fuel requirement increases by 40 %. At one end, the higher fuel flowrate requirement will disturb the boiler design, on the other end it will be an issue of logistics and supply of the sustainable biomass. A 800 MWe bio-power plant operating with full capacity will require 500 tons biomass per hour equivalent to 17 lorries per hour with 30 ton each (Hetland et al., 2016). However, the CO2 composition in the flue gas also increases by approximately 8 % with about 4 % decrease in the flue gas flow rate for the biomass case due to the higher O/C ratio in the biomass compared to the coal. Further, the
biomass results in more CO2 captured due to the increased CO2 content in the flue gas, which results in increased CO2 compression auxiliary loads. The net power output
of the CO2 captured and specific losses per unit of the CO2 captured as given in Table 9. The detailed energy performance results are given in Table S.5 of supplementary
material for more interpretation and explanation. In addition, the flue gas composition at different locations of power plants integrated with CO2 capture and CO2 compression system are given in Table S.6 of supplementary material for more interpretation and explanation.
4.2.2 Constant Fuel Flow Rate Results
The constant flow rate case results in substantial de-rating of the gross and net power output from the power plants when fuel is switched from coal to biomass. The biomass
firing results in approximately 30 % rating of the power output. However, if de-rating of the power plant is acceptable to the system, there is still a substantial decrease in the net efficiency of the power plant integrated with a CO2 capture and CO2 compression system by approximately 3 %. The efficiency penalty of the constant fuel flow rate cases is the same as that observed for the constant heat input cases, as the base power output considered for comparison is the de-rated power output and not 800 MWe. The key performance results are given in Tables S.3 and S.4 of supplementary material for more interpretation and explanation. In addition, the flue gas composition at different locations of the power plants integrated with CO2 capture and CO2 compression system are given in Table S.6 of supplementary material for more interpretation and explanation.
The firing of the biomass results in an increase in CO2 content by 8 % due to higher O/C ratio in biomass resulting in less dilution due to lower air flow requirements with approximately 31 % decrease in the flue gas flow rate. The solvent requirement to scrub the decreased flow rate flue gas also decreases by 30 %. The amount of the CO2 captured also decreases, which results in a considerable increase in specific CO2 compression work per unit of the CO2 captured and specific losses per unit of the CO2 captured. Due to the lower sulphur content in the biomass and lower biomass flow
rate in comparison to what is required, the FGD unit may not be required for the biomass-fired power plant with a CO2 capture system; instead the requirement of the
biomass fired power plant is minimal, however, the true nature and properties of the slag and fly ash cannot be predicted by the present model. Detailed energy performance results are given in Table S.5 of supplementary material.
Figure 3 Net efficiencies and efficiency penalty of different power plant models integrated with CO2 capture and CO2 compression systems (where vertical bars indicate the efficiency penalty; CCP: CO2 capture plant; CCU: CO2 compression unit; CHI: Constant heat input; and CFF: Constant fuel flow rate).
5 Comparative Potential
The results and discussion presented in Section 4 for the different power plant cases modelled with CO2 capture and CO2 compression systems show that the standalone
NGCC and/or NGCC with CO2 capture and CO2 compression system results in a higher net efficiency with the least CO2 emissions. However, the least efficiency penalty due to the integration of the power plant with CO2 capture and CO2 compression systems is observed for the NGCC with an EGR power plant. This is due to the fact that for the NGCC with an EGR power plant, the auxiliary loads of the CO2 capture system decrease due to the lower flue gas flow rate. The net efficiency of different power plants modelled, along with the efficiency penalty due to integration of the CO2 capture and CO2 compression systems, is shown in Figure 3.
Biomass fired power plants result in higher efficiency penalty along with higher specific CO2 emissions. This is due to the low flowrate of the flue gas to the absorber
with higher CO2 concentration, the specific CO2 emissions are higher and this results
in higher specific CO2 captured for the biomass fired power plants. Further, due to the
is higher, 157 kg/s for the biomass case in comparison to the coal fired, NGCC and
NGCC with EGR having a CO2 captured amount of 152, 69.95 and 70.50 kg/s,
respectively. Thus, higher specific CO2 emissions results in higher specific CO2
capture, resulting in higher power requirement by CO2 compressor system. The
specific CO2 emissions without capture and specific CO2 captured for different power plant models are shown in Figure 4 where the hatched regions show the CO2 captured. The coal and biomass fired power plants also shown higher specific CO2 captured in comparison to NGCC and NGCC with EGR power plants. It is worth noting that if
the biomass considered is sustainably-grown then it will result in zero CO2 emissions and if the CO2 capture is installed in negative CO2 emissions. Further, coal and
biomass power plants show the least specific losses per unit of the CO2 captured. The specific losses per unit of the CO2 captured for coal and biomass fired power plants with CO2 capture and CO2 compression systems are approximately half in comparison to the NGCC and NGCC with EGR integrated with CO2 capture and CO2 compression system.
The power plant case with a constant fuel flow rate resulted in substantial power de-rating while the power plant with constant heat input case resulted in higher fuel flow rate requirements. From the specific CO2 captured and specific losses per unit of CO2 captured, the coal and biomass fired power plant with CCS are the most favourable options provided the changes required in the power plant due to fuel switch to biomass are ready to be adopted. However, in the present scenario of gas-CCS interest, NGCC coupled to CO2 capture and CO2 compression systems will be an attractive option to adopt due to the lower efficiency penalty.
7 Conclusions
This study has investigated the comparative potential of five different cases of power
plants integrated to a MEA-based CO2 capture system and a CO2 compression unit for
natural gas firing with and without EGR, supercritical coal and biomass firing for
constant heat input and constant fuel flow rate cases. For consistency, the gross power
output was maintained at 800 MWe for most of the cases, except the CFF case, and
the modelled and simulated results lead to the following conclusions:
The biomass firing results in about 40 % increase in the fuel flow rate for the constant heat input case due to the lower heating value of the biomass and
about 30 % derating of the power output for the constant fuel flow rate case.
The FGD unit may not be required since the sulphur content in the biomass is
less than coal and the limitation of removing the SO2 to the required level can
be simply achieved by the SO2 polisher present in the CO2 capture plant.
Further, due to the low sulphur content in the biomass the by-product gypsum
production decreases by 98.9 %.
The NGCC and NGCC with EGR integrated with the CO2 capture and CO2
compression system shows higher net efficiency, 42.53 and 42.15 %,
respectively, and the least efficiency penalty reduction of 8.9 and 8.5 %,
respectively in comparison to the coal and biomass fired power plants
integrated with a CO2 capture and CO2 compression system having higher net
efficiency of 28.84, 28.41 % and efficiency penalty of 10.4 and 10.9 %
respectively.
Coal and biomass fired power plants when integrated with a CO2 capture and
CO2 compression system, results in higher specific CO2 capture due to the
specific losses per unit of the CO2 captured of 0.053, 0.054 or 0.071 %/kgs-1,
respectively in comparison to the NGCC with and without EGR integrated
with a CO2 capture and CO2 compression system having specific losses per
unit of the CO2 captured of 0.11 and 0.10 %/kgs-1, respectively. A standalone
biomass power plant integrated with a CO2 capture and CO2 compression
system will result in negative emissions if the biomass is sustainably-grown.
Nomenclature
Abs absorber
APH air preheater
CCP CO2 capture plant
CCS carbon capture and storage
CCU CO2 compression unit
CFF constant fuel flowrate
CHI constant heat input
EGR exhaust gas recirculation
EM economiser
ESP electro Static Precipitator
FGD flue Gas Desulphurization
FWH feedwater heater
GHG greenhouse gases
HHV higher heating value
HP high Pressure
HRSG heat recovery steam generator
ID induced Draft
IECM Integrated Environmental Control Model
IP intermediate Pressure
LHV lower heating value
LP low Pressure
NGCC natural gas combined cycle
RH reheater
SCR selective Catalytic Reduction
SH superheater
WWC water wash column
TEG tetra ethylene glycol
Acknowledgements
U Ali acknowledges the grant provided by the University of Engineering and Technology, Lahore Pakistan and the partial support by the University of Sheffield, UK for this research.
References
Abu-Zahra, M.R., Niederer, J.P., Feron, P.H., Versteeg, G.F., 2007a. CO2 capture from power plants: Part II. A parametric study of the economical performance based on mono-ethanolamine. International journal of greenhouse gas control 1, 135-142.
Abu-Zahra, M.R., Schneiders, L.H., Niederer, J.P., Feron, P.H., Versteeg, G.F., 2007b. CO2 capture from power plants: Part I. A parametric study of the technical performance based on monoethanolamine. International Journal of Greenhouse gas control 1, 37-46.
Agbonghae, E.O., 2015. Modelling and Optimization of Coal-Fired Power Plant Generation Systems with CO2 Capture School of Chemical and Process Engineering. PhD Thesis, University of Leeds, Leeds, UK, p. 301.
Agbonghae, E.O., Hughes, K.J., Ingham, D.B., Ma, L., Pourkashanian, M., 2014. Optimal Process Design of Commercial-Scale Amine-Based CO2 Capture Plants. Industrial & Engineering Chemistry Research 53, 14815-14829.
Al-Qayim, K., Nimmo, W., Pourkashanian, M., 2015. Comparative techno-economic assessment of biomass and coal with CCS technologies in a pulverized combustion power plant in the United Kingdom. International Journal of Greenhouse Gas Control 43, 82-92. Aroonwilas, A., Veawab, A., 2007. Integration of CO2 capture unit using single-and blended-amines into supercritical coal-fired power plants: implications for emission and energy management. International Journal of Greenhouse Gas Control 1, 143-150.
Baxter, L., 2005. Biomass-coal co-combustion: opportunity for affordable renewable energy. Fuel 84, 1295-1302.
Berstad, D., Arasto, A., Jordal, K., Haugen, G., 2011. Parametric study and benchmarking of NGCC, coal and biomass power cycles integrated with MEA-based post-combustion CO< sub> 2</sub> capture. Energy Procedia 4, 1737-1744.
Botero, C., Finkenrath, M., Bartlett, M., Chu, R., Choi, G., Chinn, D., 2009. Redesign, Optimization, and Economic Evaluation of a Natural Gas Combined Cycle with the Best Integrated Technology CO2 Capture. Energy Procedia 1, 3835-3842.
Chou, V., Keairns, D., Turner, M., Woods, M., Zoelle, A., 2012. Quality guidelines for energy system studies: process modeling design parameters (National Energy Technology Laboratory) NETL. DOE-341/051314 pp 13 21.
Chou, V., Keairns, D., Turner, M., Woods, M., Zoelle, A., 2014. Quality guidelines for energy system studies: process modeling design parameters (National Energy Technology Laboratory) NETL. DOE-341/051314 pp 13 21.
Cifre, P.G., Brechtel, K., Hoch, S., García, H., Asprion, N., Hasse, H., Scheffknecht, G., 2009. Integration of a chemical process model in a power plant modelling tool for the simulation of an amine based CO2 scrubber. Fuel 88, 2481-2488.
De, S., Assadi, M., 2009. Impact of cofiring biomass with coal in power plants - A techno-economic assessment. Biomass and Bioenergy 33, 283-293.
D A S E C
Management 44, 1465-1479.
Demirbas, M.F., Balat, M., Balat, H., 2009. Potential contribution of biomass to the sustainable energy development. Energy Conversion and Management 50, 1746-1760. Domenichini, R., Gasparini, F., Cotone, P., Santos, S., 2011. Techno-economic evaluation of biomass fired or co-fired power plants with post combustion CO2 capture. Energy Procedia 4, 1851-1860.
DRAX, 2016. www.drax.com.
Duan, L., Zhao, M., Yang, Y., 2012. Integration and optimization study on the coal-fired power plant with CO2 capture using MEA. Energy 45, 107-116.
Eisentraut, A., Brown, A., 2012. Technology roadmap bioenergy for heat and power. International Energy Agency, IEA Renewable Energy Division.
ETI, 2016. The evidence for deploying Bioenergy with CCS (BECCS) in the UK - An insights report from the Energy Technologies Institute. Energy Technologies Institute, United Kingdom.
Faaij, A.P., 2006. Bio-energy in Europe: changing technology choices. Energy policy 34, 322-342.
Gibbins, J., Crane, R., 2004. Scope for reductions in the cost of CO2 capture using flue gas scrubbing with amine solvents. Proceedings of the Institution of Mechanical Engineers, Part A: Journal of Power and Energy 218, 231-239.
H D P B C Y H B R H exergy analysis for
a supercritical high-ash coal-fired power plant integrated with a post-combustion carbon capture process. Fuel 134, 126-139.
Hasan, M.F., Baliban, R.C., Elia, J.A., Floudas, C.A., 2012. Modeling, simulation, and optimization of postcombustion CO2 capture for variable feed concentration and flow rate. 1. Chemical absorption and membrane processes. Industrial & Engineering Chemistry Research 51, 15642-15664.
Hetland, J., Yowargana, P., Leduc, S., Kraxner, F., 2016. Carbon-negative emissions: Systemic impacts of biomass conversion: A case study on CO2 capture and storage options. International Journal of Greenhouse Gas Control 49, 330-342.
IEA, G., 2009. Biomass CCS Study: Techno-Economic Evaluation of Biomass Fired or Co-Fired Power Plant with Post-Combustion CO2 Capture. IEAGHG: Cheltenham, UK.
IPCC, 2014. Mitigation of Climate Change. Contribution of Working Group III to the Fifth Assessment Report of the Intergovernmental Panel on Climate Change. Cambridge University Press, Cambridge, UK and New York, NY.
J K S Ã N G M A
Jonshagen, K., Sip cz, N., Genrup, M., 2010. Optimal Combined cycle for CO2 capture with EGR, ASME Turbo Expo 2010: Power for Land, Sea, and Air. American Society of Mechanical Engineers, pp. 867-875.
Khalilpour, R., Abbas, A., 2011. HEN optimization for efficient retrofitting of coal-fired power plants with post-combustion carbon capture. International journal of greenhouse gas control 5, 189-199.
Kraxner, F., Aoki, K., Leduc, S., Kindermann, G., Fuss, S., Yang, J., Yamagata, Y., Tak, K.-I., Obersteiner, M., 2014. BECCS in South Korea analyzing the negative emissions potential of bioenergy as a mitigation tool. Renewable Energy 61, 102-108.
Kumar, A., Cameron, J.B., Flynn, P.C., 2003. Biomass power cost and optimum plant size in western Canada. Biomass and Bioenergy 24, 445-464.
Lawal, A., Wang, M., Stephenson, P., Obi, O., 2012. Demonstrating full-scale post-combustion CO< sub> 2</sub> capture for coal-fired power plants through dynamic modelling and simulation. Fuel 101, 115-128.
Li, H., Ditaranto, M., Berstad, D., 2011. Technologies for increasing CO2 concentration in exhaust gas from natural gas-fired power production with post-combustion, amine-based CO2 capture. Energy 36, 1124-1133.
Liang, Z.H., Rongwong, W., Liu, H., Fu, K., Gao, H., Cao, F., Zhang, R., Sema, T., Henni, A., Sumon, K., 2015. Recent progress and new developments in post-combustion carbon-capture technology with amine based solvents. International Journal of Greenhouse Gas Control 40, 26-54.
Lucquiaud, M., Gibbins, J., 2011a. Effective retrofitting of post-combustion CO2 capture to coal-fired power plants and insensitivity of CO2 abatement costs to base plant efficiency. International Journal of Greenhouse Gas Control 5, 427-438.
Lucquiaud, M., Gibbins, J., 2011b. On the integration of CO2 capture with coal-fired power plants: a methodology to assess and optimise solvent-based post-combustion capture systems. Chemical Engineering Research and Design 89, 1553-1571.
Mac Dowell, N., Shah, N., 2014. Dynamic modelling and analysis of a coal-fired power plant integrated with a novel split-flow configuration post-combustion CO2 capture process. International Journal of Greenhouse Gas Control 27, 103-119.
McGlashan, N., Shah, N., Workman, M., 2010. The potential for the deployment of negative emissions technologies in the UK. Work stream 2.
McIlveen-Wright, D., Huang, Y., Rezvani, S., Mondol, J.D., Redpath, D., Anderson, M., Hewitt, N., Williams, B., 2011. A techno-economic assessment of the reduction of carbon dioxide emissions through the use of biomass co-combustion. Fuel 90, 11-18.
McIlveen-Wright, D., Huang, Y., Rezvani, S., Wang, Y., 2007. A technical and environmental analysis of co-combustion of coal and biomass in fluidised bed technologies. Fuel 86, 2032-2042.
McIlveen-Wright, D.R., Huang, Y., Rezvani, S., Redpath, D., Anderson, M., Dave, A., Hewitt, N.J., 2013. A technical and economic analysis of three large scale biomass combustion plants in the UK. Applied energy 112, 396-404.
McKendry, P., 2002. Energy production from biomass (part 1): overview of biomass. Bioresource technology 83, 37-46.
Mehmood, S., Reddy, B.V., Rosen, M.A., 2012. Energy analysis of a biomass co-firing based pulverized coal power generation system. Sustainability 4, 462-490.
Pachauri, R.K., Allen, M.R., Barros, V., Broome, J., Cramer, W., Christ, R., Church, J., Clarke, L., Dahe, Q., Dasgupta, P., 2014. Climate change 2014: synthesis Report. Contribution of working groups I, II and III to the fifth assessment report of the intergovernmental panel on climate change. IPCC.
Pfaff, I., Oexmann, J., Kather, A., 2010. Optimised integration of post-combustion CO2 capture process in greenfield power plants. Energy 35, 4030-4041.
Romeo, L.M., Bolea, I., Escosa, J.M., 2008. Integration of power plant and amine scrubbing to reduce CO2 capture costs. Applied Thermal Engineering 28, 1039-1046.
Sanpasertparnich, T., Idem, R., Bolea, I., Tontiwachwuthikul, P., 2010. Integration of post-combustion capture and storage into a pulverized coal-fired power plant. International Journal of Greenhouse Gas Control 4, 499-510.
S Ã N A M C CO2 capture: two alternatives for system integration. Journal of Engineering for Gas Turbines and Power 132, 061701.
Strube, R., Manfrida, G., 2011. CO2 capture in coal-fired power plants - Impact on plant performance. International Journal of Greenhouse Gas Control 5, 710-726.
Thornley, P., 2006. Increasing biomass based power generation in the UK. Energy Policy 34, 2087-2099.
Thornley, P., Rogers, J., Huang, Y., 2008. Quantification of employment from biomass power plants. Renewable Energy 33, 1922-1927.
Tontiwachwuthikul, P., Idem, R., Gelowitz, D., 2013. Recent Progress and New Developments in Post-Combustion Carbon-Capture Technology with Reactive Solvents. Future Science Book Series, Future Science Ltd., London, UK.
U.S.DOE., 2013 Current and Future Technologies for Natural Gas Combined Cycle (NGCC) Power Plants, in: [DOE/NETL-341/061013] (Ed.). U.S. Department of Energy, Washington, DC.
Van den Broek, R., Teeuwisse, S., Healion, K., Kent, T., Van Wijk, A., Faaij, A., Turkenburg, W., 2001. Potentials for electricity production from wood in Ireland. Energy 26, 991-1013. Veatch, B., 1996. Power Plant Engineering. Springer Science, New York.