White Rose Research Online URL for this paper: http://eprints.whiterose.ac.uk/91587/
Version: Accepted Version Article:
Jones, C., Elgueta, H. and Eiser, J. (2015) Reconciling nuclear risk: The impact of the Fukushima accident on comparative preferences for nuclear power in UK electricity generation. Journal of Applied Social Psychology. ISSN 1559-1816
https://doi.org/10.1111/jasp.12359
This is the peer reviewed version of the following article: Jones, C. R., Elgueta, H. and Eiser, J. R. (2015), Reconciling nuclear risk: the impact of the Fukushima accident on comparative preferences for nuclear power in U.K. electricity generation. Journal of Applied Social Psychology. doi: 10.1111/jasp.12359, which has been published in final form at https://dx.doi.org/10.1111/jasp.12359. This article may be used for non-commercial purposes in accordance with Wiley Terms and Conditions for Self-Archiving
(http://olabout.wiley.com/WileyCDA/Section/id-820227.html)
eprints@whiterose.ac.uk https://eprints.whiterose.ac.uk/
Reuse
Unless indicated otherwise, fulltext items are protected by copyright with all rights reserved. The copyright exception in section 29 of the Copyright, Designs and Patents Act 1988 allows the making of a single copy solely for the purpose of non-commercial research or private study within the limits of fair dealing. The publisher or other rights-holder may allow further reproduction and re-use of this version - refer to the White Rose Research Online record for this item. Where records identify the publisher as the copyright holder, users can verify any specific terms of use on the publisher’s website.
Takedown
If you consider content in White Rose Research Online to be in breach of UK law, please notify us by
1
Accepted for publication by the JOURNAL OF APPLIED SOCIAL
PSYCHOLOGY (17th September 2015)
Reconciling nuclear risk: The impact of the Fukushima accident on comparative preferences for nuclear power in UK electricity generation.
Christopher R. Jones*, Herman Elgueta, J. Richard Eiser
University of Sheffield, UK
*Corresponding Author
Environment and Behaviour Research Group Department of Psychology
University of Sheffield Western Bank
Sheffield, S10 2TP United Kingdom
2
Abstract
Polls conducted in the UK following the Fukushima nuclear accident (March 2011) indicated a fairly muted and temporary shift in public approval of nuclear power. The present study investigated how: (a) comparative preferences for nuclear power in the UK might have been affected by the accident; and (b) how ‘supporters’ of nuclear power reconciled their pro-nuclear attitude in the wake of the disaster. Between-subjects comparisons with a pre-Fukushima sample revealed our post-Fukushima sample to have comparable preferences for nuclear power. Further analysis suggested that ‘supporters’ retained their pro-nuclear stance in response to Fukushima by emphasising the necessity of nuclear power in the UK context. The implications for these findings are discussed.
3
Reconciling nuclear risk: The impact of the Fukushima accident on comparative
preferences for nuclear power in UK electricity generation.
1. Introduction
1.1 Policy and public responses to Fukushima
The Fukushima nuclear accident (March 11th 2011) prompted a varied energy policy response among countries utilising nuclear power or planning nuclear
programmes. While in some cases the accident stalled or curtailed plans for new nuclear power programmes (e.g. Venezuela, Italy) or produced an abrupt and negative shift in existing nuclear power programmes (i.e. Belgium, Germany & Switzerland), the majority of nations with an existing reliance on nuclear power outlined a
continuing commitment to its use (e.g. China, France, USA, UK) (see Joskow & Parsons, 2012; Ramana, 2013; Wittneben, 2012).
The public response to the Fukushima accident was equally varied and country specific (e.g. Huang et al., 2013; Kim, Kim & Kim, 2013; Poortinga, Pidgeon,
Capstick & Aoyagi, 2014). Unsurprisingly, public opinion in Japan collapsed in the wake of the accident (e.g. Aoyagi, 2013), while Germany and Switzerland also saw notable and sustained increases in public opposition in the wake of Fukushima (e.g. Siegrist & Visschers, 2013; Srinivasan & Gopi Rethinaraj, 2013; although see Visschers & Siegrist, 2013). By contrast, public opinion in other countries (e.g. Sweden, France, UK) saw more moderate and/or temporary changes, indicative of the fact that supporters of nuclear power in these countries had managed to absorb the news of the Fukushima accident and yet retain a positive attitude towards its use in power generation.
4
UK sample recruited at the University of Sheffield. We start by outlining more about the nature of pre-and post-Fukushima attitudes towards nuclear power in the UK, before reporting on the findings of a survey-based study designed to: (a) learn more about the beliefs underlying supporters’ and non-supporters’ (i.e. others)
post-Fukushima attitudes to nuclear power; and (b) establish what impact these beliefs may have had upon preferences for nuclear power as an electricity generating option for the UK.
1.2 Public Attitudes to Nuclear Power in the UK
1.2.1 Pre-Fukushima. Since coming into commercial operation in the 1950s, public attitudes towards nuclear power have “waxed and waned” (Corner et al., 2011, p.4826), with high profile nuclear incidents (e.g. Chernobyl) and fears of proliferation quelling some of the initial enthusiasm for the technology (Eiser, van der Pligt & Spears, 1995). From the start of this century until the Fukushima accident, however, polls indicated an overall decline in opposition to the technology (e.g. Ipsos MORI, 2009; Knight, 2005; Pidgeon, Lorenzoni & Poortinga, 2008). Importantly, though, research indicated that this decreased opposition might be due in part to an increasing ‘reluctant acceptance’ of nuclear power due to its potential in tackling perceptively larger risks like climate change and energy security (see Bickerstaff, Lorenzoni, Pidgeon, Poortinga & Simmons, 2008; Corner et al., 2011).
1.2.2 Post-Fukushima. There was a dip in public support for nuclear power
within the UK immediately following the Fukushima accident (see Figure 1); however, this dip was only moderate and short-lived (e.g. Foratom, 2014; Ipsos MORI, 2011, 2012; Poortinga et al., 2014). The apparently muted impact of Fukushima on public opinion was consistent with the political response to the
5
of the electricity generated in the UK (Department of Energy and Climate Change [DECC], 2012). Moreover, there was general political support for nuclear power; with the then Conservative-Liberal Democrat coalition government having inherited and retained a pro-nuclear policy from the previous Labour administration (see Jones, Eiser & Gamble, 2012). Immediately following the events at Fukushima, the UK Government was quick to reaffirm its commitment to the use of nuclear power in electricity generation; alongside an equally strong commitment to ensuring stringent safety, decommissioning, planning and licensing procedures (Office of Nuclear Regulation [ONR], 2011a; 2011b).
[FIGURE 1 ABOUT HERE]
The moderate effect of Fukushima on UK public opinion, while perhaps unanticipated by some, is consistent with some attitude studies conducted in the UK post-Chernobyl (see De Boer & Catsburg, 1988; Eiser, Spears & Webley, 1989; Eiser et al., 1995). For example, De Boer and Catsburg (1988) noted only temporary shifts in British opposition and support for nuclear power following Chernobyl. Likewise, Eiser et al. (1989), while observing an overall negative shift in attitudes to nuclear power in a community living close to a nuclear power station, noted that this shift was fairly small in absolute terms and was strongly related to people’s general attitudes towards the technology. That is, individuals with more pro-nuclear attitudes were less likely to evaluate Chernobyl as catastrophic compared with those who were more anti-nuclear. Hohenemser and Renn (1988) noted similar stability in post-Chernobyl attitudes in some other nations with active nuclear programmes (e.g. USA, France, Sweden) (although see also, Renn, 1990).
6
from the resistance of attitudes to fundamental change. They reasoned that people’s assimilation of information about the Chernobyl accident into existing knowledge structures (which in the UK during the 1980s were already comparatively pre-formed) had both: (a) dampened the absolute impact of the event on people’s attitudes; and (b) shaped the interpretation of the event to conform with existing beliefs about the technology (see also Eiser et al., 1990).
Eiser and colleagues (1995) suggested that while Chernobyl confirmed opponents’ existing beliefs that nuclear power was hazardous, proponents of the technology (i.e. public supporters and representatives of the British nuclear industry) sought to resolve the cognitive inconsistency presented by the accident in ways akin to Abelson’s (1959) ‘modes of resolution’ for belief dilemmas: denial, differentiation,
bolstering and transcendence. More specifically, proponents were seen to defend their supportive position by: (a) discounting the event as rare (denial); (b) seeing the event as being of limited/less relevance to the UK context (differentiation); (c) by
emphasising the perceived benefits of nuclear power (bolstering); or (d) by reframing the accident as something that would have long-term benefits for the sector as a whole (e.g. increased regulation) (transcendence) (see also Abelson et al., 1968).
In sum, UK polls conducted in the wake of Fukushima indicated fairly short-lived changes to public support for the technology in the UK. This echoes the results of surveys conducted in the wake of Chernobyl. Taken together, these findings suggest that in spite of the magnitude of the Fukushima disaster, people’s general attitudes towards nuclear power in the UK showed little long-term change. With this in mind it appears as though extant supporters of nuclear power in the UK had managed to reconcile the disaster in order to retain a supportive position.
7
The present research was conducted on a convenience sample of respondents from Sheffield, UK, approximately one-month after the Fukushima disaster (April-May, 2011). Reporting on the disaster was still prominent within the news media at this time. The study used an online survey-based method and was designed to
understand more about how nuclear power supporters might have reconciled the news of Fukushima in order to retain a favourable attitude.
In contrast to traditional energy surveys, which ask participants to register their opinions towards different electricity generation options (e.g. nuclear power, coal power) in isolation from one another; the current research included an ‘electricity calculator’ task as a primary dependent variable (see Jones, Eiser & Gamble, 2012). This task allows for the simultaneous investigation of preferences for a number of energy options in a context where rejection of all options is not feasible. In doing so the ‘electricity calculator’ provides insight into the trade-offs that people will endorse or tolerate when faced with the challenge of meeting a specified goal (e.g.
hypothetical demand for electricity) from a restricted number of options.
The added realism provided by comparative and/or scenario-based methods (like the ‘electricity calculator’) means that they are becoming an increasingly popular means of assessing public attitudes towards complex issues, including energy system change (see Fleishman, Bruine, de Bruin & Morgan, 2010; Parkhill, Demski, Butler, Spence & Pidgeon, 2013; Truelove, 2012).
2. Method
2.1 Participants and recruitment
8
advertised as investigating opinions about current and future electricity generation in the UK. The survey took approximately 10-15 minutes to complete. The volunteers list used to recruit respondents directly contacts all staff (academic and non-academic) and students (postgraduate and undergraduate) who have not opted out of receiving emails about volunteering opportunities.
Of the 146 respondents, 76 (54.3%) were male and 64 (45.7%) were female. Respondents were aged between 21 and 63years old (M = 40 years; SD = 11.6 years). The majority of respondents (n = 129, 92.1 %) felt that either ‘some’ or ‘every’ action should be taken to mitigate climate change; nine respondents (6.5%) thought that either ‘no’ or ‘other’ action should be taken, and two (1.4%) were unsure. All respondents’ claimed they had some knowledge of UK power generation; however, only 30% (n = 42) stated having ‘a fair amount’ or ‘a lot’ of knowledge, the other 70% (n = 98) having ‘some’ or ‘very little’ knowledge.
The majority of respondents classified themselves as British (n = 125, 89.3%), with eight (5.7%) coming from other European countries and two (1.4%) from non-European countries (n = 5, 3.6% of respondents did not respond). In terms of ethnicity, 131 (93.5%) classified themselves as White, with six (4.3%) classifying themselves as being of Black or Asian heritage (n = 3, 2.1% of respondents did not respond).
Around two-thirds of respondents (n = 88, 62.9%) registered a clear political voting preference. Of these, there were 14 Conservative (centre-right), 23 Liberal Democrat (centre), 31 Labour (centre-left), and 16 Green Party (left) voters with four who registered voting preferences for other parties (e.g. UK Independence Party). The remaining participants were either not politically active, had no preference or
9
2.2 Procedure
2.2.1 Initial (pre-mix) information. Upon following the link to the online survey respondents received further instructions about the survey and were made aware of the focus on nuclear power. Respondents were first asked to register their support for the use of five energy sources used in UK power generation (i.e., coal, gas, nuclear, renewables, and electricity import) (5-point scales: Strongly support to
Strongly oppose) before receiving brief information about: (a) the general importance of energy for the UK; (b) the fact that the UK electricity mix contains nuclear power; and (c) the UK government’s view that nuclear power should continue to play a role in UK power generation.
2.2.2 The ‘electricity calculator’ task. Respondents then completed the ‘electricity calculator’ task.1 During the task, respondents were asked to create their preferred electricity generating mix for the UK using the five energy sources to which they had just registered their level of support (see Figure 2). Respondents created their electricity mix by adjusting sliding scales associated with the various energy sources to their preferred level. The contribution made by each of the sources was initially set to 0%. Respondents had to meet 100% of hypothetical demand before they could
1
Before completing the task, respondents were randomly assigned to one of three ‘framing’ conditions
(replicating Jones et al., 2012) with the intention ofinvestigating the effect that short passages of text
(focussed on the carbon-reduction [climate frame] or energy security [security frame] potential of
nuclear power vs. a control condition) would have on the preferred electricity mixes of respondents
(see Jones et al., 2012 for details of the passages used). One-way ANOVAs indicated that respondents’
initial preferences for each energy source (ps ≥ .53) and their reliance on each source in the ‘electricity
calculator’ task did not differ significantly between conditions (ps ≥ .22). This latter finding indicated
that the framing had had no appreciable impact on respondents’ decisions and thus the conditions were
10
proceed and could not be more than 50% reliant on any one energy source. These restrictions ensured that respondents had to be reliant on at least two of the energy sources to create a viable electricity mix (for full details of the task, see Jones et al., 2012).
[FIGURE 2 ABOUT HERE]
2.2.3 Questionnaire-based survey. After completing the ‘electricity calculator’ task, respondents were asked to respond to a series of survey questions before receiving a full, automated debrief about the study aims. The following section details of the survey items that were used in the subsequent statistical analysis (see Appendix 1 for full wording and response options).
Energy source preferences. Respondents first commented on their decisions
within the ‘electricity calculator’ task. Specifically they were asked about the extent to which they agreed or disagreed that they had sought to: (a) ‘limit the contribution made by [energy source]’ and (b) ‘meet a large proportion of demand with [energy source]’ each of the available energy sources (coal and gas were considered together as ‘fossil fuels’). Having reverse coded the ‘limit the contribution’ items, the pairs of items relating to each energy source showed good to excellent internal consistency
(Cronbach’s alphas, α≥ .69). Thus, composite ‘calculator decision’ measures were
formed for each of the energy source options.
Contextual features. Respondents were also required to register their beliefs
about the extent to which their ‘electricity calculator’ decisions had been influenced by: (a) the information preceding the ‘electricity calculator’ task (pre-mix
11
reduction option within the task had artificially elevated respondents’ reliance on nuclear power as they attempted to create a viable mix.
General trust and knowledge. Respondents were then asked to register their
self-proclaimed knowledge about UK power generation and to answer six questions relating to their trust in the UK government regarding new nuclear build. The trust items specifically related to government transparency and responsiveness around policy and siting decisions regarding future nuclear power stations in the UK. These
six items formed a single reliable measure of ‘general trust’ (Cronbach’s alpha, α =
.95).
Climate change and energy security. Respondents were required to register their level of (dis-)agreement in the belief that each of climate change and energy security present critical challenges for the UK; and their level of (dis-) agreement that nuclear power could play an important role in reducing greenhouse gas (GHG) emissions and improving security and reliability of energy supply. Respondents were also asked to register their general opinions about the extent of the action needed, if any, to address climate change.
Post-disaster nuclear power belief scale. Respondents completed an adapted
12
Demographics. Respondents provided their age, gender, nationality, political
voting preference and ethnic origin.
3. Results
3.1 Pre-Fukushima vs. Post-Fukushima analysis
To gauge what impact Fukushima might have had upon comparative
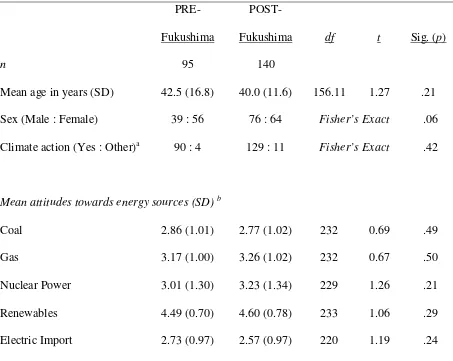
preferences for nuclear power in UK power generation (vs. other energy options), the responses from our post-Fukushima sample were compared with those of a separate pre-Fukushima sample recruited one year before the disaster (07/01/10 - 20/04/10) (see Jones et al., 2012, Study 3). While the pre- and post-Fukushima samples were recruited via different means, between-subjects comparisons revealed that the respondents were comparable in terms of their mean age (p = .21), gender (p = .06), perceived need for action on climate change (p = .42) and attitudes toward the five energy sources in the electricity calculator (p = .21 to p = .50) (see Table 1 for relevant means, SDs and t-values).
[TABLE 1 ABOUT HERE]
Independent samples t-tests performed on the electricity calculator decisions revealed that the pre- and post-Fukushima groups were responding similarly with regards to their inclusion of Coal, t(233) = 0.41, p = .68; Gas, t(233) = 1.17, p = .24; Nuclear, t(233) = 1.10, p = .27; and Renewables, t(233) = 0.45, p = .65. Respondents in the post-Fukushima group did, however, include significantly less electricity import, t(233) = 2.26, p = .03. See Figure 3 for the mean ‘electricity calculator’ mixes for the pre- and post-Fukushima groups.
[FIGURE 3 ABOUT HERE]
13
design); at an aggregate level the evident similarities in the energy preferences of our pre- and post-Fukushima samples would appear to be consistent with the findings of national polls (e.g., Foratom, 2014; Ipsos MORI, 2011), which indicate that the Fukushima accident had a fairly nominal impact on attitudes to nuclear power in the UK.
3.2 Post-Fukushima nuclear power ‘supporter’ vs. ‘other’ analysis
Analysis of attitudes towards nuclear power in the post-Fukushima sample revealed that half the sample (51.4%, n = 72) were supportive of the use of nuclear power in UK power generation, while 17.9% (n = 25) were neither supportive nor opposed to its use, and 28.6% (n = 40) were opposed (2.1% did not respond to this question and were removed from the subsequent analyses). Of particular interest to this research question was how supporters of nuclear power had retained a pro-nuclear attitude following Fukushima, so the sample was collapsed into two broad groups for the subsequent analyses: ‘supporters’ (n = 72) and ‘others’ (n = 65).
3.2.1 Electricity mix analysis. Independent samples t-tests were used to compare the preferred electricity mixes of the ‘supporters’ and ‘others’. See Figure 4 for the mean electricity mixes created by each group. While there were significant differences in the groups’ use of gas (p < .001), nuclear power (p < .001), renewables (p < .001) and electricity import (p = .001); there was no significant difference in the relative reliance on coal (p = .57) (see Table 2 for relevant means, SDs and t-values). In spite of the Fukushima accident, ‘supporters’ favoured a principal reliance on nuclear power (36.5%) and renewables (30.3%), while ‘others’ favoured a principal reliance on renewables (44.6%) and gas (23.2%).
14
3.2.2 Post-mix questionnaire responses. Independent samples t-tests were conducted to investigate the extent to which participants in each attitude group (i.e. ‘supporters’ vs. ‘others’) indicated that their decisions within the ‘electricity calculator’ task had been affected by: (1) their energy source preferences;and (2)
contextual features relating to the task. Similar tests were also used to compare the groups in terms of their post-mix responses on items relating to: (3) general trust and knowledge and(4) climate change and energy security (see Section 2.2.3 for details).
For the means, standard deviations, t-values and p-values for all tests, see Table 2. Energy source preferences. Responses corroborated the trends seen in the preferred mixes of each participant group. ‘Supporters’ registered a strong desire to meet demand through nuclear power, while the ‘others’ wished to avoid reliance on nuclear power. Both groups favoured a high reliance on renewables, however, the ‘others’ were significantly more preferable to their use. Both groups rejected a reliance on electricity import; however, the ‘supporters’ were significantly less preferable to its use. There was no difference in terms of participants’ stated reliance on the ‘fossil fuels’, with both groups favouring a fairly low reliance on these sources.
15
that the lack of a demand reduction option had not affected their decisions within the task.
Climate change and energy security. Each group agreed that tackling climate change and ensuring energy security were critical challenges for the UK. While the ‘others’ were more concerned about the issue of climate change relative to the ‘supporters’, the opposite was true with regards to energy security. ‘Supporters’ tended to agree that nuclear power could help to reduce greenhouse gas (GHG) emissions and increase energy security, while the ‘others’ were more sceptical about the utility of nuclear power in both these regards.
Knowledge and trust.‘Supporters’ claimed to know more than the ‘others’ about how electricity is generated in the UK. Both groups were equally ambivalent in terms of their general trust in government regarding new nuclear build.
3.2.3 Post-disaster nuclear power belief items. Responses to the 16 items assessing respondents beliefs about nuclear power in the UK (see Eiser et al., 1989; 1995) were then analysed. Anti-nuclear items were reverse coded so that higher values for all items equated to more favourable evaluations of nuclear power.2 While the 16-item scale had excellent internal consistency (Cronbach’s alpha, α = .93), in
order to understand more about nature of public opinion in the wake of Fukushima, we divided this scale into four sub-scales based upon the principal themes of the items: (a) general safety (items: 1, 4, 14, 15); (b) necessity of nuclear power for UK power generation (items: 2, 5, 12, 16); (c) socio-economic importance of nuclear power (items: 3, 9, 13); and (d) nuclear disaster risk (items: 6, 7, 8, 10). Each of these sub-scales had acceptable to excellent internal consistency (Cronbach’s alphas, α≥
2
Don’t know (DK) responses were treated as missing data for this analysis: Item 13 = 27 (19.7%); item
16
.67) and so the items relating to each theme were collapsed to form composite measures for use in the subsequent analysis. For Cronbach’s alpha values and ‘supporter’ and ‘other’ means for each composite measure, see Table 3.
Independent samples t-tests of the composite items revealed that ‘supporters’ were more preferable to nuclear power on all counts (ps < .001). That is, ‘supporters’ were: (a) more confident in the general safety of the UK nuclear power industry; (b) more convinced of the necessity of nuclear power for UK power generation; (c) more assured of the socio-economicimportance of nuclear power to the UK; and (d) less convinced of the likelihood of a future Fukushima-type nuclear disaster occurring (at least in Europe or the UK). See Table 3 for relevant means, t-values and p-values.
3.3 Identifying the key predictors of the reliance on nuclear power within the
‘electricity calculator’ task
A hierarchical multiple linear regression (MLR) analysis (pairwise deletion) was conducted to evaluate the extent of the impact of each of the abovementioned variables on respondents’ inclusion of nuclear power within the ‘electricity calculator’ task. We were interested in which variables would remain predictive of respondents’ inclusion of nuclear power in the task in addition to their initial (i.e. pre-mix) attitude grouping (i.e. ‘supporter’ vs. ‘other’). Thus, controlling for initial attitude group (dummy coded: ‘supporters’ 1; ‘others’ 0) at Step 1, we entered each of the following continuous variables as independent predictors of nuclear power inclusion (Step 2).3
Contextual features
3
The post-mix ‘energy source preference’ item relating to inclusion of nuclear power was not
included. While strongly correlated with respondents’ reliance on nuclear power to meet demand in the
‘electricity calculator’ task, r(137) = .85, p < .001; this item did not shed light on the underlying
17
1. Impact of Fukushima accident on inclusion of nuclear in ‘electricity calculator’.
2. Impact of pre-mix information on inclusion of nuclear in ‘electricity calculator’.
3. Impact of knowledge of role that nuclear has in UK power generation on inclusions of nuclear in ‘electricity calculator’.
Climate change and energy security
4. Perceived criticality of climate change as challenge for UK. 5. Perceived value of nuclear power in reducing GHG emissions. 6. Perceive criticality of security of energy supply as challenge for UK. 7. Perceived value of nuclear power in improving security of energy supply.
General trust and knowledge
8. General trust in UK government in pursuing new nuclear build. 9. Self-proclaimed knowledge of UK power generation.
Nuclear power belief items
10.General safety of nuclear power (nuclear belief sub-scale 1) 11.Necessity of nuclear power for UK (nuclear belief sub-scale 2)
12.Socio-economic importance of nuclear power (nuclear belief sub-scale 3) 13.Nuclear disaster risk (nuclear belief sub-scale 4)
For model summary details including all b-values, SEs, beta-values, t-values and significances, see Table 4.
Initial attitude group was found to be a strong predictor of respondents’ inclusion of nuclear power in the ‘electricity calculator’ task, accounting for 52.8% (adj.) of the variance (Step 1). The addition of the other variables at Step 2
18
variance accounted for. In addition to initial attitude grouping (p = .014), three variables were retained as significant positive predictors of inclusion of nuclear power: (a) necessity of nuclear power (nuclear belief sub-scale 2) (p = .002); (b) self-proclaimed knowledge of UK power generation (p = .006); and (c) the belief that nuclear power could enhance security of energy supply (p = .033). The implications for these findings are discussed below.
[TABLE 4 ABOUT HERE]
4. Discussion
The aim of this study was to: (a) track how comparative preferences for nuclear power might have been affected by the Fukushima disaster; and (b) to investigate how ‘supporters’ reconciled their attitudinal position in the aftermath of the accident. While recognising the limitations of the size and convenience nature of the sample, we feel that the timing of the research (one month after Fukushima) and the nature of the measures used within the survey provide interesting insight into both these issues.
4.1 Pre-Fukushima vs. Post-Fukushima comparisons
While our pre- and post-disaster samples were recruited in different ways, there were notable similarities between them on some key demographic and attitude variables (e.g., mean age, gender, perceived need for action on climate change and mean attitudes to the five energy sources in the electricity calculator).
The comparative analysis of ‘electricity calculator’ preferences within our pre-Fukushima and post-pre-Fukushima samples indicated no significant differences between these groups in terms of their relative preferences for coal, gas, renewables and
19
power (21-24%) and low reliance on coal (12%). The only significant difference was with respect to preferences for electricity import with the post-Fukushima group (7%) opting for a significantly lower reliance on this source (10%). While speculative, this latter finding could have been a response to the Fukushima disaster, with
post-Fukushima respondents opting for a reduced reliance on ‘risky’ import from other countries in favour of ‘safer’ domestic power generation
While care should be taken in deriving conclusions about the stability of individual preferences for electricity generation options (including nuclear power) from this study – due to the between-subjects nature of the comparisons (see Midden & Verplanken, 1990) – at an aggregated level one could tentatively view our findings as confirming the relative stability of comparative preferences for nuclear power following Fukushima (even 1-2 months after the accident).
While perhaps surprising, this suggestion would not only mirror the apparent resilience of UK public opinion post-Chernobyl (e.g. De Boer & Catsburg, 1988; Eiser et al., 1995) but would fit with the ostensibly temporary nature of the shifts in public approval for nuclear power seen in the UK polls conducted in the wake of Fukushima (e.g. Foratom, 2014; Ipsos MORI, 2011, 2012).
4.2 Post-Fukushima analysis: ‘Supporters’ vs. ‘others’
20
nuclear power in the UK but, within the parameters set out in the ‘electricity calculator’ task, wished the UK to be principally reliant on this energy source.
Importantly, it was not the case that ‘supporters’ were ignorant to the events at Fukushima – there was evidence that the accident had made them consider the extent to which they included nuclear power in their preferred mix – but the absolute impact of the disaster on ‘supporter’ preferences within our sample for nuclear power was small. This is similar to the findings of research conducted in the UK immediately following Chernobyl (see Eiser et al., 1989).
Taken together, these findings indicate that the ‘supporters’ within our post-Fukushima sample were effectively able to reconcile the events at post-Fukushima in order to retain a ‘pro-nuclear’ stance.
4.3 How did ‘supporters’ retain their pro-nuclear attitudes?
Relative to the ‘others’, the ‘supporters’ were significantly more favourable to nuclear power on all the survey measures included in this study. ‘Supporters’ tended to agree that nuclear power was: (a) of use in tackling GHG emissions from power generation; (b) an option that could improve security of energy supply in the UK; (c) something of socio-economic importance to the UK, and (d) essential for UK power generation. Moreover, ‘supporters’ tended to show: (e) greater confidence in the safety of nuclear power and the UK nuclear power industry; and (f) lower perceived risk of future nuclear disasters (of the type and magnitude of Fukushima).
While this is perhaps to be expected, our subsequent multiple linear regression (MLR) analyses enabled the investigation of which beliefs in particular were
21
order to defend their supportive position, i.e. to resolve the belief-dilemma created by Fukushima (see Abelson 1959; Abelson et al., 1968).
4.3.1 Knowledge and the perceived necessity of nuclear power. In addition to initial attitude grouping (i.e. general support or opposition for nuclear power in UK power generation), three items were retained as predictors of nuclear preferences within the ‘electricity calculator’ task: (1) the perceived necessity of nuclear power as a generating option for the UK; (2) respondents’ self-claimed knowledge of UK power generation; and (3) the perceived value of nuclear power in addressing security of energy supply issues.
Necessity of nuclear power. Retention of the perceived necessity of nuclear
power within the regression model makes intuitive sense. It stands to reason that those who perceived nuclear power to be integral to UK power generation should wish to be more reliant on nuclear power within the ‘electricity calculator’ task and vice versa. However, while intuitive, we argue that the retention of this variable within the MLR in addition to initial attitude grouping perhaps also reflects the comparative nature of the decision-making context afforded by the ‘electricity calculator’ task.
Specifically, the items making up the necessity of nuclear power sub-scale generally pitched nuclear power against alternative energy-generating options (e.g.
“alternative technologies are a more sensible investment than nuclear power”,
22
Knowledge of UK power generation. Retention of knowledge of UK power
generation within the regression model is interesting. On the surface this finding would argue that those who considered themselves to be more knowledgeable about power generation (in our case the ‘supporters’) were willing to be more reliant on nuclear power in the ‘electricity calculator’ task. If true, and greater knowledge was driving greater endorsement of nuclear power in the ‘electricity calculator’ task, then this finding could help to validate the use of educational campaigns as a potential means of improving support for – or at least tolerance of – nuclear power (e.g. akin to the UK consultation on nuclear power, see Department of Business and Regulatory Reform [DBERR], 2008; Department of Trade and Industry [DTI], 2007).
There are, however, important caveats to this conclusion. Not only is there growing awareness of the weaknesses of knowledge deficit models in explaining public attitudes towards science and technology (see Sturgis & Allum, 2004) but assessment of ‘knowledge’ within the current study was subjective rather than
23
Thus, while our study did show a significant association between subjective
knowledge of UK electric power generation and endorsement of nuclear power, we would argue that further research is needed to establish which aspect(s) of
respondents’ objective knowledge (if any) might also be driving this association. Security of energy supply. Retention of this item in the MLR arguably reflects
both rising public concern with energy security in the UK and the also the conditional nature of support that people have for nuclear power. More specifically, not only has recent research confirmed that energy security a growing concern for the UK public (Demski, Poortinga & Pidgeon, 2014) but it also indicates that people’s support of nuclear power tends to be conditional on the technology’s perceived utility in addressing key issues, including energy security and climate change (e.g., Corner et al., 2011; Poortinga et al. 2014; Truelove & Greenberg, 2013).
We suggest that within the ‘electricity calculator’ task, the requirement to meet electricity demand may have highlighted the issue of energy security to
respondents. This concern could have been further augmented by perceived ‘security’ risks with some of the available energy-source options (e.g. perceived intermittency of renewables and/or the risks associated with high reliance on electricity import). If true, this context could have prompted those with greater confidence in the utility of nuclear power to address security of supply issues (in our case the ‘supporters’) to opt for a higher reliance on this option in the task.
24
concept within public discourse (Demski et al., 2014). As such, we feel that further research is required to confirm which facets of energy security are likely to shape (post-Fukushima) endorsement of nuclear power.
4.4 Limitations
A limitation of the current study pertains to the manner by which the post-Fukushima sample was recruited. In comparison to the pre-post-Fukushima sample – recruited via a nationally representative survey (see Spence et al., 2010) – post-Fukushima respondents comprised a convenience sample of university staff and students recruited via an email volunteers list. While this sampling strategy was favoured in order to respond quickly to the unfolding events in Fukushima, there are clear implications for the direct generalizability of the findings from this research. For instance, our sample is very likely to contain a disproportionate number of people with graduate and postgraduate degrees, compared to the average UK population. This in-and-of-itself might have contributed to the retention of ‘knowledge of UK power generation’ as a predictor in the MLR. We contend, however, that while care should clearly be taken when translating our current findings to non-university samples, the evident similarities in the pre- and post-Fukushima respondents’ pre-mix support for the energy sources used in the ‘electricity calculator’ task, alongside the similar gender and age distributions, do offer some assurances about the broader generalizability of the research findings.
25
2010), the availability of just five broadly-defined energy-options might have served to amplify the relationship between the perceived necessity of nuclear power and respondents’ inclusion of nuclear power in their preferred energy mix. It is possible that with a greater number of more specified options (e.g., coal with CCS and/or distinguishing between different renewables), that this relationship may have weakened. Conversely, it could be argued that in a more complex scenario that the relevance of knowledge of UK power generation as a predictor might have been further augmented. We feel that future research could usefully explore these questions.
4.5 Conclusion
26
Acknowledgments
The authors would like to thank Dr Daphne Kaklamanou, Sheffield Hallam University, for her helpful advice in planning the study and in preparing this article.
References
Abelson, R. P. (1959). Modes of resolution of belief dilemmas. Journal of Conflict Resolution, 3, 343-352.
Abelson, R. P., Aronson, E., McGuire, W. J., Newcombe, T. M., Rosenberg, M. J., & Tannenbaum, P. H. (Eds.) (1968). Theories of cognitive consistency. Chicago, IL: Rand McNally.
Aoyagi, M. (2013). Public attitudes to nuclear power and climate change in Japan. Topline findings of surveys conducted in 2007, 2011 and 2013. Tsukuba, Japan: National Institute for Environmental Studies [NIES].
Bickerstaff, K., Lorenzoni, I., Pidgeon, N. F., Poortinga, W., & Simmons, P. (2008). Reframing nuclear power in the UK energy debate: Nuclear power, climate change mitigation, and radioactive waste. Public Understanding of Science, 17(2), 145–169. doi: 10.1177/0963662506066719
Chester, L. (2010). Conceptualising energy security and making explicit its polysemic nature. Energy Policy, 38(2), 887-895. doi:10.1016/j.enpol.2009.10.039
Corner, A., Venables, D., Spence, A., Poortinga, W., Demski, C., & Pidgeon, N. (2011). Nuclear power, climate change and energy security: Exploring British public attitudes. Energy Policy, 39(9), 4823–4833.
27
De Boer, C., &Catsburg, I.(1988).The impact of nuclear accidents on attitudes toward nuclear energy. Public Opinion Quarterly, 52(2),254-261. doi: 10.1086/269100
Demski, C., Poortinga, W., & Pidgeon, N. (2014). Exploring public perceptions of energy security risks in the UK. Energy Policy, 66, 369-378.
doi:10.1016/j.enpol.2013.10.079
Department of Business and Regulatory Reform [DBERR]. (2008). The future of nuclear power: analysis of consultation responses (Pub 8653/0.8k/1/08/NP.
URN 08/534)
.
London, UK: HM Government, DBERR.Department of Energy and Climate Change [DECC]. (2012). UK energy in brief, 2012
(DECC/1.3k/07/12/NP. URN 12D/220). London, UK: HM Government, DECC. Department of Trade and Industry [DTI]. (2007). The future of nuclear power: The
role of nuclear power in a low carbon UK economy (DTI/Pub
8519/4k/05/07/NP. URN 07/970). London, UK: HM Government, DTI. Eiser, J. R., Hannover, B., Mann, L., Morin, M. van der Plight, J., & Webley, P.
(1990). Nuclear attitudes after Chernobyl. Journal of Environmental Psychology,
10(2), 101-110. doi:10.1016/S0272-4944(05)80121-5
Eiser, J. R., Spears, R., & Webley, P. (1989). Nuclear judgements before and after Chernobyl: change and judgement. Journal of Applied Social Psychology, 19(8), 689-700. doi: 10.1111/j.1559-1816.1989.tb00348.x
Eiser, J. R., van der Plight, J., & Spears, R. (1995). Nuclear neighbourhoods:
Community responses to reactor siting. Exeter, UK: University of Exeter Press. Festinger, L. (1962). A theory of cognitive dissonance. Redwood City, CA: Stanford
28
Fleishman, L. A., De Bruin, W. B., & Morgan, M. G. (2010). Informed Public Preferences for Electricity Portfolios with CCS and Other Low‐Carbon Technologies. Risk Analysis, 30(9), 1399-1410. doi: 10.1111/j.1539-6924.2010.01436.x
Foratom (2014). What people really think about nuclear energy. Brussels, Belgium: European Atomic Forum. Retrieved from:
http://www.foratom.org/jsmallfib_top/Publications/Opinion_Poll.pdf
Henkel, L. A., & Mather, M. (2007). Memory attributions for choices: How beliefs shape our memories. Journal of Memory and Language, 57(2), 163-176. doi:10.1016/j.jml.2006.08.012
Hohenemser, C., & Renn, O. (1988). Shifting public perceptions of nuclear risk: Chernobyl's other legacy. Environment: Science and Policy for Sustainable Development, 30(3), 4-45. doi: 10.1080/00139157.1988.9928895
Huang, L., Zhou, Y., Han, Y., Hammitt, J. K., Bi, J., & Liu, Y. (2013). Effect of the Fukushima nuclear accident on the risk perception of residents near a nuclear power plant in China. Proceedings of the National Academy of Sciences,
110(49), 19742-19747. doi: 10.1073/pnas.1313825110
Huijts, N. M. A., Molin, E. J. E., & Steg, L. (2012). Psychological factors influencing sustainable energy technology acceptance: A review-based comprehensive framework. Renewable and Sustainable Energy Reviews, 16(1), 525-531. Doi: doi:10.1016/j.rser.2011.08.018
Ipsos MORI. (2009). Public attitudes to nuclear energy 2009. London, UK: Ipsos-MORI. Retrieved from:
29
Ipsos MORI. (2011). Public attitudes to the nuclear industry (Ipsos MORI/10-044621-01). London, UK: Ipsos MORI. Retrieved from: https://www.ipsos- mori.com/researchpublications/researcharchive/2834/Public-attitudes-to-the-nuclear-to-the-nuclear-industry.aspx
Ipsos MORI. (2012). Nuclear energy update poll. London, UK: Ipsos MORI. Retrieved from:
https://www.ipsos- mori.com/researchpublications/researcharchive/2903/Nuclear-Energy-Update-Poll.aspx
Jones, C. R., Eiser, J. R., & Gamble, T. R. (2012). Assessing the impact of framing on the comparative favourability of nuclear power as an electricity generating option in the UK. Energy Policy, 41, 451–465. doi:10.1016/j.enpol.2011.11.006 Joskow, P. L., & Parsons, J. E. (2012). The future of nuclear power after Fukushima.
Economics of Energy & Environmental Policy, 1(2), 91-114. http://dx.doi.org/10.5547/2160-5890.1.2.7
Kim, Y., Kim, M., & Kim, W. (2013). Effect of the Fukushima nuclear disaster on global public acceptance of nuclear energy. Energy Policy, 61, 822-828. doi:10.1016/j.enpol.2013.06.107
Knight, R. (2005). What do the polls tell us? Nuclear Engineering International, 50(609), 24-25. ISSN: 0029-5507
Midden, C. J., & Verplanken, B. (1990). The stability of nuclear attitudes after Chernobyl. Journal of Environmental Psychology, 10(2), 111-119.
doi:10.1016/S0272-4944(05)80122-7
30
Office for Nuclear Regulation [ONR] (2011b). Japanese earthquake and tsunami: Implications for the UK nuclear industry (Final Report, September, 2011). London, UK: Office for Nuclear Regulation.
Parkhill, K.A., Demski, C., Butler, C., Spence, A. & Pidgeon, N. (2013) Transforming the UK energy system: Public values, attitudes and acceptability – Synthesis
report. London, UK: UK Energy Research Centre [UKERC].
Pidgeon, N. F., Lorenzoni, I., Poortinga, W. (2008).Climate change or nuclear power – no thanks! A quantitative study of public perceptions and risk framing in Britain. Global Environmental Change, 18(1), 69–85.
doi:10.1016/j.gloenvcha.2007.09.005
Poortinga, W., Pidgeon, N. F., Capstick, S., & Aoyagi, M. (2014). Public attitudes to nuclear power and climate change in britain two years after the Fukushima
accident - Synthesis report. London, UK: UK Energy Research Centre. Ramana, M. V. (2013). Nuclear policy responses to Fukushima: Exit, voice, and
loyalty. Bulletin of the Atomic Scientists, 69(2), 66-76. doi: 10.1177/0096340213477995
Renn, O. (1990). Public responses to the Chernobyl accident. Journal of
Environmental Psychology, 10(2), 151-167. doi:10.1016/S0272-4944(05)80125-2
Siegrist, M., & Visschers, V. H. (2013). Acceptance of nuclear power: The
Fukushima effect. Energy Policy, 59, 112-119. doi: 10.1016/j.enpol.2012.07.051 Spence, A., Venables, D., Pidgeon, N., Poortinga, W., & Demski, C. (2010). Public
perceptions of climate change and energy futures in Britain: Summary findings
31
Risk Working Paper 10-1). Cardiff, UK: Cardiff University, School of Psychology. Retrieved from: www.understanding-risk.org
Srinivasan, T. N., & Gopi Rethinaraj, T. S. (2013). Fukushima and thereafter: Reassessment of risks of nuclear power. Energy Policy, 52, 726-736. doi:10.1016/j.enpol.2012.10.036
Sturgis, P., & Allum, N. (2004). Science in society: Re-evaluating the deficit model of public attitudes. Public Understanding of Science, 13(1), 55-74. doi:
10.1177/0963662504042690
Truelove, H. B. (2012). Energy source perceptions and policy support: Image associations, emotional evaluations, and cognitive beliefs. Energy Policy, 45, 478-489. doi:10.1016/j.enpol.2012.02.059
Truelove, H. B., & Greenberg, M. (2013). Who has become more open to nuclear power because of climate change? Climatic Change, 116(2), 389-409. doi: 10.1007/s10584-012-0497-2
Visschers, V. H. M., & Siegrist, M. (2013). How an accident in a nuclear power plant influences acceptance: Results of a longitudinal study before and after
Fukushima. Risk Analysis, 33(2), 333-347. doi: 10.1111/j.1539-6924.2012.01861.x
Visschers, V. H. M. & Wallquist, L. (2013). Nuclear power before and after Fukushima: The relations between acceptance, ambivalence and knowledge.
Journal of Environmental Psychology, 36, 77-86. Doi: doi:10.1016/j.jenvp.2013.07.007
Wittneben, B. B. (2012). The impact of the Fukushima nuclear accident on European energy policy. Environmental Science & Policy, 15(1), 1-3.
32
Appendix 1: Questions completed following ‘electricity calculator task
A1. ‘Electricity calculator’ decision items
Questions to assess the reasons for inclusion of nuclear power and other energy sources in the ‘electricity calculator’.
(a) Please indicate the extent to which you agree or disagree with each of the following statements about your electricity mix. My chosen electricity mix was principally influenced by a desire to…
- meet a large proportion with: (1) renewables; (2) fossil fuels (i.e. coal & gas); (3) electricity import; (4) nuclear power.
- limit the contribution to demand made by: (5) renewables; (6) fossil fuels (i.e. coal & gas); (7) electricity import; and (8) nuclear power (5-point scales: strongly agree; agree; neither agree nor disagree; disagree; strongly disagree + don’t know).
Note: responses to ‘limit contribution’ items were reverse coded and
combined with their respective ‘meet demand’ items.
(b)How much do you feel you know about how electricity is generated in the UK today? (5-point scale: Know a lot; Know a fair amount; Have some
knowledge; Know very little; Know nothing at all + ‘don’t know’).
33
UK s actual electricity mix (5-point scale: substantially reduced; slightly reduced; no effect; increased; slightly increased).
A2. Energy security & climate change concern and trust in the UK government
Questions about respondents’ levels of trust in the UK government regarding new nuclear build, opinions about the use of nuclear power to combat climate change & improve energy security and beliefs in the general need for action on climate change.
(a) To what extent do you agree or disagree with each of the following statements: (1) tackling climate change is a critical challenge for the UK; (2) nuclear power stations could make an important contribution to reducing the UK’s CO2 emissions; (3) ensuring a secure and reliable supply of energy is a critical challenge for the UK; (4) nuclear power stations could make an important contribution to providing the UK with secure and reliable energy supplies for the future (5-point scale: strongly agree; agree; neither agree nor disagree; disagree; strongly disagree + don’t know).
(b) With respect to nuclear power, to what extent do you trust the UK government to: (1) Keep the public informed of the plans for nuclear power as they
develop; (2) Seek public opinion about the role nuclear power should play in the future energy mix for the UK; (3) Take public views into account; (4) Tell the truth about any risks that might be involved; (5) Keep the public’s interests at heart; and (6) Act fairly when choosing where nuclear power stations should be sited? (5-point scale: definitely yes; yes; neither yes or no; no; definitely no + ‘don’t know’).
34
against climate change; (3) No action should be taken against climate change; (4) None of these; and (5) Don’t know.
A3. Post-disaster nuclear power belief scale
Adapted version of Eiser et al.’s (1989) 16 item scale used to assess opinions of nuclear power following the Chernobyl disaster. The items were modified so as to make reference to Fukushima and Japan, rather than Chernobyl and Soviet Union, respectively. We also referred to nuclear power and the UK, rather than nuclear energy and Britain, respectively.
(a) On 11th March 2011 a strong earthquake occurred off the east coast of Japan. This subsequently caused a large tsunami (or tidal wave) to hit the coast of Japan, causing severe destruction and damaging a series of nuclear reactors at Japan s Fukushima 1 nuclear power plant. The following questions relate to
you opinions about the recent events at Fukushima. Please rate the extent of your agreement or disagreement with each of the following statements: 16- item attitude scale adapted from Eiser et al. (1989). See Table 3 for statements. (5-point scale: strongly agree; agree; neither agree nor disagree; disagree; strongly disagree + ‘don’t know’).
A4. Demographics
(a) Are you male or female? (Male / Female) (b) How old are you? (Free response)
(c) What is your nationality? (Free response)
35
(e) Please choose the term which you feel most accurately describes your ethnic origin. (White-British / White-Irish / White-Other background / Black/Black British-Caribbean / Black/Black British-African / Black-Other background / Asian/Asian British: Indian / Asian/Asian British-Pakistani / Asian/Asian British-Bangladeshi / Asian/Asian British-Chinese / Asian/Asian British-Other background / Mixed White and Black
36
Figure 1. UK public support and opposition for nuclear power pre- and
post-Fukushima. Note: Approximate date of Fukushima disaster is depicted by dashed line.
Source: Ipsos MORI (2012).
35% 40%
40%
28%
18% 19%
24% 17%
0% 10% 20% 30% 40% 50%
Nov-10 Mar-11 Jul-11 Nov-11 Mar-12 Jul-12 Nov-12
37
38
Figure 3. Mean ‘electricity calculator’ mixes for the pre- and post-Fukushima groups.
39
Figure 4. Mean ‘electricity calculator’ mixes for the ‘supporters’ vs. ‘others’.Note:
40 Table 1
The comparability of the pre- and post-Fukushima samples on key demographics and attitudes towards energy sources.
PRE-Fukushima
POST-Fukushima df t Sig. (p)
n 95 140
Mean age in years (SD) 42.5 (16.8) 40.0 (11.6) 156.11 1.27 .21 Sex (Male : Female) 39 : 56 76 : 64 Fisher’s Exact .06 Climate action (Yes : Other)a 90 : 4 129 : 11 Fisher’s Exact .42
Mean attitudes towards energy sources (SD) b
Coal 2.86 (1.01) 2.77 (1.02) 232 0.69 .49
Gas 3.17 (1.00) 3.26 (1.02) 232 0.67 .50
Nuclear Power 3.01 (1.30) 3.23 (1.34) 229 1.26 .21
Renewables 4.49 (0.70) 4.60 (0.78) 233 1.06 .29
Electric Import 2.73 (0.97) 2.57 (0.97) 220 1.19 .24
41 Table 2
Mean responses to the key post-mix questionnaire items among the ‘supporters’ and ‘others’. Mean (SD)
‘Supporters’ ‘Others’ df t Sig. (p)
Energy source preferencesa
Nuclear power (NP) 4.13 (0.80) 1.82 (0.88) 105.25 16.08 .001***
Fossil Fuels 2.08 (0.94) 2.05 (0.83) 135 0.15 .88
Renewables 4.03 (1.07) 4.72 (0.53) 135 4.85 .002**
Electricity import 1.70 (0.87) 2.16 (0.87) 135 3.08 .003**
Contextual featuresb
Fukushima accident 2.86 (0.56) 2.42 (0.98) 99.81 3.21 .002**
Pre-mix information 3.31 (0.88) 2.94 (0.75) 134.47 2.64 .009**
Lack of demand reduction option 3.11 (0.72) 3.12 (0.67) 135 0.10 .92
Knowledge of UK reliance on NP 3.43 (0.85) 2.95 (0.45) 109.70 4.15 .001***
42
Trust in UK government 3.11 (0.95) 2.76 (1.26) 118.57 1.83 .07
Knowledge of UK power generation 3.33 (0.77) 2.80 (0.81) 135 3.84 .001***
Climate change and energy securitya
Climate change critical challenge for UK 3.93 (1.13) 4.51 (0.77) 126.10 3.52 .001***
NP can reduce GHG emissions 4.44 (0.65) 3.22 (1.25) 83.17 6.86 001***
Energy security critical challenge for UK 4.72 (0.56) 4.46 (0.61) 130.25 2.58 .011* NP can increase security of energy supply 4.46 (0.65) 2.61 (1.13) 92.13 11.32 .001***
Notes. a 5-point scale: 5 (strongly agree) to 1 (strongly disagree), plus ‘don’t know’ (DK) option. b 5-point scale: 5 (substantially increased)
to 1 (substantially reduced). c 5-point scale: 5 (definitely yes) to 1 (definitely no), plus DK option. 5-point scale: 5 (know a lot) to 1 (know nothing at all). Means discount DK responses.
43 Table 3
Mean responses to the four nuclear power belief sub-scales in the ‘supporter’ and ‘other’ groups.
Mean (SD)
Theme Description (Item Number) α Supporters Others t Sig. (p)
General safety
Fears of radiation are out proportion (1)
The UK nuclear industry can be proud of safety record (4)
No reason to suppose UK power stations are safer than Japan (14 R) UK nuclear power stations operated with safety as top priority (15)
.69 3.78 (0.53)
2.68 (0.75)
9.75 .001***
Necessity of nuclear power
Alternative technologies are a more sensible investment (2 R) Nuclear power stations are cleaner than other power stations (5) UK should abandon plans for more nuclear power stations (12 R) Nuclear power is the only practical source of energy for the future (16)
.84 3.65 (0.65)
2.10 (0.74)
44 Socio-economic importance
Nuclear technology has improved ordinary people’s quality of life (3) Nuclear power is vital to the UK’s economic future (9)
Nuclear power is far less economical than its supporters claim (13 R)
.79 3.82 (0.57)
2.59 (0.90)
9.26 .001***
Nuclear disaster risk
There are going to be more nuclear disasters before very long (6 R) Fukushima event could happen at any nuclear power station (7 R) Scientists would have little idea about impact of future accident (8 R) Unlikely there will be another accident as serious as Fukushima (10) Nowhere in Europe is safe from the effects of a nuclear accident (11 R)
.79 3.45 (0.66)
2.57 (0.66)
7.92 .001***
Total Mean All 16 items .93 3.68
(0.46)
2.49 (0.61)
12.75 .001***
Notes. Standard deviations in parentheses. 5-point scale: 5 (strongly agree) to 1 (strongly disagree). Means discount ‘don’t know’ responses (missing cases excluded pairwise). Higher values equate to more ‘pro-nuclear’ responses. ‘R’ = item reverse coded before analysis.
45 Table 4.
Multiple linear regression showing the impact of initial attitude grouping and other key variables on inclusion of nuclear power in the ‘electricity calculator’ task
B (SE) β t Sig. (p)
Step 1a
Constant 10.22 (1.59) 6.42 .001***
Initial attitude group 26.26 (2.20) .73 11.95 .001*** Step 2b
Constant -20.08 (10.54) 1.91 .06
Initial attitude groupc 7.35 (2.94) .20 2.50 .014*
Fukushima accident 1.16 (1.35) .05 0.86 .392
Pre-mix information 0.42 (1.29) .02 0.32 .746
Knowledge of UK reliance on NP -.035 (1.55) -.01 0.22 .824 Trust in UK government -1.02 (0.90) -.06 1.13 .259 Knowledge of UK power generation 3.16 (1.18) .15 2.67 .009** Climate change concern 0.65 (0.96) .03 0.49 .629 NP can reduce GHG emissions 0.47 (1.18) .03 0.40 .690 Energy security concern -1.60 (1.59) -.05 1.00 .317 NP can increase security of energy
supply
3.22 (1.49) .23 2.17 .033*
General safety of NP -2.37 (1.91) -.11 1.24 .217
Necessity of NP 6.30 (2.00) .36 3.16 .002**
Socio-economic importance of NP 2.75 (1.80) .15 1.53 .130 Nuclear disaster risk 0.85 (1.68) .04 0.50 .616
46 a
Step 1:Adj. R2= .53, F change (1, 126) = 142.29*** b
Step 2: Adj. R2= .70, F change (13, 113)= 6.32***