%
ELECTRICITY PRICES
DE EUROPÆISKE FÆLLESSKABERS STATISTISKE KONTOR STATISTISCHES AMT DER EUROPÄISCHEN GEMEINSCHAFTEN ΣΤΑΤΙΣΤΙΚΗ ΥΠΗΡΕΣΙΑ ΤΩΝ ΕΥΡΩΠΑΪΚΩΝ ΚΟΙΝΟΤΗΤΩΝ STATISTICAL OFFICE OF THE EUROPEAN COMMUNITIES OFFICE STATISTIQUE DES COMMUNAUTÉS EUROPÉENNES ISTITUTO STATISTICO DELLE COMUNITÀ EUROPEE
BUREAU VOOR DE STATISTIEK DER EUROPESE GEMEENSCHAPPEN
L-2920 Luxembourg — Tél. 43011 — Télex: Comeur Lu 3423
B-1049 Bruxelles, Bâtiment Berlaymont, Rue de la Loi 200 (Bureau de liaison) —Tél. 235.11.11
Denne publikation kan fãs gennem de salgssteder, som er nævnt på omslagets tredje side
Diese Veröffentlichung ¡st bei den auf der dritten Umschlagseite aufgeführten Vertriebsbüros erhältlich.
Την έκδοση αυτή μπορείτε να την προμηθευτείτε από τα γραφεία πωλήσεων τα οποία 'αναφέρονται στην τρίτη σελίδα του εξωφύλλου.
This publication is obtainable from the sales offices mentioned on the inside back cover.
IT ISBN 92-825-5656-5
Cataloguing data can be found at the end of this publication
Manuscript completed in September 1985
For all information concerning this publication, contact F. Desgardes — Tel. Luxembourg 43011, ext. 3102
Luxembourg : Office for Official Publications of the European Communities, 1985 ISBN 92-825-5654-9
I. Introduction 5
II. Conditions and methods 7 1. Scope and locations 7 2. Standard consumers 8 3. Definition of the price levels recorded 10
4. Tariff voltage 11
III. Units of value 13 1. The European currency unit (ECU) 13
2. The Purchasing power standard (PPS) 14 3. Prices in 'current' PPS and 'constant' PPS 14
4. Price series. 15
IV. Taxation 17 1. General indirect tax 17
2. Specific taxes 18
V. Electricity prices in the various countries 21
1. FR of Germany 23
2. France 31 3. Italy 40 4. Netherlands 49
5. Belgium 54 6. Luxembourg 63 7. United Kingdom 68
8. Ireland 74 9. Denmark 79 10. Greece 85
VI. Community comparison and conclusions 91
VII. Statistical annex I Tables
1 - 2 9 : Household and industrial prices by country Ill 30: Conversion factors for PPS, ECU and GDP price indices XXXII
/ 0
1980 = 100
Nil
Data less than half the unit used No data available
Per cent Reference year
V kV kVA kW h kWh GWh n
Volt
Kilovolt (= 1 000 V) Kilovoltampere Kilowatt Hour
Kilowatthour
Gigawatthour (10 kWh) Number
DM Pf
FF Cent
LIT HFL Cent BFR LFR UKL Ρ IRL Ρ DKR Øre DR PPS ECU
German mark, Pfennig French franc, Centimes Italian Lira
Dutch guilder, Cents Belgian franc
Luxembourg franc Pound sterling, Pence Irish pound, Pence
Danish crown, Øre = 1/100 DKR Greek drachma
Purchasing power standard European currency unit
EUR 10 Eurostat
This publication is a complete updating of the study on 'Electricity prices 1978-1984' published by Eurostat in 1984.
It gives the prices obtaining in 1985 as well as a historical summary going back to 1980.
The text describes all recent modifications to tariffs, taxation, supply and selling conditions which can influence price levels.
The study has been extended to cover two additional standard consumers; one for domestic usages (7 500 kWh per year), in order to fill a gap in a category which is gaining in importance, the other for industrial usages (24 000 000 kWh per year), in order to pro-vide better coverage of the very large consumers.
The trend analyses and the indices have been rebased on the year 1980 which has been se-lected as the new reference period.
In order to begin to integrate statistics for Spain and Portugal into the Community scheme, the most recent prices available for these countries are presented in the Com-munity comparison and conclusions.
Otherwise, the definitions and methods are the same as in previous studies on the sub-ject so that it is possible to follow electricity price formation and development over a very long time series. In addition, the definitions are harmonized with those of the In-ternational Union of Producers and Distributors of Electrical Energy (Unípede).
This publication is available in four languages: English, French, German and Italian.
1. SCOPE AND LOCATIONS
The present study aims to show the actual price of electricity paid by the consumer in the member countries of the European Economic Community.
The prices are recorded at the beginning of each year based on the tariffs, contracts, conditions and rules in force at that time.
It is concerned with the actual price paid by the electricity consumer, corresponding to the invoiced delivery price to the consumer at the beginning of each year including any eventual rebates and subsidies. Our consumers are defined as those who purchase elec-tricity for their own use and exclude those who offer it for resale. We have not con-sidered the bulk price paid by the electricity distributors.
As regards consumers, the study considers all types of customers supplied through the public distribution network with low, medium and high-voltage electricity. In the in-terests of simplified presentation, consumers are subdivided into two groups, one for domestic and the other for industrial users. The survey does not cover certain indus-trial consumers:
(i) who themselves produce part of their electrical energy requirement;
(ii) who purchase electricity under special contract terms because of their exceptional-ly high power requirements and consumption demand.
These exceptions are mainly steelmaking and chemical enterprises, enterprises engaged in the production of aluminium and other metals by electrolysis, railways, etc.
Most of these enterprises consume over 10 million kWh annually. They are few in number, but nevertheless consume an appreciable part of the total electrical energy supplied.
In order to reflect as accurately as possible the real position of consumers, it seemed advisable to record prices at selected locations, i.e. towns, conurbations or distribu-tion networks, rather than give average prices per country.
The choice of location is decided by several criteria, namely, population, economic im-portance, different tariff districts, even geographical coverage of a country, harmoni-zation with the locations used in statistics relating to the prices of other sources of energy, particularly gas.
The prices were recorded in 29 towns or conurbations:
FR of Germany: Hamburg, Hanover, Dusseldorf, Frankfurt am Main, Stuttgart, Munich, Western Zone, Southern Zone.
France: Lille, Paris, Marseille, Lyons, Toulouse, Strasbourg.
Italy: Northern and central Italy, southern Italy and the islands.
Netherlands: Rotterdam (GEB), North Holland (PEN), North Brabant (PNEM).
Belgium: The country as a whole (standard national tariff).
Denmark: Copenhagen (KB), North Zealand (NESA).
Greece: Athens (standard national tariff).
Certain towns selected are representative of larger regions. This is indicated in the chapter concerning each country. Six years are covered by this study: 1980 to 1985.
2. STANDARD CONSUMERS
The survey is based on the system of standard consumers, i.e. the prices are recorded for certain levels of electricity consumption and under certain conditions of supply, chosen as being representative of the population of electricity consumers. These stand-ard levels of consumption remain fixed from one year to the next and for all the coun-tries, this being one of the primary conditions for spatial and temporal comparability of prices.
Two families of standard consumers are taken: domestic uses and industrial uses.
Five domestic standard consumers (supply at low voltage) coded D to D have been taken: a e
Standard consumer
D a
Db D c
Dd D e
Annual consumption kWh
Total
600
1 200
3 500
7 500
20 000
(of which night)
(1 300)
(2 500)
(15 000)
Approx. subscribed demand in kW
« 3
3 - 4
4 - 9
6 - 9
>9
Standard dwelling
2
50 m 2 rooms + kitchen 2
70 m 3 rooms + kitchen 2
90 m 4 rooms + kitchen 2
100 m 4-5 rooms + kitchen 2
120 m 5 rooms + kitchen
As a guideline these standard consumers may be expected to possess the following house-hold facilities and appliances:
D Lighting, radio, television, refrigerator, small electric appliances; a
D, as for D plus washing machine or dishwasher; D a
D D, as for D, with washing machine and dishwasher plus storage water heater;
D 'all-electric' system with water heater and electric central heating operating on a storage basis.
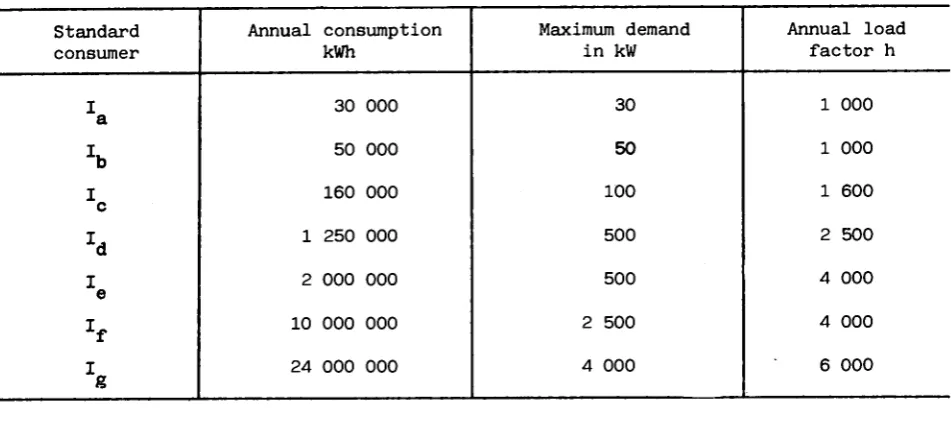
Standard consumer
I a
h
I ch
I eZf
I g
Annual consumption kWh
30 000
50 000
160 000
1 250 000
2 000 000
10 000 000
24 000 000
Maximum demand in kW
30
50
100
500
500
2 500
4 000
Annual load factor h
1 000
1 000
1 600
2 500
4 000
4 000
6 000
The maximum demand is the maximum offtake in any quarter of an hour recorded in one year, expressed in kilowatts (kW). The price of supply is calculated for' cos f = 0,9. The an nual load factor determines the regularity of consumer offtake of electricity from the grid during the year. The longer this time the more even the pattern of consumption dur ing the 8 760 hours of the year. It indicates the number of hours in which the consumer would reach his annual consumption level if the demand level were permanently equal to maximum demand.
Additional details are sometimes needed before the tariffs can be applied:
(i) In the case of tariffs based on half hourly maximum demand, the maximum demand of the standard consumer is multiplied by a coefficient of 0.98.
(ii) In the case of tariffs based on a maximum demand expressed in kVA an adjustment is made by dividing the standard consumer's maximum demand in kW by the coefficient COS-/ = 0.90.
[image:11.595.57.533.93.308.2](iii) In the case of tariffs based on maximum demand readings more frequent than once a year the standing charge is multiplied by the following coefficients:
Table of power correction coefficients
Standard consumers: Annual load factor:
Maximum monthly demand Maximum two-monthly demand Maximum three-monthly demand Average of the three highest values for max. monthly demand Average of the two highest values for max. monthly demand Annual max. demand (basic principle)
1
K
a b1 000 h
0.81 0.83 0.86
0.94
0.96
1
I c 1 600 h
0.83 0.85 0.88
0.95
0.97
1
Jd
2 500 h
0.85 0.87 0.90
0.96
0.98
1
1
ι*
e f 4 000 h
0.90 0.91 0.95
0.98
0.99
1
I g 6 000 h
0.96 0.97 0.98
0.99
0.995
Standard consumer
I a
I c
I e
Xf I
g
Annual load factor
h
1 000
1 000
1 600
2 500
4 000
4 000
6 000
Annual consumption
1 000 kWh
30
50
160
1 250
2 000
10 000
24 000
Annual consumption (in 1 000 kWh) charged at off-peak rates according
to the average daily duration of off-peak periods
7 h 8 h 9 h 10 h 11 h 12 h
0 0 0 0 0 0
0 0 0 0 0 0
11 13 16 19 22 25
197 225 262 300 338 375
438 500 580 660 740 820
2 190 2 500 2 900 3 300 3 700 4 100
7 140 8 160 9 120 10 080 11 040 12 000
If off peak rates are charged during other periods, for example all day Sunday we have only taken one half as supplementary off peak hours. Such cases are mentioned as they occur in our study.
Account has not been taken of changes in tariff parameters during the course of a year. In other words no weighted price is calculated for a year.
3. DEFINITION OF THE PRICE LEVELS RECORDED
All prices are shown per unit of electricity sold, that is per kilowatt hour (kWh). The results represent the unit price actually paid at the beginning of each year and take account of the relevant tariff, parameter, index, etc. applicable as from 1 January. In the case of tariffs or contracts with short term indices (month, quarter) it is the in-dex which is in force during January which is applied. This means that any changes in the tariff structure during the year are not taken into account, i.e. no price weighting is applied to the year. The prices include meter rental, the standing charge and the commodity rate. They do not include the initial installation charge to the consumer.
If there are several possible tariffs, it is the tariff which is most advantageous to the consumer that is taken into account, after the elimination of the tariffs which are not used in practice or which apply only to a marginal or negligible number of users.
for reactive power.
Three price levels are shown: (i) the price net of tax;
(ii) the price excluding VAT but including all other taxes; (iii) the selling price (inclusive of all taxes).
The price excluding tax is obtained directly from the tariffs or contracts.
The price excluding VAT includes, where payable, other specific taxes which is interest-ing in cases where VAT is deductible.
The price inclusive of all taxes corresponds to the sum paid by the consumer.
'Taxes' is used here to mean fiscal and para-fiscal levies applying directly to elec-tricity at the stage of sale ot the consumer. These taxes may be levied at the national, regional, local or municipal level, etc. by the State, regional or local administrations, professional associations, etc.
On the other hand, the taxes levied before the sale of the electricity, such as taxes on companies, profits, wages, etc., which are obviously part of the production or distribu-tion costs, are not calculated separately. They remain an integral part of the price ex-cluding tax.
The results for each country are shown in national currencies at current prices, i.e. at face value.
For the purposes of international comparison, it was necessary to use a representative common monetary unit which would create a minimum of distortion in both space and time. Accordingly, the present study uses the purchasing power standard (PPS). The comparative tables are also shown in European currency units (ECU).
These units of value are explained in the following chapter.
4. TARIFF VOLTAGE
The voltage at which electricity is supplied to the consumer is an element which may af-fect the industrial price levels. The higher the voltage, the lower the price. But in this case, the consumer has to bear the expense of the electricity transformer (the in-vestment cost or the rental).
In practice the supply voltages vary according to the grid and the tariffs. According to our general definitions, the voltage taken into account is the one at which electricity is commonly supplied to the consumer.
Where several supply voltages coexist for the same category of users it is the most rep-resentative (greatest number of users) which is considered.
Standard consumers
FR of Germany
- Süd Gebiet
- Hamburg, Hannover, Düsseldorf, Frankfurt
- West Gebiet
Stuttgart, München
France
Italy
Netherlands
- GEB
- PNEM, PEN
Belgium
Luxembourg
United Kingdom
Ireland
Denmark
Greece
1a
K
bs 0.38
y 0.38
-?
<
0.38 s
0.38/ s.
y 0.38
, 0.38
->
/
y 0.415
y 0.38
, 0.40
<r- ■ ~- ■ — —
/ 0.38
\
- r
\ /
I c
s
10
"V
\ /
V.
Xd
E e
20
10
( 1 5
s
450
/
io
10
10/15
10/15
. -\ ?
/
<
c
nio
< 1 0
6.6
>
>
>
>
Jf I g
>
ν /
ν /
v40-130
?
ν 25
s
v
s 65
, 38
< 1 0
20
>
Y
>
To permit comparisons between countries, prices expressed in national currencies need to be converted to a common unit. In this study two common units are used:
(i) the European currency unit (ECU); (ii) the purchasing power standard (PPS).
1. THE EUROPEAN CURRENCY UNIT (ECU)
The ECU is a basket-type currency unit based on the market exchange rates of a certain amount of each of the Community currencies, weighted according to the gross national product and intra-Community trade of each Member State.
In 1984, this weighting was revised on the accession of Greece.
The new composition of the ECU basket is as follows:
DM FF HFL BFR LFR
0.719 1.31 0.256 3.71 0.14
LIT DKR IRL UKL DR
140 0.219 0.00871 0.0878 1.15
The conversion rates for the ECU against the national currencies in January of each year are given in a table in the statistical annex.
The definition of the ECU is such that it reflects fluctuations in exchange rates and is suitable for measuring the prices and values of international flows of goods and serv-ices. Data expressed in ECU therefore permit the comparison of prices in terms of money as changed at a bank. Such currency conversion at the market exchange rates, however, has the disadvantage that it fluctuates in time under the influence of many factors which are independent of internal price movements:
(i) capital transfers; (ii) political decisions; (iii) regulations;
(iv) speculation;
(v) psychological factors; (vi) interest rates.
Furthermore a national currency can be overvalued in relation to its true purchasing power.
The ECU also has the inconvenience that its definition changes when a new currency is introduced, as is the case with the introduction of Greece, and that it is not coherent with the gross domestic product price index which makes it difficult to deflate.
tional currencies is proportional to the purchasing power parities (PPP) between these currencies.
The purchasing power parities reflect the ratios between price levels in the different countries. The ratios between the prices expressed in national currencies are calculated for each of the products included in the uses of the GDP. If these ratios are suitably weighted, one obtains mean price ratios, the most general of which is the mean calcu-lated for the GDP and known as the PPP at GDP level.
Such parities would be adequate to express all the data in real terms in the currency of any one of the countries considered. The method ensures that they are transitive and un-affected by the country chosen as a basis of reference. For Community calculations an-other reference unit known as the PPS is used. It is defined by applying the price ra-tios to the GDPs of the various countries expressed in national currency and adjusting the parities so that the value of the GDP of the Community as a whole in 1975 is iden-tical whether expressed in ECU or PPS. Only the proportion accounted for by each country will be different.
When prices are converted to PPS using the GDP parity, the result may be interpreted as follows :
If one gigajoule of energy costs 10 PPS in country A and 5 PPS in country B, this means that after allowance has been made for the differences between the general level of prices in the two countries, this gigajoule of energy is twice as expensive in coutry A as in country B.
This conclusion is independent of market exchange rates, which are influenced by factors other than the level of prices (movements of capital, speculation, interest rates, po-litical decisions, etc.).
The conversion rates for the years covered by the study are given in a table in the an-nex. They were revised when the base year was changed.
3. PRICES IN CURRENT PPS AND CONSTANT PPS
The price surveys required to calculate purchasing power parities are not carried out every year. The most recent available is that for 1980 and another is planned for 1985. Since the parities are price ratios, however, their value for the other years may be es-timated by extrapolation using the movement of the GDP price indices for the various countries, referred to the Community average. These are known as 'current parities'.
The data can also be converted into base year PPS. If price series deflated by the GDP price index for each country are expressed in base year PPS, one obtains an indication of the change in prices for the product in question in relation to the general level of prices in the country. The data so calculated can also be compared between countries, giving the same results in relative terms as will be obtained using current prices and current PPP, since the latter are extrapolated using the same indices, viz. the GDP price indices for each country and the average Community index.
Calculation using deflated PPS is thus carried out as follows:
(i) the prices of the time series in current national currency are divided by 100th of the GDP price index of each of the years concerned;
in three forms:
(i) a series of current prices in the national currency for each country;
(ii) a series in current ECU using the conversion rates for January of the year con-cerned ;
In the Community, sales of electricity are subject to a general indirect tax: (i) value-added tax (VAT) in nine countries (two having a zero rate);
(ii) turnover tax in one country (Greece).
Furthermore, specific taxes are levied in four countries.
The prices inclusive of all taxes shown in this study comprise all the taxes mentioned above. In the tables in the annex, the amount of any specific taxes can be calculated from the difference between the tax-exclusive and VAT-exclusive price, while the differ-ence between the total tax-inclusive price and VAT-exclusive price gives the amount of value-added tax* in national currencies per kWh.
1. GENERAL INDIRECT TAX
In general, VAT is calculated and applied to the price excluding VAT but including any specific taxes, these being part of the basis of assessment. France constitutes an ex-ception since VAT is computed on the price excluding specific taxes.
The rates are as follows:
Value-added tax on electricity sales
(% of price before VAT)
January
FR of Germany 1 France
Italy (domestic) Italy (non-domestic) Netherlands
Belgium Luxembourg United Kingdom Ireland
Denmark
1980
13 17.6
6 14 18 16 5 0 0 20.25
1981
13 17.6
8 15 18 16 5 0 0 22
1982
13 17.6
8 15 18 17 5 0 0 22
1983
13 18.6
8 18 18 17 5 0 0 22
1984
14 18.6
8 18 19 17 6 0 0 22
1985
14 18.6
9 9/18 19 17 6 0 0 22
On prices without taxes,
January
Greece (domestic) Greece (non-domestic)
1980 1981 1982 1983 1984 1985
8 8 8 10 10 10 0 0 0 0 0 0
In Italy, the new VAT rates depend on the activity; 9% for the extractive and manufturing industries, including printing and publishing, and 18% for other non-domestic ac-tivities.
VAT is deductible for industrial and commercial consumers coming under the normal taxa-tion system.
2. SPECIFIC TAXES
(a) Federal Republic of Germany
Since 1 January 1975 a compensatory tax (Ausgleichsabgabe) has been levied to promote the use of Community coal in power stations.
The rates depend on region and period as follows:
(% of price before tax)
Hamburg Hannover Düsseldorf Western Zone Frankfurt/Main Stuttgart München Southern Zone
Federal average
1980
5.1 4.3 5.3 5.3 4.1 4.0 4.0 4.0
4.5
1981
5.1 4.2 5.3 5.3 4.0 4.0 4.0 4.0
4.5
1982
4.7 4.0 4.8 4.8 3.8 3.7 3.9 3.9
4.2
1983
3.8 3.3 4.0 4.0 3.2 3.1 3.2 3.2
3.5
1984
3.9 3.4 4.0 4.0 3.2 3.2 3.2 3.2
3.5
1985
3.9 3.4 4.0 4.0 3.3 3.1 3.3 3.3
rates applied in the cities surveyed were as follows for 1978-1984:
i%)
Places
Lille Paris Marseille Lyon Toulouse Strasbourg
Municipal tax
8 13.2
8 8 8 0
Department tax
1 -4 -2 4
Total
9 13.2 12
8 10 4
These taxes were levied on 80% of the total bill excluding VAT and do not enter into VAT assessment. However, changes are being made to the taxable amount and the new system will be described in the next study.
(c) Italy
Electricity consumption is subject to a State tax (imposta erariale), the rates of which have been as follows since 1981Ά
(LIT/kWh)
Users
Domestic
Non-domestic
Blocks of consumption ^•200 000 kWh/month > 200 000 kWh/month
Northern and central Italy
1.10
1.10 0.65
Southern Italy and islands
0.55
0.55 0.325
Users
Domestic for the block > 900 kWh/month
Non-domestic < 1 000 kW/month
Municipalities
1983
10
4
1984
11
4.5
1985
12
5
Provinces
1983
4
1984
4.5
1985
5
All these taxes enter into VAT assessment.
(d) Denmark
A special government tax on electricity was introduced in April 1977, the rates of which were as follows :
1.1.1980 - 29. 6.1980 30.6.1980 - 14. 6.1982 15.6.1982 - 31.12.1982
1.1.1983
-8 Øre per kWh 12.50 Øre per kWh 14.30 Øre per kWh 15.50 Øre per kWh.
This tax is included for VAT assessment and is deductible in the same way as VAT, in other words, tax is only payable once in the event of resale.
(e) Greece
1. FR of Germany
2. France
3. Italy
4. Netherlands
5. Belgium
6. Luxembourg
7. United Kingdom
8. Ireland
9. Denmark
(a) Situation in the electricity industry
There are around 1 000 electricity distribution enterprises in the FR of Germany. About 340 of these enterprises have their own generating capacity while the others are solely retailers. The enterprises are of varying size and legal form. This decentralized system leads to, insofar as interests us here, a great diversity of prices reflecting the na-ture of each zone.
Three pricing systems are to be found:
(i) the tariffs applied to small low voltage consumers which must be published by the seller and contain an obligation to supply according to the 'Law on energy'; (ii) the quasi-tariffs, principally for supplies in low voltage for storage heating
(households, shops, offices, etc.) which take the form of non-published agreements; (iii) individual contracts cover all other cases, notably for supplies to industry and
are negotiated between the parties concerned. Often the contracts offer the same price to all clients having similar supply conditions.
The following table which shows the sales of electricity by the public distribution en-terprises in 1983 broken down by sector and contract type illustrates the pricing system operated :
Sector
Households Commerce and small industry Agriculture Public
administration Public lighting Transport Industry
Total
Tariffs and quasi-tariffs
Low
90 1651
24 365 6 890
2 108 1 088 51 381
125 048
Individuai
voltage
—
4 534 196
3 710 1 546 314 4 993
15 293
. contracts
High voltage
-8 -835 211
16 040 -4 138 125 597
154 821
Total
90 165
37 733 7 297
21 858 2 634 4 503 130 971
295 161
At the end of 1983 the consumers supplied by the public distribution network were made up as follows:
Users
Households
(of which, heating)
Commerce, administration, small industry
Industry
Agriculture
Total
1 000 n
25 834
(1 890)
2 963
204
655
29 656
%
87.1
(6.3)
10.0
0.7
2.2
100
Standard consumers
D .... D a e
a b I I
c g
The eight distribution network chosen for this study are amongst the largest and repre-sent 53% of electricity sales in the FR of Germany.
To meet these needs the following energy sources are used in the public power stations:
i%)
Sources
Hydroelectric Nuclear fuels Coal
Lignite Fuel-oil Natural gas Derived gases Other
Total
1980
5.3 14.4 26.5 30.1 5.0 17.4 0.8 0.4
100
1984
4.7 27.9 30.5 27.0 1.1 7.6 0.4 0.8
(b) Taxes
Sales of electricity are subject to value-added tax (VAT) the rates of which were as follows on the VAT excl. price:
13% since 1.7.1979; 14% since 1.7.1983.
VAT is deductible for commercial and industrial consumers.
In addition, since 1 January 1975 a compensatory tax (Ausgleichsabgabe) has been levied on electricity sales with the object of increasing the use of Community coal in the power stations. The rates are revised periodically, in general once a year and since
1978 the have differed according to Federal region.
At the beginning of each year the rates were as follows in the regions chosen for our study:
(% of price before tax)
Hamburg Hannover Düsseldorf Western zone Frankfurt/Main Stuttgart Munich
Southern zone
Federal average
1980
5.1 4.3 5.3 5.3 4.1 4.0 4.0 4.0
4.5
1981
5.1 4.2 5.3 5.3 4.0 s 4.0
4.0 4.0
4.5
1982
4.7 4.0 4.8 4.8 3.8 3.7 3.9 3.9
4.2
1983
3.8 3.3 4.0 4.0 3.2 3.1 3.2 3.2
3.5
1984
3.9 3.4 4.0 4.0 3.2 3.2 3.2 3.2
3.5
1985
3.9 3.4 4.0 4.0 3.3 3.1 3.3 3.3
•
This tax is included in the basis of assessment to VAT.
(c) Household prices - tariffs
The legal relationship between the distributors and households or other tariff clients is governed by:
(i) the regulation on general conditions for the supply of electricity to tariff con-sumers, in force since 1 April 1980 and replacing previous texts;
(ii) several supplementary conditions issued by the distributors; (iii) the general tariffs.
The pattern of the general tariffs is determined by 'the regulation on general tariffs for electricity supply (Federal regulation on tariffs)' - BTO elt - of 26 November 1971, updated on 30 January 1980. This regulation does not apply to electricity supplied by virtue of special arrangements at special prices e.g. for storage heating, as these are governed by non-tariff contract arrangements. There is a uniform structure of general tariffs for low voltage supply, the pattern being fixed by the Federal regulation on tariffs BTO elt.
All distributors must offer their customers a choice of four tariffs (an exception being block tariffs) of which:
(i) two basic two part tariffs, called I and II with different commodity rates, the lower one (tariff II) having a higher standing charge;
(ii) a small users tariff;
(iii) an off-peak tariff which is always combined with one of the preceeding tariffs.
Most customers are covered by the basic tariffs consisting of an annual standing charge and a charge per kWh consumed. The standing charge covers the connection charge and me-ter reading.
The connection charge, which usually accounts for the bulk of the standing charge, de-pends on the type of use: domestic, agricultural, commercial, professional and other. In the case of domestic uses, the number of rooms used or usable for accomodation is the yardstick (the annexes, i.e. corridor, bathroom, toilet, boxroom, are not counted; nor
are rooms of less than 6 m2). In the case of rooms of over 30 m2, the equivalent of an
additional room is counted for each extra 30 m2 or part thereof. An extra charge may be
made above a given level of power, and also when heating or air-conditioning appliances are used, irrespective of their period of use. The use of such appliances is a function of climatic factors, unlike other domestic appliances, and they are switched on simulta-neously by a large number of consumers (whence the danger of overloading the grid).
In the case of households heated by electric heat pumps no supplement is payable if the heating system can be switched to another fuel or if the heat pump is interruptible for pre-determined daily periods.
The invoicing and meter reading charges cover the meter and the costs incurred by the company is invoicing and collecting: it depends on the type and the size of the meters.
For the application of tariff II, with a lower commodity rate, thus better suited for large consumptions the degressivity of the unit price is limited by the commodity rate of tariff I to ensure rational and economic energy use. Above a certain ceiling, each supplementary kWh is charged at a rate which is at least 3 Pf above the commodity rate of tariff I (without the standing charge).
Separately metered electricity for heat pumps is excluded from the calculations.
When consumption is very low in relation to the size of the installation, the small users tariff is advantageous. This tariff consists of a meter reading charge and a com-modity rate which is higher than the basic tariff to cover overheads. This tariff is seldom advantageous for households.
The off-peak tariff offers a price per kWh which is lower than tariff II. It may be taken in conjunction with the other tariffs. A separate meter is necessary to measure night consumption (off-peak hours) for which an additional standing charge is payable. The off-peak periods are of 6-8 hours duration depending on the load curves of the dis-tributors .
lower than those charged for off-peak electricity. These special rates are offered when capacity is released during off-peak hours, according to load curves and local condi-tions, so that electricity can be supplied without requiring additional investment in the installations. However, certain technical conditions have to be satisfied and there is therefore no obligation to supply in this case.
Example of general tariff available in Frankfurt/Main in 1985.
Standard consumers
D a
Db
D c
D e
I
II
Tariff
I
I
+ off peak
+ Contract
Standing
Meter
7.80 (3)*
9.40 (4)*
11.00 (5)*
20.40 (6)*
charges
Connection
3.50a
3.50a
7.50b 1.10e
7.50b 1.02e
Commodity rate DM/kWh
0.175
0.175
day 0.175 night 0.108
day 0.145
night 0.066d
a Single AC meter. " Double meter.
c Supplement for total recorder.
° Storage heating contract.
* No of rooms for tariff purposes.
(d) Household prices - analysis
The results are shown in Tables 1-4 in the annex.
During the period 1980-85 current prices including all taxes rose by between 30% and 55% according to region and standard consumer. This results principally from the rising cost of fuels used in electricity generation (95% of electricity is of thermal origin). Taxes have hardly played any part, while VAT rose by one point during 1983 the compensatory tax fell slightly in the same period. Taxes have consistently remained around 15% to 16% of the selling price.
Consumers using electricity for heating, charged according to quasi tariffs have suf-fered the largest rises in all cases (40-55% for D between 1980 and 1985).
e
This has resulted in a diminuation of the range of unit prices between small and large
users. However the gap remains wide: the standard consumer De (20 000 kWh, of which
15 000 night) pays in general 67-74% less per kWh than the standard consumer Da
The tendency towards increases is not regular in time, the year 1982 marks a mid point with a small but short-lived falling back of price levels.
The range between extreme prices in the eight locations surveyed varies from 13—44% ac-cording to the level of consumption in 1985. This regional dispersion is more pronounced
for 'heating' users (De) than for the small consumers (Da, D^) and has grown since 1980.
This is due to the independence of companies who liberally establish their tariffs based on their costs.
This creates a difficulty in selecting a location which typifies the level and evolution of prices in Germany. One solution seems to be to calculate a median price from the eight locations surveyed for each year and standard consumer. This exercise, which con-firms our earlier remarks gives the following results:
Median price
Standard consumers
D a
Db
D
C
D e
1980
34.39
26.07
18.92
9.56
1981
37.73
28.96
20.41
11.24
1982
43.55
33.15
23.56
13.26
1983
44.36
33.67
24.57
13.41
1984
45.89
35.14
25.44
14.14
1985
46.40
35.68
26.08
14.33
(Pf/kWh)
% 1985/80
+ 35
+ 37
+ 38
+ 50
In addition for the whole period and all standard consumers it is Düsseldorf which shows the smallest deviation from the median prices and has thus been chosen as the most representative.
Since 1980 the price of electricity for domestic uses has grown by significantly more than the price of all goods and services represented by the implied GDP price index which itself has grown by 17%.
In conclusion it can be said that electricity has, in all cases become more expensive in 'constant' terms.
(e) Industrial prices - tariffs
The legal relationship between distributors and non-tariff customers is governed by in-dividual delivery contracts concluded between the parties (general conditions are usual-ly drawn up separateusual-ly).
price formulas for these standard contracts. Such contracts are subject to the terms of the Law on the general conditions of commerce (AGB) of 9 December 1976 (BGBl. I p. 3317).
The structure of the price formula for medium and high voltage is fairly uniform in the Federal Republic of Germany. All distributors offer a price formula with differentiated power charges and kWh prices for day and night. Some companies offer a block formula for a low load factor involving no power charge, but with nonetheless two tariff periods.
The majority of distributors offer degressive formulae alongside block tariffs. In most regions customers served in middle voltage can choose between two or three price formu las with different degressivity best suited to their load factor.
The parameter for calculating the demand charge is as a rule the maximum subscribed de mand usually based on an annual demand consisting of the average of the two or three highest monthly demand levels (in kW or kVA). The demand considered is usually measured on a quarter-hourly basis. Most formulas provide for a minimum charge which is payable according to the demand available. Some price formulas provide for a rebate based on load factor. Certain distributors base the demand charge on the maximum demand requested by the user in the contract with a surcharge if this is exceeded.
The duration of tariff periods depends on the load pattern for each network. As a result the off-peak period is often longer in summer than in winter, but it will be at least 10 p.m. to 6 a.m. with many companies offering longer periods.
Those customers who can erase part of their demand during peak periods determined by the distributor can benefit from more advantageous rates, which reduce their costs. This possibility is becoming rare as network load patterns become more regular.
Block tariffs Eire also available with a decreasing commodity rate as consumption in creases and a rebate for a low load factor depending upon the annual quarter hourly max imum demand. The off peak hours are the same as for the other price formulae. These sys tems are becoming infrequent.
In general contracts are based on cos γ)/0.9. In the most common case where the demand is measured in kW a penalty is charged if the ceiling for reactive energy is esceeded.
On the contrary, if the demand is measured in kVA the consumer must endeavour to reach this ceiling in their own interest.
(f) Industrial prices - analysis
The results for the eight locations surveyed are shown in Tables 5-8 in the annex.
It should be noted that the analysis is based on the price excluding VAT but including the compensatory tax.
Between 1980 to 1985 current prices for users receiving electricity under individual contracts rose by 20-40% according to the location and level of consumption. A certain parallelism is seen between standard consumers with however rises being a few percent higher for very large users.
The rises have been softened by the policy of reconversion from petroleum products and natural gas to coal.
(iii) return to rising prices during 1983; (iv) quasi-stability in 1984.
Everywhere the difference in price between January 1984 and January 1985 is very small (a few percent) or even nil.
This pattern has affected all levels of consumption to the extent that unit price de-gression as a result of demand and consumption has hardly changed. For the period as a whole and all locations surveyed it can be said that a large industry (10 million kWh/year, 2 500 kW) pays half the price of a small industrial or commercial user
(30 000 kWh/year, 30 kW).
The upward trend has not been parallel between locations because tariff changes do not always occur at the same time or with the same frequency. This leads to a constantly changing order of locations. As a result it is difficult to choose a location which would be representative of the level and evolution of prices in Germany. One solution is to calculate a median price from the eight locations surveyed for each standard consumer. This gives the following results:
Median price
(Pf/kWh)
Standard consumers
I c
Jd
I e
h
1980
20.20
16.05
13.23
12.63
1981
21.84
17.34
14.54
13.73
1982
25.32
20.40
16.63
15.87
1983
25.27
20.26
16.68
16.35
1984
25.32
21.00
17.45
17.09
1985
26.12
21.10
17.50
17.10
% 1985/80
+ 29
+ 31
+ 32
+ 35
Due to a lack of price information we have not calculated a median price for the stand-ard consumers I, La' Ib and Ig.
Evidently prices will be found above and below the median as regional price ranges have remained open during the whole period studied. Regional price differences are greater
for the small consumers (35% between extreme prices for Ic) than for the large consumers
(18% for If). These differences result from the liberty of the distribution companies to establish their tariffs based on costs.
For international comparison we have chosen Düsseldorf to represent Germany to ensure harmonization with household prices and other sources of energy (gas prices for example). For industry this choice has the effect of underestimating the price of electricity in Germany as the prices for Düsseldorf are below the median.
(a) Situation in the electricity industry
A nationalized public company (EDF) dominates the production, transport and distribution of electricity.
EDF has the right to decide on tariffs and prices. The prices shown in this study are valid for practically the whole country.
EDF serves 25 210 000 customers (out of a total of 26 680 000 in France), 168 000 re-ceiving a high-voltage and 25 041 000 a low-voltage supply. At the present time, 2 mil-lion dwellings have integrated electric heating.
Sales were divided up as follows in 1984:
(% GWh)
Users
Low voltage
- Households
(of which off-peak tariffs)
- Professional uses
- Public lighting
Middle and high voltage
- Industry
- Railways
- Tertiary and professional sectors
- Agriculture
Total
EDF
40.3
30.2 (8.6)
8.9
1.2
55.6
41.6
2.9
10.3
0.7
96.0
Other distributors
2.4
1.8 (0.5)
0.5
0.0
1.7
1.3
0.0
0.4
0.0
4.0
Total
42.7
32.0 (9.1)
9.4
1.3
57.3
42.9
3.0
10.7
0.7
The breakdown of domestic subscribers (EDF) is as follows:
Categories kWh/year
< 1 000
1 000 - 2 000
2 001 - 5 000
5 001 - 10 000
> 10 000
Total
% n
27.8
25.1
30.8
9.6
6.7
100
% GWh
4.3
11.9
30.6
21.5
31.7
100
Standard consumers
D a
Db D c
Dd D e
Net production of the public services comes from the following sources:
Sources
Hydroelectric
Nuclear
Solid fuel
Petroleum products
Natural gas
Manufactured gas
Total
1980
30.9
26.9
21.2
18.4
1.8
0.8
100
(%)
1984
23.1
64.2
10.5
1.2
0.5
0.5
100
(b) Taxation
1. Value-added tax
2. Local taxes
The basis for the assessment of local taxes on electricity supplies was modified by the law of 29 December 1984; in practice, however, this change did not come into effect be-fore March 1985. The figures given in this study up to the beginning of 1985 thus come under the old system which can be summarized by the following table (applicable to the whole period studied):
(%)
Cities
Lille
Paris
Marseille
Lyons
Toulouse
Strasbourg
Municipal tax
8
13.2
8
8
8
-Departmental tax
1
-4
-2
4
Total
9
13.2
12
8
10
4
These taxes are applied to of the tax-exclusive price of low-voltage supplies (i.e.
standard consumers D to D ). They are not considered for VAT assessment. a e
(c) Household prices - tariffs
The 'blue' tariff introduced after the revision of the tariff system is still in effect, though it was modified on 15 February 1984 (valid in January 1985).
This tariff is made up of simple two-part formulae comprising: (i) a rental which increases with the amount subscribed to;
(ii) a single commodity rate, with an option as regards 'off-peak hours'.
The rates are as follows:
Standard consumers
D a
Db
Subscribed demand
kVA
x< 3I 3
6
9
12
15
18
Yearly rental FF/year
131.04
163.20
417.00
769.20
1 117.32
1 465.44
1 813.56
Energy price c /kWh
58.86
54.45
48.07
48.07
48.07
48.07
48.07
'Small supplies' tariff.
Off-peak hours option
Standard consumers
D c
Dd
D e
Subscribed demand
kVA
6
9
12
15
18
24
) 24
Yearly rental FF/year
677.40
1 092.00
1 521.48
1 950.96
2 380.44
3 579.24
+ 199.801
Energy price c /kWh
Peak hours Off-peak hours
48.07 27.59
48.07 27.59
48.07 27.59
48.07 27.59
48.07 27.59
48.07 27.59
48.07 27.59
The tariff for small supplies is intended to protect the least-favoured social groups.
The off-peak hours option is interesting for storage heaters. There is also an 'erasable peak day' option which is not described here as it is now little applied.
Fore more details, see the prededing study Electricity prices 1978-1984, ISBN 92-825-5166-0.
This tariff system is characterized by a progressive fixed charge rate which is more than proportional to demand (14 times more expensive when demand increases six times) and by a low price for off-peak hours (- 43%). The aim is to encourage the consumer to spread out his consumption more favourably.
(d) Household prices - analysis
The results are shown in Tables 9-11 in the annex. As there is a standard national tar-iff, the tax-exclusive price is the same at all locations. On the other hand, the price including all taxes differs from one place to another by virtue of the local taxes.
As, however, taxes are proportional, prices evolve in parallel at all places. There is thus no regional distortion in the rates of increase between 1980 and 1985.
The upward movement is mainly due to production and distribution costs; the tax burden has only gone up by 1 percentage point over the study period.
Nevertheless, the increases vary according to consumption levels ; the more the latter rise, the greater the increase in current prices as illustrated by the following table:
Standard
D a
Db D c
Dd D e
consumers kWh/year
600
1 200
3 500
7 500
20 000
1985/1980 %
+ 32
+ 52
+ 66
+ 69
+ 70
In fact, the whole system has generally been kind to the smallest consumers. This is particularly true of subscribers to the 'small supplies' tariff which was even reduced by 4% in 1984. In the same period, the other subscribers were faced with price increases of between 4 and 6%.
The result is a diminution of tariff degression; in 1985, standard consumer De pays 45%
less for a kWh than Da, whereas the reduction in 1980 was 57%. As the tariff formulae
As pointed out above, regional price differences are solely due to the tax system. The difference between the most expensive (Paris) and the least expensive city (Strasbourg) is 6%.
In addition the annexed tables show the divergent trends for small and large domestic consumers. For the small consumers (Da, D^), electricity prices go up slightly less slowly than the prices of all goods and services as reflected in the GDP index. In other words, electricity does not become dearer for them in real terms. It is even somewhat cheaper in 1985 than in 1980. The reverse holds true for the larger domestic consumers
(Dc, Dj, De) . The increase in real terms is even quite substantial for heating, and the
result is likely to be a halt in the expansion of domestic heating by electricity.
(e) Industrial prices - tariffs
Tariffs were modified on 15 February 1984.
The new arrangements were still valid in January 1985 and comprise: (i) abolition of abatements on a demand basis;
(ii) change of tariff periods; (iii) tariff standardization.
There are still three tariff families for professional and industrial uses:
1.
2.
3.
Tari
Professa
Yellow
Green ff
onal
Application
low voltage, demand < 36 kVA
low voltage, demand 36-250 kVA
medium voltage, demand > 225 kW
Standard consumers
I a
v
V
I c
The professional tariff is as follows:
Demand kVA
6 - 2 4
) 2 4
Standing charge per month1
Without off-peak
10.92 FF/kVA
18.60 FF/kVA
With off-peak
11.50 FF + 12.80 FF/kVA
11.50 FF + 20.30 FF/kVA
Commodity rate c/kWh
2 First block
54.16
Surplus
48.07
48.07
Off-peak3
27.59
27.59
Increased by the following monthly amounts as a function of lighting power:
Demand (kVA) 3 6 9 12 15 18 FF/month 40.20 80.40 120.60 160.80 201.00 241.20 The second block is 25 times the subscribed demand, rounded off in units of 3 kVA. In principle, off-peak hours are 22-6 h.
The tariff periods have been standardized for the yellow and green systems. The summer now lasts seven months and the winter peak is recorded over three months instead of four.
The basic form of these two tariffs is shown in simplified form below:
Load factor
- Yellow
> 4 000 h £ 4 000 h
- Green
> 6 000 h 4 000-6 000 h 1 800-4 000 h < 1 800 h
Reactive energy c/kVARH
Annual standing
charge
FF/kVA 353.26 116.62
FF/kW 821.46 536.27 338.41 109.16
Penalty = Bonus =
Commodity rate c/kWh
Winter
High peak
/ /
40.80 59.63 104.27 145.37
9.86 0.63
Peak hours
60.33 86.63
31.93 43.67 53.03 73.27
9.86 0.63
Off-peak hours
26.15 37.37
22.65 23.61 24.72 32.93
_
-Summer
Peak hours
18.41 19.80
12.96 15.69 17.13 20.90
0.85 0.35
Off-peak hours
9.79 10.23
9.14 9.28 10.22 11.51
_
Summer extends from April to October.
The winter peak covers two periods of two hours daily (9-11 h and 18-20 h) from December to February.
The off-peak hours comprise eight hours per day and the whole of Sunday.
Reactive energy is only calculated for the green tariff and does not give rise to any
rebate unless tg-/7 = 0.6. The standard consumers of this study hence receive a bonus of
11.57% on consumption outside the off-peak hours (since cos -P 0.9 gives tg -f 0.4843 and
0.6 - 0.4843 = 0.1157).
In order to calculate prices, one must have a complete breakdown of consumption between tariff periods. In view of th» changes to these periods, the new system given below, re-sulting from the average distribution recorded in France, has been applied.
(%)
Load factor
Winter high peak
Winter peak hours
Winter off-peak hours
Summer peak hours
Summer off-peak hours
Total
Total peak hours
Sunday supplement
1 000 h
/
55.5
-44.5
-100
-1 600 h
/
42.57
3.62
49.31
4.50
100
8.12
-2 500 h
6.44
30.60
9.28
41.52
12.16
100
21.44
3.44
4 000 h
5.17
26.55
12.15
3R.68
17.45
100
29.60
4.60
All these tariffs are standard for the whole of the metropolitan territory served by EDF with the exception of very high power requirements ( > 40 000 kW) where regional differ-ences occur but affect only a very small number of companies.
(f) Industrial prices - analysis
The results are given in Table 12 in the annex.
The prices are valid for the whole of the national territory, the only regional differ-ences still in existence affecting a limited number of very large industrial consumers ( > 40 000 kW) who are not covered by this study.
The effect of the new tariff scheme can be seen from 1983. This favours consumption in off-peak hours, and the rates of increase for consumers covering a large amount of their
requirements during these hours (Ic to Ig) are much more moderate than for the others.
Tariff degression clearly expands under these conditions. At the beginning of 1985,
standard consumer Ig was paying 60% less per kWh than a small subscriber (Ia), whereas
this reduction in unit price was 48% in 1980. The largest customer presented in this study (Ig), with an annual consumption of 24 million kWh, is close to the asymptote of the tariff curves. Indeed, an industrial company consuming five times more and account-ing for a power of 25 000 kW would only pay 5% less in unit prices.
(a) Situation in the electricity industry
The ENEL (Ente nazionale per l'energia elettrica) was established by the law of 6 Decem-ber 1962 (No 1643) and is a public service responsible for the production, transport, distribution and sale of electricity. However, the sector is not fully nationalized as the law authorized three exceptions:
(i) municipal undertakings existing before 1962, numbering about 150; (ii) self-producers, consuming at least 70% of their own production; (iii) small producers (less than 15 GWh/year).
Two further exceptions were allowed by a law in 1982 (No 308): (i) production from renewable sources;
(ii) combined electricity-heat production in installations <^ 3 000 kW.
In addition ENEL has a coordinating and managing function for the whole electrical sys-tem of the country, including the activities of non-nationalized companies.
In practice, the current structure of production is as follows:
ENEL 82% Municipal undertakings 4%
Small producers and self-producers 14%
The net production of electricity from public power stations comes from the following sources:
(%)
Sources
Hydroelectric Geothermal Solid fuels
Petroleum products Natural gas
Manufactured gas Nuclear
Other
Total
1980
25.6 1.8 9.4 57.3 4.4 0.0 1.4 0.1
100
19841
24.9 1.8 15.0 40.0 13.8 0.0 4.4 0.1
100
ENEL's selling prices must conform to the directives of the Interministerial Price Com-mittee (CIP). Tariffs are the same for the same type of consumer though there is a dis-tinction between two large zones:
(i) North and centre (Piemonte, Valle d'Aosta, Lombardy, Trentino-Alto Adige, Veneto, Friuli-Venezia Giulia, Liguria, Emilia-Romagna, Toscana, Umbria, Marche and a part of Lazio);
(ii) South and islands (a part of Lazio, Abruzzi, Molise, Campania, Puglia, Basilicata, Calabria, Sicily and Sardinia).
Three quarters of total sales are in the northern and centrai zone.
The distribution of sales is as follows (1984 estimate):
Households
Industry
Commerce, offices
Public lighting
Railways
Resale distributors
Total
(% GWh)
25
55
10.8
2
2.7
4.5
100
Household sales in 1984 were in the following blocks:
kWh/year
< 1 000
1 000 - 2 000
2 001 - 5 000
5 001 - 10 000
> 10 000
% n
30.6
30.9
3.5
3.4
0.1
% GWh
7.7
24.6
55.6
11.0
(b) Taxation
(i) Value-added tax
The tax system was modified on 1 January 1985 by a law of 19 December 1984 (No 853). In particular, value-added tax rates were modified and standardized though there is a whole set of exceptions. VAT rates applied to VAT-exclusive electricity prices have evolved as follows:
(%)
Period
1.12.1977 - 31.12.1980
1. 1.1981 - 30. 9.1982
1.10.1982 - 31.12.1984
1. 1.1985
-Domestic
6
8
8
9
Non-domestic
14
15
18
9 or 18
The normal rate of 18% has been applied to non-domestic uses since 1985 except for the extractive and manufacturing industries (including printing and publishing) which bene-fit from a reduced rate of 9%.
In this study, 18% has been counted for simplicity's sake for standard consumers I , and
I, and 9% for consumers I to I . b c g
(ii) Treasury tax (imposta erariale
This specific tax is levied on electricity sales on the basis of the following amounts which differ according to the consumer and zone:
Users
Domestic
Non-domestic
< 200 000 kWh/month > 200 000 kWh/month
Period
1978-1984
since 1981 since 1981 since 1981
North and centre
1.10
1.10 0.65
(LIT/kWh) South and
islands
0.55
0.55 0.325
Certain types of consumption are exempt from the 'imposta erariale', e.g. electrochem-ical and electrometallurgelectrochem-ical consumption, public lighting and traction.
This tax is included in the basis of assessment of VAT and is taken into account in this study.
(iii) Local taxes
A law of 30.12.1982, modified on 27.12.1983 and 22.12.1984, allows:
(a) local authorities to levy a tax on domestic consumption with the exception of the first 75 kWh/month for users having a demand up to 3 kW;
the rates have evolved as follows:
1983 10 LIT/kWh 1984 11 LIT/kWh 1985 12 LIT/kWh.
(b) the local authorities and provinces to each apply a tax on all non-domestic consumption with a subscribed demand up to 1 000 kW;
the rates have evolved as follows:
1983 4 LIT/kWh 1984 4.È LIT/kWh 1985 5 LIT/kWh.
These local taxes are included in the basis of VAT assessment.
As these local taxes have been collected by virtually all the local authorities and provinces since 1983, they are included in this study.
(c) Household prices - tariffs
The tariffs applied since the beginning of 1984 are still in effect, the only change consisting of an increase of 20.5% in the 'thermal' or fuel surcharge. For further de-tails on tariff formulae, see the previous study Electricity prices 1978-1984.
(d) Household prices - analysis
The results are given in Table 13 in the annex.
Between 1980 and 1985, current selling prices increased by 124 to 170% depending on con-sumption level.
There are three causes:
(i) increased cost of power station fuel (fuel surcharge on tariffs); (ii) tariff adjustment to take account of inflation;
The increases are somewhat lower in the northern and central zone. However, prices in the south and islands remain slightly lower, solely on account of the lower treasury tax since taxexclusive prices are the same throughout the country because of the standard national tariff. The tax system is not neutral, as the burden increases with consumption.
In 1985, it represented 10% of the price paid by a small consumer (Da) and 16% for a
large consumer ( D J ) .
The largest consumers have had to cope with the largest increases (170% since 1980) and also have to pay the highest prices. This is a specific characteristic of the 'progres sive' tariff system. The more electricity consumed, the higher the unit price. At the
present time, a customer consuming 7 500 kWh per year (Dd) pays twice as much per kWh as
a small consumer using 600 kWh (D ). α
There are four reasons for this progressive price structure:
(i) the standing charge increases more than proportionally to the quantities consumed;
when consumption goes up sixfold (600 to 3 500 kWh per year), the standing charge increases fifteenfold; for a twelvefoüd increase, the standing charge is 33 times higher;
(ii) the commodity rate is based on a progressive price block system; (iii) the fuel surcharge is higher above 3 kW;
(iv) local taxes are not levied below certain demand levels ( < 3 kW) and consumption levels (75 kWh/month).
The system results in two crucial thresholds: 900 kWh and 1 800 kWh per year. It is to the advantage of domestic consumers to keep their consumption below these levels.
Because of this progressive system and the absence of a night or offpeak hour tariff, it is not advantageous to use electricity for space heating. For this reason, allelec tric heating is very rare in Italy. Electricity is unable to compete with natural gas or even heating oil.
No prices are thus given for standard consumer D . e
Current prices for electricity for household uses have gone up more quickly since 1980 than those for all goods and services (cf. the GDP implicit price index). The discrep ancy is less large for small consumers, a social category which has been partially pro tected. As this category forms the majority of the clientele, this takes on particular importance. The average consumption per household subscriber is moderate; currently 1 895 kWh per year, it is on the increase.
(e) Industrial prices tariffs
Tariffs for nondomestic uses were modified by Regulation No 12/1984 of the CIP.
Two systems coexist:
(i) one based on demand, but with a standard commodity rate (general tariff);
The first system can be summarized in a simplified table valid from 1 January 1985:
Load factor
Voltage
Demand charge LIT/kW/month
Commodity rate LIT/kW/h ^ 20 kW
21 30 kW 31 100 kW > 100 kW
Thermal surcharge LIT/kW
^ 500 kW > 500 kW (1st block)
> 500 kW (surplus)
Standard consumers
Low < 750 h
LV
2 980
131.35 / / /
69.90 /
/
MV
2 480
109 / / /
63.85 64.95
/
Reduced 7501
LV
4 390
108.15 108.15
/ /
69.90 /
/
I a
000 h
MV
3 640
92.80 92.80
/ /
63.85 64.95
/
Normal 1 0004
LV
7 900
75.80 75.80 75.80 60.35
69.90 69.90
/
000 h
MV
6 770
65.45 65.45 65.45 51.75
63.85 64.95
6
h
I cXd
High >/4 000 h
LV
11 010
/ / / 51.40
69.90 69.90
/
MV
9 330
/ / / 44.60
63.85 64.95
6
I e
LV = low voltage (■£ 0.4 kV).
MV = medium voltage ( > 0.4 kV < 50 kV),
The way in which the demand factor is calculated and billed was explained in the previ ous study (Electricity prices 19781984), to which reference should be made as no change has occurred since.
The application of the commodity rate has simplified the demand blocks in comparison with the 1984 tariffs. This single commodity rate is now only divided up into four de mand blocks.
Nondomestic subscribers living in the south and the islands, having a subscribed demand
of ζ 30 kW, are allowed 25% off the demand charge and the commodity rate.
The tariffs given above apply to a demand up to 2 000 kW.
For subscribers exceeding this amount, there is a tariff known as the 'multi-period' tariff which has different demand charges and commodity rates for each of five hourly/ seasonal periods.
An extract from this tariff is given in the simplified table below which is valid from 1 January 1985:
Periods
Winter high peak
Winter peak hours
Summer peak hours
Winter off-peak hours
Summer off-peak hours
Standard consumers
Demand kW
¿ 3 000 3 001 - 10 000 > 10 000
High utilization
Energy price LIT/kWh
94.45
62.35
28.80
6.90
6.90
Demand charge LIT/kWh/
year
133 680 108 240 82 200
72 480
34 680
7 800
3 240
Jf
Very high utilization
Energy price LIT/kWh
76.40
42.65
18.60
5.95
5.95
Demand charge LIT/kWh/
year
188 400 163 080 136 920
112 080
55 440
10 560
4 560
I g
This tariff is for consumers receiving a medium voltage supply (^ 50 kV). Lower rates are provided for high and very high voltage ( > 50 kV).
The demand charge is that of the period in which the maximum annual demand was metered.
In this study it was considered that the maximum demand requirement of standard consum-ers was in the winter peak periods. In this case, the standing demand charge depends on the demand level. The breakdown of consumption by period is as follows (in percent):
Winter Winter Summer Winter Summer
high peak peak hours peak hours off-peak hours off-peak hours
11 31 27 17 11
78 02 64 78 78
This corresponds to the average readings of subscribers to the multi-period tariff.
To this must be added the fuel surcharge calculated as for the tariff.
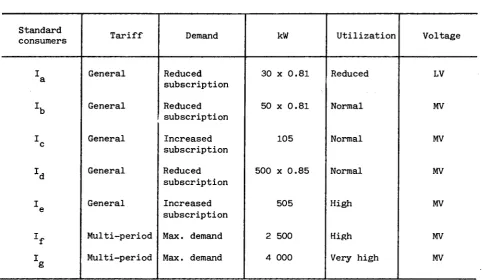
In summary, the most suitable tariff system for standard consumers in this study is as follows :
Standard consumers
I
h
I
zd
I
Jf
I g
Tariff
General
General
General
General
General
Multi-period
Multi-period
Demand
Reduced subscription
Reduced subscription
Increased subs