The Fiddler Crab Claw-waving Display:
An analysis of the structure and function of a
movement-based visual signal
Martin J. How
A thesis submitted for the degree of Doctor of Philosophy from
The Australian National University
ii
Declaration
This thesis is an account of research undertaken between March 2004 and
September 2007 at the Research School of Biological Sciences, The Australian
National University, Canberra, Australia. Except where acknowledged in the
customary manner, the material presented in this thesis is, to the best of my
knowledge, original and has not been submitted in whole or in part for a degree
in any other university. I am the senior author and the principal contributor to all
aspects of the co-authored papers within.
………
Abstract
Communication is an essential component of animal social systems and a
diverse suite of signals can be found in the natural environment. An area of
animal communication that, for technical reasons, we know very little about is
the field of ‘movement-based’ or ‘dynamic’ visual signals. In this thesis, I make
use of recent advances in measurement and analysis techniques, including
digital video and image motion processing tools, to improve our understanding
of how movement-based signals are adjusted according to signalling context. I
measured and characterised the flamboyant claw-waving displays of male
fiddler crabs (Genus Uca) and made use of their transparent lifestyle to record
the behavioural contexts in which these signals are produced
The claw-waving displays of seven Australian species of fiddler crab are
compared and contrasted to show that these signals are species-specific, but
also vary within and between individuals. I show that the species Uca perplexa
produces different types of signal in different behavioural contexts, a lateral
wave for courtship, and a vertical wave during short-range agonistic and
courtship interactions. The structure of the lateral courtship waves of U. perplexa
vary according to the distance of signal receivers, the first time this kind of
relationship has been shown in a dynamic visual signal. Finally, I describe and
analyse the signalling and orientation behaviour of U. elegans during courtship
herding, an unusual mating system that uses the claw-waving display in a novel
way.
The adjustments made by fiddler crabs to their displays during changes in
behavioural contexts suggest that the fine-scale context-sensitivity of animal
Acknowledgements
This thesis would not have been possible without the help of a number of people
and institutions.
I would first like to thank the Research School of Biological Sciences at
The Australian National University (RSBS, ANU) for providing funding and
research facilities for the duration of this PhD. I also would like to acknowledge
support from the Deputy Vice Chancellor’s fund for fieldwork assistance and the
ARC Centre of Excellence in Vision Science at ANU for providing additional
assistance. Fieldwork accommodation and facilities were provided by the ANU’s
North Australian Research Unit and the Australian Institute of Marine Science.
I would like to thank my PhD supervisors Jochen Zeil, Jan Hemmi and
Richard Peters for their fantastic and unending support, for without their
continual advice and encouragement this project would not have been possible.
Jochen’s passion for understanding how animals interact with the world, his
elegant style of research, and his eternal enthusiasm for the pursuit of
intellectual progress, scientific and otherwise, serve as a shining example of
academia done well. Similarly, Jan’s rigorous analytical approach and continual
scientific inspiration provide a reminder of what science is really about. Not to
forget all of the camping, hiking, long-distance driving and drinking experiences
that I have enjoyed with them along the way. I would also like to thank my PhD
advisor Pat Backwell for providing valuable fieldwork help and advice in Darwin.
Many other individuals contributed to this research in some form or
another. I have received help and advice along the way from many researchers
at ANU and elsewhere, including Johannes Zanker, Norbert Boeddeker, Michael
Jennions, Waltraud Pix, Wolfgang Stuertzl and Ajay Narendra. Thanks also to
viii
the custom-made video camera mounting system and other experimental
equipment for fieldwork. I would also like to thank Mark Snowball at RSBS for
designing, building and fixing electronic equipment and Emlyn Williams at the
Statistical Consulting Unit for help with the published parts of this thesis. I would
also like to thank my fellow students for their advice and support, including
Jochen Smolka, Wiebke Ebling, Andreas Pfeil, Riccardo Natoli, Regan Ashby,
Nicole Carey, Tanya Detto, Aung-Si, Emily Baird, Richard Berry, Leeann
Reaney, Ali Alkaladi, Peter Kozulin and Alex McWilliams to name but a few, and
the entire ANU lunchtime soccer contingent for helping to keep me fit and sane.
I would like to thank my parents, John and Jenny and my brother Roger,
for the continuous support that they have provided, both pre-PhD and for the
duration, especially mum for all the last minute proof-reading that I threw her
way.
Finally, I would like to thank Molly for making this work. She has stuck
with me through thick and thin and provided me with unerring love and support
Contents
Chapter 1. Introduction... 1
1.1. Animal communication ... 3
1.1.1. Defining communication signals... 3
1.1.2. Visual signals and movement-based displays ... 4
1.2. Introduction to fiddler crabs ... 5
1.2.1. Fiddler crab vision... 7
1.2.2. The claw-waving display ... 9
1.3. Thesis background and summary ... 10
Chapter 2. Measuring motion ... 13
2.1. Introduction ... 15
2.2. Qualitative methods ... 16
2.2.1. Verbal descriptions ... 16
2.2.2. Pictograms and cartoons ... 16
2.3. Quantitative methods ... 18
2.3.1. Temporal coding of displays ... 18
2.3.2. Measuring structural features... 21
2.4. Whole-image analysis: a receiver’s perspective... 25
2.4.1. Gradient detectors ... 26
2.4.2. Correlation detectors... 28
Chapter 3. Comparative form of fiddler crab claw-waving displays ... 35
3.1. Introduction ... 37
3.2. Methods ... 41
3.2.1. Data collection and analysis ... 41
3.2.2. Cluster analysis... 42
3.3. Results ... 44
3.3.1. Subgenus: Celuca (Crane, 1975)... 44
3.3.2. Subgenus: Australuca (Crane, 1975)... 51
3.3.3. Subgenus: Thalassuca... 64
3.4. Inter-specific display variation ... 68
3.4.1. Geographic variation in display structure ... 74
3.4.2. Display variation within and between individuals ... 76
3.5. Discussion... 80
3.5.1. Species specificity... 82
3.5.2. Geographic variation... 85
3.5.3. Individual display variability... 86
x
Chapter 4. The differences in context and function of two distinct waving
displays in the fiddler crab, Uca perplexa (Decapoda: Ocypodidae) ...89
4.1. Abstract...91
4.2. Introduction ...92
4.3. Methods ...95
4.3.1. Statistics ...97
4.4. Results...99
4.4.1. The structure of waving displays ...99
4.4.2. Display context: General observations ...101
4.4.3. Display context: Behavioural changes in the presence of wanderers ...103
4.4.4. Display context: Wave rates ...106
4.4.5. Display context: burrow-descent frequency ...107
4.4.6. Display context: Position and orientation...108
4.5. Discussion ...112
4.5.1. Signal design and active space ...112
4.5.2. Behavioural changes in response to the presence of wanderers 113 4.5.3. The function of vertical waves ...114
4.5.4. From context to function ...115
Chapter 5. Claw-waving display changes with receiver distance in fiddler crabs (Uca perplexa). ...117
5.1. Abstract...119
5.2. Introduction ...120
5.3. Methods ...123
5.3.1. Statistics ...124
5.4. Results...126
5.5. Discussion ...132
5.5.1. Temporal modulation...132
5.5.2. Structural modulation...132
5.5.3. Judging distance...134
5.6. Summary ...135
Chapter 6. Claw-waving and the control of courtship herding in the fiddler crab Uca elegans 137 6.1. Introduction ...139
6.2. Methods ...142
6.2.1. Statistics ...143
6.3. Results...145
6.3.1. The claw-waving display...145
6.3.2. Female movements ...152
6.3.3. The control of herding behaviour ...153
6.4. Discussion ...164
6.4.2. Control systems ... 167
6.4.3. Courtship herding: coercion or mate choice... 168
Chapter 7. General discussion ... 171
7.1. Introduction ... 173
7.2. The information content of dynamic visual displays ... 174
7.2.1. Location beacons... 174
7.2.2. Signalling identity ... 175
7.2.3. Indicators of fitness ... 178
7.2.4. Signalling intent... 179
7.3. The perception of dynamic visual displays ... 180
7.3.1. Speed, distance and receptor tuning ... 181
7.3.2. The influence of contrast... 181
7.3.3. The problem of motion noise ... 183
7.4. Conclusions... 184
Appendices... 185
List of figures
Figure 1.1. Examples of movement-based signals. ... 5
Figure 1.2. Photographs of a fiddler crab (Uca perplexa) and some examples of fiddler crab habitats. ... 7
Figure 1.3. The fiddler crab visual system. ... 8
Figure 1.4. The role of the horizon in the visual system of the fiddler crab. ... 9
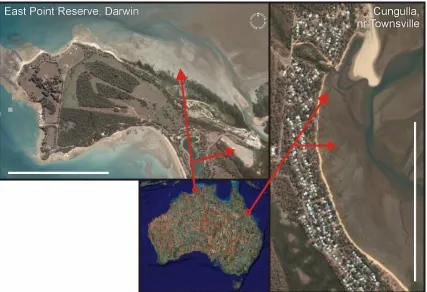
Figure 1.5. The two fieldwork locations... 12
Figure 2.1. Pictograms and cartoons representing movement displays. ... 17
Figure 2.2. Examples of Markov models for representing dynamic visual displays. ... 19
Figure 2.3. Temporal structure of movement-displays. ... 20
Figure 2.4. Trajectory analysis. ... 23
Figure 2.5. Time series of movements during visual displays in three different species... 24
Figure 2.6. Gradient detector outputs from analyses of dynamic visual signals... 27
Figure 2.7. The Reichardt detector. ... 29
Figure 2.8. The 2-Dimensional Motion Detection (2DMD) model. ... 30
Figure 2.9. Constructing a kinetograph... 32
Figure 3.1. Illustration of the two main behavioural and morphological subdivisions of fiddler crabs. ... 38
Figure 3.2. Phylogeny of Australian fiddler crab species... 40
Figure 3.3. The claw-waving display of U. mjoebergi. ... 47
Figure 3.4. The claw-waving display of U. perplexa. ... 50
Figure 3.5. The claw-waving display of U. polita. ... 54
Figure 3.6. The claw-waving display of U. seismella. ... 57
Figure 3.7. The claw-waving display of U. signata. ... 60
Figure 3.8. The claw-waving display of U. elegans. ... 63
Figure 3.9. The claw-waving display of U. vomeris. ... 67
Figure 3.10. Summary of claw-waving display choreography for each species. ... 69
Figure 3.11. A comparison of three wave variables across species... 72
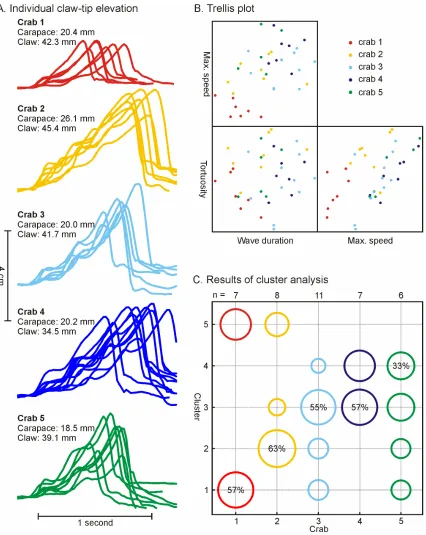
Figure 3.12. Intra- and inter-individual variation in the claw-waving display of U. elegans. ... 77
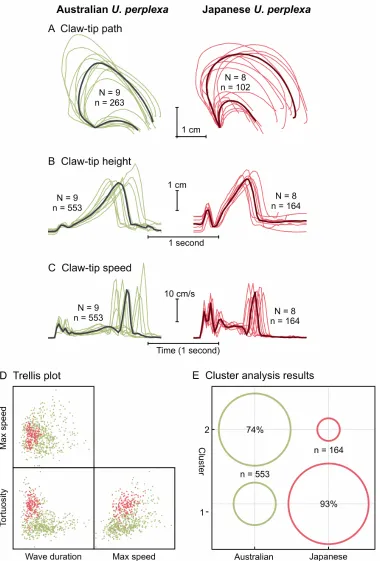
Figure 3.13. Cluster analysis of the U. perplexa lateral claw-waving display. ... 79
Figure 3.14. Comparison of Australian and Japanese U. perplexa claw-waving displays. ... 75
Figure 3.15. Phylogenetic summary of characteristics over the seven study species. ... 81
Figure 4.1. Comparison of lateral and vertical waves from an individual male U. perplexa. ... 100
Figure 4.2. Frequency distribution of inter-wave intervals for lateral and vertical waves. ... 101
xiv
Figure 4.4. Mean lateral and vertical wave rates ... 106
Figure 4.5. Bearing and orientation of resident male crabs relative to wanderers and the home burrow. ... 110
Figure 5.1. The lateral wave of U. perplexa. ... 122
Figure 5.2. Modulation of signal variables relative to receiver distance... 127
Figure 5.3. The frequency of walking leg movements, depending on receiver distance. ... 129
Figure 5.4. Close-range variation of claw speed and height. ... 130
Figure 5.5. The effect of receiver distance and time from start on claw flex angle. ... 131
Figure 6.1. Anterior and posterior images of male U. elegans... 141
Figure 6.2. The claw waving signal of U. elegans. ... 145
Figure 6.3. Changes in claw-wave characteristics over the four phases of courtship behaviour in U. elegans... 147
Figure 6.4. Three examples of herding interactions in U. elegans viewed from above. ... 149
Figure 6.5. Relative azimuthal positions of female wanderers... 150
Figure 6.6. Movements of wandering female U. elegans... 153
Figure 6.7. Azimuthal position of wandering females in the field of view of outward running males... 155
Figure 6.8. Simulated outward runs for U. elegans. ... 158
Figure 6.9. Anti-sense simulated outward runs for U. elegans. ... 159
Figure 6.10. Test of the outward run control system model. ... 162
Figure A1. Schematic diagram of a fiddler crab: dorsal view. ... 186
Figure A2. Schematic diagram of a fiddler crab: ventral view ... 187
Figure A3. Scatter-graphs illustrating 2DMD sampling base and time constant parameters. ... 188
Figure A4. Speed sensitivity of the 2DMD motion detection model. ... 189
Figure A5. Contrast sensitivity of the 2DMD motion detection model. ... 190
List of tables
1.1. Animal communication
Animals have evolved many different methods for sensing their environment and
have adapted to use many of these sensory modalities for the purpose of
communication. In consequence, the animal world is full of signals - visual,
auditory and olfactory among others - conveying a diverse range of information
within and between animal species. The study of animal communication has
been the concern of various scientific disciplines, including behavioural ecology,
evolutionary biology and neuroethology. There have been many studies to date
on certain types of signals, such as auditory communication and colour signals.
However, an area of communication that, for technical reasons, has been little
studied is the field of ‘movement-based’ or ‘dynamic’ visual signals. This thesis
aims to contribute to our understanding of movement-based visual signals by
presenting an investigation into the claw-waving displays of fiddler crabs.
1.1.1. Defining communication signals
When commencing a study of animal communication, it is important to define
clearly what is meant by the term ‘signals’. The definition proposed by Maynard
Smith and Harper (2003) is one of the most clear and robust:
“… a ‘signal’ [is] any act or structure which alters the behaviour of
other organisms, which evolved because of that effect, and which is
effective because the receiver’s response has also evolved.”
These authors go on to make the important distinction between signals
and cues, which are defined by Hasson (1994) as follows:
“… [a cue is] any feature of the world, animate or inanimate, that can
4
A common example used to distinguish between signals and cues is that
of body size. During a contest an animal’s size can often be used as a fair
indication of its strength. In this case, size has not evolved for the purpose of
signalling strength to an opponent, but acts as a cue from which strength can be
inferred. However, if the opponent were to perform some kind of posture to
emphasise its size, this would be termed a signal.
1.1.2. Visual signals and movement-based displays
Vision is undoubtedly one of the most important means by which animals collect
information about their environment. Visual information is used for guiding
movements, for detecting threats, for perceiving mates, for finding food, and for
a myriad other functions (Land & Nilsson, 2006). The importance of vision for
animals is illustrated by the evolutionary complexity of light-detecting organs,
ranging from simple light-sensitive membranes in unicellular bacteria to the
complex compound eyes of insects and crustaceans and the camera eyes of
mammals (reviewed by Land & Nilsson, 2002). Communication in the visual
sensory modality is ubiquitous in nature, as demonstrated by the use of colour
patterns, postures and movement to convey information such as fitness,
palatability and species identity.
The use of movement as a visual signal is widespread in animal
societies. Such signals are produced by species across a wide taxonomic range
and in diverse behavioural contexts. For example, jacky dragons (Amphibolurus
muricatus) and jumping spiders (Habronattus pugillis) perform elaborate body
movements during territorial or courtship interactions (Fig. 1.1A-B, Drees, 1952;
Land, 1972; Peters & Evans, 2003a; Elias et al., 2006a). However, of all the
types of animal signals in nature, movement-based visual signals are among the
least well understood and it is only recently that the technology has been
available to address this. Although crustaceans may, at first, seem unlikely
and produce little in the way of dynamic visual signals), one genus stands out:
the fiddler crabs (Fig. 1.1C).
Figure 1.1. Examples of movement-based signals. A) Jacky dragon push-up display (Peters & Evans, 2003a). B) Jumping spider foreleg wave (Elias et al., 2006a). C) Fiddler crab claw-waving display.
1.2. Introduction to fiddler crabs
Fiddler crabs (Crustacea; Malacostraca; Decapoda; Brachyura; Ocypodidae,
Uca) are small, colourful, highly social crustaceans that inhabit tropical inter-tidal
mudflats and mangroves around the world (Fig.1.2). There are currently 97
recognised species of fiddler crab, 17 of which inhabit Australian shores
(George & Jones, 1982; Rosenberg, 2001). Fiddler crabs are easily identifiable
by the large, asymmetric major claw of the male, which is used as a weapon,
and as a signalling device (Berglund et al., 1996; also see appendices 1 and 2
for fiddler crab anatomy). Individual males and females occupy burrows from
which they emerge to feed when the mudflat is exposed by the tide. Whilst
active on the mudflat surface, fiddler crabs divide their time between feeding,
6
mud from the mudflat surface using the small feeding claws, of which females
have two, and males have only one. The mud scrapings are then passed up to
the mouthparts, where they are sifted for microscopic algae, bacteria and
detritus (Robertson et al., 1980; Weissburg, 1992; Reinsel & Rittschof, 1995).
Both male and female fiddler crabs are territorial and guard their burrows from
intruders (Salmon, 1984; Wolfrath, 1993; Yamaguchi & Tabata, 2004). The
burrow is an important resource for fiddler crabs as it contains water needed for
respiration (fiddler crabs are semi-terrestrial, and so must continuously replenish
the water in their branchial chamber) and shelter from predators (Wilkens &
Fingermann, 1965; Christy, 1982; Takeda et al., 1996). The genus are also
highly social, and employ an array of signals for intra-specific communication,
including seismic signals (Salmon & Hyatt, 1983), chemical cues (Trott et al.,
1997), colour patterns (Detto et al., 2006; Hemmi et al., 2006) and, the focus of
this thesis, movement-based signals (Hyatt, 1977; Zeil & Zanker, 1997). Much of
their social activity varies according to temporal cycles linked to the local tidal
regime. For example, reproductive activities tend to occur in semi-lunar or lunar
rhythms to enable females to time larval release relative to the spring tide
(Christy, 1978; Zucker, 1978; Morgan & Christy, 1995; Yamaguchi, 2001). Also,
moisture levels and temperature on the mudflat tend to vary relative to the time
since the last tidal inundation, influencing foraging and other activities over the
Figure 1.2. Photographs of a fiddler crab (Uca perplexa, left) and some examples of fiddler crab habitats (middle, right).
1.2.1. Fiddler crab vision
Fiddler crabs perceive the world through compound eyes, consisting of
thousands of tiny optical units (ommatidia) that individually sample different
parts of the visual space (Fig. 1.3A-B). These eyes are arranged on stalks high
above the body (Fig. 1.3C), thus decompressing distance information from the
mudflat surface and providing a panoramic field of view. Like many animals that
live in a flat environment, fiddler crabs have an area of high visual acuity that
corresponds with the horizon (Fig. 1.3D; Horridge, 1978; Zeil et al., 1986; Land
& Layne, 1995a; Zeil & Al-Mutairi, 1996). This can be determined by measuring
the position, shape and size of the pseudopupil (the dark area on the eye in
which the ommatidia face directly towards the observer) from different viewing
angles using a goniometric microscope stage (e.g. Fig. 1.3B; Horridge, 1978;
Land & Layne, 1995a; Smolka, unpublished). Because fiddler crabs live in a flat
world, and because they carry their eyes in a fixed position above the body, they
are able to functionally partition their visual field (Land & Layne, 1995a; Layne et
al., 1997; Layne, 1998; reviewed by Zeil & Hemmi, 2006). Objects moving above
the visual horizon (viewed in the upper hemisphere of the eye) are generally
[image:23.612.113.544.77.285.2]8
predators. In contrast, objects moving at or below the visual horizon (viewed in
the lower hemisphere of the eye) are the same height or shorter than the
observer, and are therefore classed as objects of social importance, such as
territorial intruders or potential mates (Fig. 1.4).
Figure 1.4. The role of the horizon in the visual system of the fiddler crab. Objects larger than the crab appear above the horizon, whilst conspecifics appear below the horizon (from Zeil & Hemmi, 2006).
1.2.2. The claw-waving display
One of the most striking features of the fiddler crab genus is the male’s
asymmetrical large claw. In some species the claw can grow five times longer
than the minor claw and can represent up to 50% of the total body mass
(Rosenberg, 2002). The major claw is used as a weapon during agonistic
encounters and as a signal during social interactions (Berglund et al., 1996).
One of the most conspicuous signals produced by fiddler crabs is the
flamboyant claw-waving display. In some species the display attains high levels
of complexity, incorporating combinations of lateral claw extensions (unflexions),
vertical lifts, momentary pauses and jerks (Salmon, 1967; Salmon & Atsaides,
1968), accompanied by elaborate leg, body and minor claw movements (Crane,
1975). Historically, there has been some debate over the function of
claw-waving within the genus. Some studies have demonstrated that males increase
wave rate in the presence of females (Altevogt, 1957; Salmon & Atsaides, 1968;
Pope, 2000, 2005), whilst others suggest a purely territorial function (Verwey,
10
rules governing claw-wave function for all fiddler species. However, some
generalities can been made linking the function of claw-waving to the type of
reproductive strategy employed by each species (Crane, 1957, 1975; deRivera
& Vehrencamp, 2001), and this will be discussed in some detail at various points
in this thesis.
1.3. Thesis background and summary
This thesis represents 3.5 years of work on the visual ecology of fiddler crab
communication, and aims to provide an in-depth analysis of the
movement-based visual signals of Australian fiddler crabs. Fieldwork was conducted
between May 2004 and October 2006 in two locations within Australia: Cungulla,
Queensland (19°23.17’S 147°06.90’E) and Darwin, Northern Territory
(12°24’49”S 130°50’09”E) (Fig.1.5).
Firstly, in chapter 2, I conduct a review of techniques used to study
movement-based signals. I discuss different methods that have been used,
ranging from verbal descriptions of movement displays to the analysis of
whole-image sequences using biologically inspired motion detection models. The
chapter ends with the description of a novel technique developed through the
course of this thesis in collaboration with Richard A. Peters, for characterising
and analysing movement-based signals: the ‘kinetograph’. In chapter 3, I
conduct a comparative analysis of the choreography of the claw-waving signal of
seven Australian species of fiddler crab; U. mjoebergi, U. perplexa, U. polita, U.
seismella, U. signata, U. elegans and U. vomeris. I compare and contrast claw
movements of each species and discuss them in the context of species
behavioural and visual ecology. I include additional data indicating geographical
differences in display structure for one species, U. perplexa. In chapters 4 and 5,
I present an in-depth study of the claw-waving display of the fiddler crab U.
perplexa. In the first of these chapters, I investigate the unusual use of two
distinct claw-waving displays by this species and I elucidate the different
species uses a lateral wave for mate attraction and courtship, and a vertical
wave for agonistic signalling and during close-range courtship interactions.
Then, in chapter 5, I investigate the effect of receiver distance on the structure of
U. perplexa’s lateral claw-waving display during experimentally induced
courtship interactions. I show, for the first time in a movement-based visual
signal, that both temporal and structural features of the display vary according to
the distance of the signal receiver. Both chapters 4 and 5 have been accepted
for publication in international peer-reviewed journals (How et al., 2007; How et
al., In Press) and appear as published. In chapter 6, I conduct the first study of
signalling and courtship herding in U. elegans. I describe, in detail, the
posteriorly directed claw-waving display and suggest a simple visual control
system that may be used for guiding male herding movements. Finally, I
conclude with chapter 7, a general discussion of the importance of the design of
12
[image:28.612.73.500.73.365.2]
2.1. Introduction
Animal communication signals are ubiquitous in nature and play an important
role in the lives of many animal species. The importance of communication and
the evolutionary pressures that shape signal structure have been the focus of
many scientific studies, and advances have closely followed developments in
methods for recording and analysing these signals. Historically, many such
studies have focussed on auditory signals, especially since the development of
oscillographic and sonographic sound analysis techniques in the 1940s and
1950s (e.g. Koenig et al., 1946) and more recent advances in software for
quantifying and analysing sound spectra (reviewed by Hopp et al., 1998).
Similarly, the importance of colour for animal communication has benefited from
advances in techniques for the analysis of light spectra and from developments
in our understanding of the physiological basis of colour vision (reviewed by
Endler, 1990; Bradbury & Vehrencamp, 1998; Kelber et al., 2003). However,
until the last 10 years or so, there have been relatively few advances in
techniques for studying the biological efficacy of movement-based visual
communication signals. Such techniques are necessary to allow researchers to
compare and contrast such signals within and between individuals, and to study
them from the sensory perspective of the receiver.
This chapter will outline some of the pioneering classical methods for
studying dynamic visual displays in animals. First, qualitative methods, including
verbal descriptions and pictograms, are discussed. Then quantitative methods
are addressed, starting with the temporal coding of display sequences and the
measurement of structural features. Finally, the chapter ends by presenting
recent advances in technology that allow researchers to quantify biological
motion from natural scenes as viewed from the perspective of signal receivers.
Such advances enable the analysis of movement-based visual signals in
16
2.2. Qualitative methods
2.2.1. Verbal descriptions
“Diminishing waves pronounced during moderate to high
intensity display, each series starting with a regular, circular wave and
followed by two to four circles of decreasing amplitude. Body raised
and lowered only during the first wave. Curtsies, confined to
courtship, start at beginning of a series, the cheliped usually being
held extended, with the waves interrupted throughout a series of
curtsies, but with the cheliped not making downstrokes. Vertical
waves not seen…”
Jocelyn Crane, 1975. The fiddler crabs of the world. p300
Qualitative descriptions of movement-based visual signals have long
been a part of the scientific literature. Verbal descriptions of movement-based
visual displays can be very useful for species identification, comparisons, and as
general background to other qualitative techniques for representing signal
structure. Jocelyn Crane based many of her phylogenetic decisions about fiddler
crab species identification on observations of their claw-waving displays (Crane,
1957), and verbally described these in detail in her monograph (Crane, 1975).
Birds of paradise have also had their flamboyant courtship displays described in
profound detail by many authors (e.g. Frith & Frith, 1988; Jones &
Pruett-Jones, 1990). However, as illustrated by the quotation at the beginning of this
paragraph, verbal descriptions can be cumbersome and difficult to interpret.
2.2.2. Pictograms and cartoons
More intuitive than verbal descriptions are pictographic representations of
been used extensively to describe, compare and contrast displays in a variety of
animal species. For example, the complex display of the superb bird of paradise
Lophorina superba lends itself well to this kind of description as it involves a
series of distinct display postures combined with movement components (Fig.
2.1A, Frith & Frith, 1988). Displaying male sage grouse (Cetrocercus
urophasianus) repeatedly bulge oesophageal air sacs creating a conspicuous
auditory and visual display and this is well described by side and front view
photographs of the display (Fig. 2.1B, Dantzker et al., 1999).
Figure 2.1. Pictograms and cartoons representing movement displays. A) Courtship display of the superb bird of paradise Lophorina superba. From left to right: sleeked posture; cape-flicking and crown-presentation posture; high intensity display posture; crouched high intensity display (Frith & Frith, 1988). B) Strut display of male sage grouse Cetrocercus urophasianus (Dantzker et al., 1999). C) Claw-waving displays of male crabs from the genus Uca and Goniopsis
18
Rather than simply representing static postures during movement-based
signalling, illustrations can also code aspects of the movement of body parts.
The claw-waving displays of Ocypodid crabs have been well described using
sequential time-spaced display illustrations (e.g. Fig. 2.1C, Schöne, 1968;
Salmon & Atsaides, 1968). Hartmann et al (2005) illustrated the start and end
limb position to describe the visual signals of Brazilian anurans (Fig. 2.1D).
2.3. Quantitative methods
For species identification and phylogeny, the qualitative methods described
previously can perform a useful function. However, to study the more fine-scale
structure, timing and variation in often complex dynamic visual signals requires
the use of more quantitative analysis techniques.
2.3.1. Temporal coding of displays
Early researchers often focused on species-specific properties of animal
communication signals. However, intra and inter-individual variations in signals
can often be related to factors of biological importance, such as environmental
noise (e.g. Peters et al., 2007), reproductive fitness (e.g. Matthews et al., 1997)
and fine-scale behavioural context (e.g. Gibson, 1996). Such variation in
sequence can be represented by a probability of transition. Components that
always occur sequentially thus have a transitional probability value of 1, whilst
displays that never occur in sequence have a value of 0. An entire display can
be represented in terms of transitional probabilities in a process known as
‘Markov chain analysis’ (Markov, 1906). Not only does this technique allow for
the temporal characterisation of behavioural sequences, but it also enables the
user to statistically compare sequences of actions. Such an approach has been
used extensively to analyse the temporal sequence properties of auditory
communication signals (e.g. Hailman et al., 1985; Tauber & Eberl, 2002; Suzuki
visual displays (e.g. Fig. 2.2A, Losey & Sevenster, 1995; Fig. 2.2B, Peters &
Ord, 2003).
Figure 2.2. Examples of Markov models for representing dynamic visual displays. A) Temporal sequence of three-spined stickleback display (Gasterosteus aculeatus; Losey & Sevenster, 1995). Transitional probabilities are encoded in the thickness of the connecting arrows. B) Markov model of jacky dragon (Amphibolurus muricatus) visual display components (Peters & Evans, 2003a). Transitional probabilities are provided as values ranging between 0 and 1.
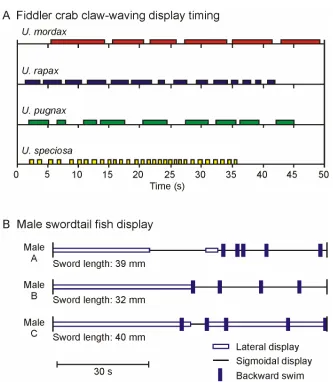
Another method for quantifying and comparing the temporal sequence of
movement-based visual displays is to count signal occurrence over time. At their
most basic, counts contain information about the temporal spacing and rate of
signalling. Counts can also be performed on various components of displays,
[image:35.612.115.533.135.534.2]20
display. For example, by recording the start and end of waving displays of
different species of fiddler crab, researchers have demonstrated the
species-specificity of signal timing within the Uca genus (Fig. 2.3A; Salmon, 1967;
Salmon & Atsaides, 1968). Another example is provided by Rosenthal et al
(1996), who represented the courtship behaviour of male green swordtail fish
(Xiphophorus helleri) from a test sequences in a video playback experiment by
coding periods of display with different symbols and plotting these along a time
axis (Fig. 2.3B).
Figure 2.3. Temporal structure of movement-displays. A) Time series of claw-waving displays for four different fiddler crab species, Uca mordax, U. rapax, U. pugnax and U. speciosa. Beginning and end of each coloured bar indicate start and finish of a single display (redrawn from Salmon, 1967). B) Courtship behaviour of three male green swordtails Xiphophorus halleri
[image:36.612.119.452.253.635.2]
As well as comparing signalling rates between species, counts over time
can be useful for analysing the timing of signals within and between individuals.
For example, by recording signal timing within groups, some animals have been
shown to synchronise their visual displays with those of their neighbours
(Aizawa, 1998; Backwell et al., 1998, 1999; Burford et al., 1998). Similar signal
synchronisation occurs in auditory communication (e.g. Schwartz & Wells, 1984;
Sismondo, 1990) and in bioluminescence displays (e.g. Hanson et al., 1971;
Buck et al., 1982). Also, counts of display occurrence in specific contexts can
give an indication of the function of the display. For example, Radder et al.,
(2006) recorded the number of various types of visual display produced by
Indian agamid lizards (Psammophilus dorsalis) in specific social contexts and
were able to show both sexual and context-related differences in the types of
display produced. In another example, the frequency of visual displays in male
guppies was linked to aspects of reproductive fitness, including ejaculation rate
(Matthews et al., 1997). Similar examples of correlative studies linking simple
measures of display frequency and timing to contextual information are common
in the literature (e.g. Backwell et al., 1999; Murai & Backwell, 2006; Patricelli et
al., 2006).
2.3.2. Measuring structural features
The next level of complexity in methods for analysing movement involves
measuring the spatial position of relevant body parts during a display. These can
be plotted to provide an indication of the trajectory of various body parts. For
example, von Hagen (1983) traced the position of the claw-tip and elbow during
fiddler crab claw-waving displays by projecting video sequences filmed at
crab-eye level onto a sheet of paper, and plotting body positions frame-by-frame. This
method allowed for the quantification of structural differences in the claw-waving
displays of two sympatric species, U. mordax and U. burgersi. Similar methods
using custom-made video analysis software are used in chapters 3 and 5 of this
22
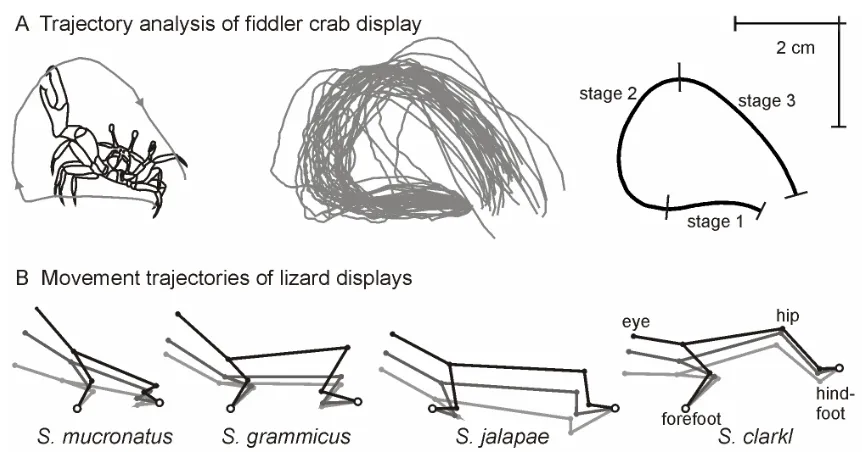
Using shape analysis techniques (MacLeod, 1999) it is possible to
calculate mean claw-tip trajectories from multiple wave traces (Fig. 2.4A).
Briefly, this method requires each claw-tip trace (Fig. 2.4A, middle) to be
reassigned with a fixed number (in this case 300) of evenly spaced x-y
coordinates. The mean claw-trace can then be calculated by simply averaging
each of these newly assigned coordinates over the full number of traces (Fig.
2.4A, right). This technique provides an estimate of the average shape of the
trajectory, but the process of reassigning evenly-spaced coordinates loses
temporal information needed to calculate parameters such as claw-tip speed.
Also, small-scale structural features can be lost, such as the small pauses in the
upstroke of some fiddler crab displays (see chapter 3, Fig. 3.8). The loss of
temporal and structural features can be minimised by breaking the display up
into sequential components. For example, in the analysis of the display of U.
perplexa in figure 2.4, the structure of the movement was divided into three main
parts, the lateral unflexing of the claw (stage 1), the claw uplift (stage 2) and the
claw down-swing (stage 3). The mean shape of each of these three stages was
calculated separately using the methods above and then combined.
Another example of the use of such trajectory analysis techniques is the
comparative analysis of lizard head and body movements performed by Purdue
and Carpenter (1972). These researchers plotted seven key body parts from
video sequences of displays viewed from the side of four different
closely-related lizard species (Fig. 2.4B). By analysing angular changes during the
different displays they were able to compare statistically the divergence in signal
Figure 2.4. Trajectory analysis. A) Illustration of claw-tip trajectory for a single lateral wave (left), 37 long-range lateral waves (middle) and mean lateral wave (right) for the fiddler crab Uca perplexa. The mean shape was calculated for each of the three stages independently. B) Stick diagrams of the ascending portion of push-up displays for four lizards of the genus Sceloporus
(redrawn from Purdue & Carpenter, 1972).
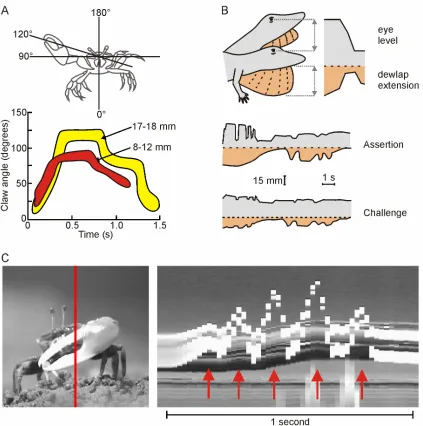
Measurements of movement trajectories during displays can also be
analysed over time. Hyatt (1977) compared the waving displays of juvenile and
adult fiddler crabs using a similar method to that used by von Hagen (1983). By
plotting the change in claw-tip to body angle over time he was able to show that
juveniles have a temporally and spatially different movement signal to
conspecific adults (Fig. 2.5A). Salmon et al. (1978), used the same method to
study the effect of sympatry on claw-waving display structure in fiddler crabs.
Such display action pattern techniques (DAP; Carpenter & Grubitz, 1961) have
been used extensively to define lizard displays (e.g. Carpenter et al., 1970;
Jenssen, 1977; Martins & Lamont, 1998; Ord & Martins, 2006). One such study,
on the head-bobbing and dewlap extension displays of the colourful Caribbean
anole lizard (Anolis auratus), was performed by Fleishman (1988). By plotting
[image:39.612.111.542.90.316.2]24
Fleishman showed that ‘assertion’ and ‘challenge’ movement displays differ in
[image:40.612.73.496.155.581.2]pattern and intensity (Fig. 2.5B).
Figure 2.5. Time series of movements during visual displays in three different species. A) Claw-tip to body angle during the claw-waving display of the male fiddler crab Uca pugilator. Red band represents results for small crabs (8-12mm) and yellow band represents large crabs (17-18mm) (redrawn from Salmon & Hyatt, 1983). B) The visual display of the lizard Anolis auratus. Both head-bobbing (grey) and dewlap extension (orange) differ between assertion and challenge displays (redrawn from Fleishman, 1988). C) The claw-waving display of U. seismella
Another method for displaying movement is to plot the one-dimensional
brightness distribution of a pixel-wide slice through a video sequence over time.
This technique is commonly used to illustrate movement in test patterns for
studying motion vision (e.g. Borst & Egelhaaf, 1993) and has also been used
previously to illustrate background movement in natural scenes (Zeil & Hemmi,
2006). In the example in figure 2.5C, a slice is taken through a video sequence
of a waving fiddler crab (Uca seismella; vertical red line in Fig. 2.5C, left) and the
pixels from this slice are plotted over time. This results in a graphical
representation of movement within the display, in which the claw is raised and
lowered in a repeated series of 5 waves (red arrows in Fig. 2.5C, right).
Essentially, this represents the temporal sequence of changes in light intensity
that a strip of photo-receptors might experience in the visual field of the
observer. However, this method fails to resolve movement in directions other
than vertical and is vulnerable to the aperture effect (diagonally moving objects
appear to move vertically).
2.4. Whole-image analysis: a receiver’s perspective
The techniques discussed so far in this chapter have focussed on describing
and measuring the movements of specific body parts or recording the sequence
of postures during movement-based displays. However, a more holistic
approach is to analyse complete displays from the perspective of the signal
receiver. Three-dimensional body movements of a signalling animal can
therefore be envisaged as two-dimensional retinal image projections in the
receiver’s visual system. By subsequently processing these 2D images using
biologically-inspired motion-detection mechanisms it is possible to quantify the
image motion signals that these displays produce at the receiver’s end. Two
main models for detecting whole-image motion have been applied to the study
26
2.4.1. Gradient detectors
The gradient, or differential method for extracting image motion originated from
computational studies in the field of machine vision (Hildreth & Koch, 1987;
Borst & Egelhaaf, 1989), and so have not been directly inspired by biological
mechanisms. It operates by tracking changes in image intensity over time (for
details see Peters et al., 2002; Elias et al., 2006a). Individual frames from a
video sequence are first converted into a matrix array of pixel intensities of size
MxN. Each frame is added sequentially to this array, producing a
three-dimensional matrix of size MxNxT, with T being the temporal dimension. A
computational motion analysis algorithm is then used to filter image intensity
over these three dimensions, resulting in spatial and temporal derivatives of
image intensity. This output can be interpreted as a frame-by-frame velocity field
that encodes image motion between frames as a vector array. The output vector
arrays provide veridical image velocity information, in other words, information
that is unaffected by spatial and contrast features within the image (Borst &
Egelhaaf, 1993). It thus provides a good quantitative tool for studying image
motion in movement-based animal signals, but does not necessarily relate to
what animals see.
Gradient detectors have been used effectively to study the dynamic
signals of jacky dragons (Amphibolurus muricatus) in noisy environments
(Peters et al., 2002; Peters & Evans, 2003a, b, 2007; Peters et al., 2007). The
example presented in figure 2.6A shows the resulting motion vectors
(colour-coded according to direction) produced by the model during two components of
the lizard’s dynamic visual display, the tail flick (left) and the push-up display
(right). Studies have also used this method to compare subtle differences in the
courtship displays between populations of the jumping spider (Habronattus
pugillis) (Elias et al., 2006a, b). The example in figure 2.6B shows that the speed
profiles of the courtship fore-leg displays differ between four discrete populations
28
2.4.2. Correlation detectors
A second type of detector that can be used for measuring motion from
movement-based visual displays, the correlation detector, is based on
biologically inspired neural models. The neural basis of motion detection in
animals has been the subject of much research (reviewed by Borst & Egelhaaf,
1989, 1993), and has lead to the development of several simple neural models
through which motion detection can take place. One of these models is known
as the Reichardt detector (Fig. 2.7, reviewed by Reichardt, 1987).
The Riechardt detector
The Reichardt detector correlates temporally delayed and undelayed
visual receptor outputs. Using the example of the schematic diagram in figure
2.7A, an object moving from left to right is detected first by the leftmost receptor
and shortly afterwards by the other. The stimulus from the first receptor is
temporally delayed (ε), causing the two receptor signals to reach a point of
multiplication (M) simultaneously. The same stimulus travelling in the opposite
direction fails to produce an output signal (Fig. 2.7B). This results in a speed and
direction dependent motion-sensitive response. However, one of the drawbacks
of this model is that, as well as being sensitive to image velocity, it is also
sensitive to the spatial and contrast properties of the moving image. In other
words, changing the shape of the input stimulus (red line, top of Fig. 2.7A) has
the effect of changing the shape of the multiplied signals and the output signal
(blue line, bottom of Fig. 2.7A). This results in a non-veridical estimate of image
velocity, dependent on spatial features and contrast within the image (reviewed
Figure 2.7. The Reichardt detector. A) An image intensity peak (red) moving from left to right elicits a response, first from the leftmost receptor, then the other in a Reichardt detector subunit. The signal from the first receptor is temporally delayed (ε), causing the two signals to coincide at a point of multiplication (M). In this instance a strong output signal is produced (bottom blue trace). B) As before, but the signal travels in the opposite direction. In this case the output signal is weak. C) and D) Two subunits from A) are combined and the outputs subtracted resulting in a simple, bi-directionally sensitive unit (redrawn from Borst & Egelhaaf, 1989).
The properties of Reichardt detector units can be arranged in “elementary
motion detector” (EMD) arrays (Borst & Egelhaaf, 1993). Simulations of such
arrays can be used to detect motion in digital video sequences. One such
model, initially developed for the study of human motion perception, is the
“2-Dimensional Motion Detection” model (2DMD) (Fig. 2.8, Zeil & Zanker, 1997;
Zanker & Zeil, 2005). The model simulates the initial local steps of elementary
motion detection in animal visual systems by spatiotemporally correlating
changes in pixel luminance. In this model, an array of horizontally and vertically
[image:45.612.132.524.71.394.2]30
a vector-based output matrix. High output values indicate a strong correlation of
pixel luminance in a particular direction, whilst low values indicate a weak
correlation. These values can be presented in colour-coded diagrams, in which
hue indicates movement direction and saturation represents motion signal
strength (e.g. Fig. 2.8B).
Figure 2.8. The 2-Dimensional Motion Detection (2DMD) model. A) Horizontally and vertically oriented correlation-type Reichardt detectors are arranged in a 2-dimensional array for processing digital video sequences. Vector outputs are then colour-coded according to the legend. Colour hue represents direction, whilst saturation represents motion signal strength. B) An example of a fiddler crab (U. elegans) claw-wave upstroke processed by the 2DMD model (schematic diagrams and colour code from Zanker & Zeil, 2005).
The EMD array has been used to study a range of visual perception
problems, including the perception of optical illusions in humans (Zanker, 2004,
2005; Zanker & Walker, 2004), environmental motion in natural scenes (Zanker
& Zeil, 2002), the visual ecology of fiddler crabs (Zeil & Zanker, 1997) and the
The Kinetograph
The ability to characterise the spectral range of energy components within
animal signals is an important tool for researchers interested in communication.
The frequency range of auditory signals can be plotted against time to produce a
graphical representation of the sound (reviewed by Hopp et al., 1998). Similarly,
the spectral composition frequency of light reflecting from colour patches can be
measured and graphically represented in spectral frequency plots (reviewed by
Kelber et al., 2003). Models for extracting motion from video sequences of
movement-based displays, such as the gradient and elementary motion
detection models described above, now provide us with the opportunity to
develop similar techniques for analysing and comparing movement displays.
Elias et al., (2006a) produced analogous analysis techniques to acoustic
spectrograms, waveforms and waterfall analyses for quantifying the motion
energy in dynamic visual signals. However, their techniques did not encode the
directional components of the motion signals. In collaboration with Richard A.
Peters, I have developed a technique for analysing the spatiotemporal structure
of movement-based signals, named the ‘kinetograph’ (Fig. 2.9).
Kinetographs can be produced from the vector outputs of any
whole-image motion analysis. A video sequence of the movement display of interest
(Fig. 2.9A) is first passed through a motion detection model, such as an
elementary motion detector or a gradient detector (Fig. 2.9B) with the desired
sampling base and time constant settings. The output motion vectors (Fig. 2.9C)
are then divided into angular bins and the mean length of the vectors within
each bin is calculated. Each magnitude value for each angular bin is then
transformed into a pixel shading value ranging from maximum (black) to
minimum (white). These are then plotted frame-by-frame with time along the x
axis and angular bin along the y axis (Fig. 2.9D). Figure 2.9E presents an
example of a kinetograph for the waving signal of the fiddler crab U. elegans. To
aid interpretation, the vertical elevation of the claw-tip over time is plotted below.
In this example, the motion signal in the kinetograph is generated primarily by
32
consisting of five claw ‘jerks’ (green arrows Fig. 2.9E), followed by a fast
downward sweep. Note that, in the kinetograph, the motion detected during the
upward claw-movement shifts gradually in direction from upwards-left, to
upwards-right (Fig. 2.9E, first two thirds of the kinetograph). This is caused by
the slightly curved trajectory of the claw during this part of the display (for more
details on the claw-waving display of U. elegans see chapters 3 and 6).
Chapter 3. Comparative form of
fiddler crab claw-waving
3.1. Introduction
A great diversity in claw-waving signal choreography exists across the 97
recognised species of fiddler crab in the world (Crane, 1975; Rosenberg, 2001).
Display structure is species-specific and involves, not just claw-waves, but also
body and leg movements (Crane, 1975). Previous researchers have broadly
categorised the fiddler crab claw-waving signal into two main types, “vertical
waves” and “lateral waves” (Crane, 1957). Vertical waves involve relatively
simple vertical lifts of the claw, with little horizontal (lateral) movement (Fig.
3.1A). Lateral waves involve relatively complex vertical and horizontal
extensions of the claw, often coupled with leg and body movements (Fig. 3.1B).
These two display categories divide neatly into the two main morphological
divisions within the Uca genus, “narrow-fronts” and “broad-fronts” (Bott,
1954). Narrow-fronted species have a small inter-orbital space (Fig. 3.1C), tend
to live in more open mudflats and employ vertical claw-waving displays.
Broad-fronted fiddler crabs have a large inter-orbital space (Fig. 3.1D), tend to live in
less open mudflats and employ lateral claw-waving displays (Crane, 1975;
deRivera & Vehrencamp, 2001).
The degree of eye separation also correlates with aspects of the fiddler
crab visual system. Crabs with small inter-orbital distances tend to have stronger
equatorial acute zones than those with a larger eye-separation (Zeil et al.,
1986). This reflects adaptations to different habitat types: narrow-fronted species
tend to occupy more open habitats, whilst broad-fronted species tend to occupy
more cluttered habitats (reviewed by Zeil & Hemmi, 2006). However, exceptions
to this rule do exist. Some narrow-fronted species are known to inhabit cluttered
environments (e.g. U. signata in Darwin; How, personal observation). It would be
interesting to test whether, in such cases, narrow-fronted species have
re-evolved a greater eye-separation by holding their eye-stalks at a slight
38
not only the mechanical adjustment of the eye-stalk position, but also a small
rotation of the compound eye to maintain the equatorial acute zone level with
the visual horizon. As far as I am aware, no study has investigated this point.
Figure 3.1. Illustration of the two main behavioural and morphological subdivisions of fiddler crabs. (A-B) Vertical and lateral wave display types. (C-D) Narrow and broad-front morphologies (redrawn from Crane, 1975; Rosenberg, 2001).
Courtship behaviour in the fiddler crabs also roughly divides into two main
types: “burrow-mating” and “surface-mating”. Burrow-mating males wave their
large claw to attract females to their burrows. In this case, receptive females
leave their own burrows and wander across the mudflat in search of a mate.
After visiting, in some cases, up to 100 waving males (deRivera, 2005) the
female selects a mate based on both male and burrow quality, enters his burrow
Backwell & Passmore, 1996). In contrast, males of surface-mating species leave
their burrows to approach neighbouring females, and both courtship and mating
occur at the entrance of the female’s burrow (Crane, 1975; Salmon, 1984;
deRivera & Vehrencamp, 2001). Although in the past these mating systems
were considered to be species-specific and rigid (Christy & Salmon, 1984;
Sturmbauer et al., 1996), it has recently become clear that at least some species
of fiddler crabs can employ either mode with varying frequency. The frequency
of the two modes depends on a number of factors, including population density
and the level of predation (Koga et al., 1998; deRivera et al., 2003). The
dominant form of courtship behaviour in a species tends to correlate with the
type of claw-waving display performed (Crane, 1957, 1975; deRivera &
Vehrencamp, 2001). In species that predominantly burrow-mate, males tend to
use high amplitude, relatively complex lateral waves (e.g. Hyatt, 1977). In those
that tend to surface-mate, males use low amplitude, relatively simple vertical
waves (Crane, 1957, 1975; Schöne, 1968; deRivera & Vehrencamp, 2001).
The comparative morphology of the Australian fiddler crabs is well known
(George & Jones, 1982). Seventeen species have been identified, which include
4 broad-fronted and 13 narrow-fronted species. The relative abundance of broad
vs. narrow fronted species differs from other parts of the world, where the
majority of species tend to be broad-fronted (Crane, 1967; Sturmbauer et al.,
1996). The 17 Australian species of fiddler crab are subdivided into four major
subgenera: Celuca, Deltuca, Australuca and Thalassuca (Fig. 3.2; Crane, 1975;
40
Figure 3.2. Phylogeny of Australian fiddler crab species. Species in bold are included in the current analysis (redrawn from Rosenberg 2001).
In contrast to their morphology, a comparative study of the behavioural
ecology of Australian species of fiddler crab has yet to be performed. In this
chapter, I undertake a detailed comparative analysis of the claw-waving displays
of seven common species of Australian fiddler crab, U. mjoebergi, U. perplexa,
U. polita, U, seismella, U. signata, U. elegans and U. vomeris. Both qualitative
and quantitative comparisons are made within and between species using
traces of claw-tip movement over time and whole-image motion-analysis
conspecifics, but were more similar within than between species. Display
structure also showed a degree of phylogenetic relationship.
3.2. Methods
“In order to obtain adequate statistical material [for a comparative
study of fiddler crab claw-waving displays], unrealistic amounts of
film would need to be exposed… It is difficult to see how the most
generous and intelligent use of computer time could curtail the
necessary preliminaries sufficiently to make feasible a study of
adequate scale to give reliable data for comparative ethology.”
Jocelyn Crane, 1975. Fiddler Crabs of the World, p498
Over the 32 years since Jocelyn Crane wrote this passage there have
been astonishing advances in video and computer technology that have
facilitated the comparative study of fiddler crab claw-waving displays. However,
frame-by-frame analysis of claw-movements is still time-consuming and is the
primary limiting factor to the amount of data that can be processed. Studies of
this kind among Australian species of fiddler crab are few and far between (but
see von Hagen, 1993; Murai & Backwell, 2006) and so the visual ecology of
their communication signals is poorly understood.
3.2.1. Data collection and analysis
Data were collected between 2004 and 2006 from two main study sites: Bowling
Green Bay, Queensland (19°23’49”S 147°06’43”E), and Darwin, Northern
Territory (12°24’23”S 130°49’51”E) (Fig. 1.5).
Waving displays were filmed from the viewpoint of a crab using a digital
video camcorder (Sony DCR-TRV250E Digital8 or DCR-HC21E MiniDV
Handycam) pointing down onto a mirror angled at 45˚ resting on the mudflat
42
frames per second (20 ms frame interval) using modified open source software
(dvgrab) under Linux. The x-y-positions of the major claw-tip and of the crab
body were determined for each frame using custom-made software (Hemmi,
The Australian National University). For each individual crab, the mean shape of
the claw-tip path was calculated using the eigenshape method according to
MacLeod (1999), and the mean claw-tip height and vertical speed over time was
determined. To increase spatiotemporal accuracy, mean shapes were
calculated for standardised sequential sections of each display (for detailed
methods see chapter 2). Overall mean shapes, height and vertical speed were
calculated for the pooled data for all individuals within the species. Kinetographs
and motion maps of a single example display for each species were produced
using a two-dimensional correlation-type motion detection model (2DMD;
Zanker, 1996) according to the methods described in chapter 2. In the case of
kinetographs, the elementary motion detector (EMD) settings were adjusted so
that they operated on a time constant of 1 frame (20 ms) and over a sampling
base of 4 or 6 pixels. The vector output matrices were filtered by locally
averaging each pixel with its 9x9 nearest neighbours. Motion maps were
produced and filtered in the same way, but included a temporal averaging step,
in which the outputs of 4 to 8 frames were combined before spatial filtering took
place.
All time measurements are provided in hour:minute format for values
larger than 2 minutes or in seconds for values smaller than 2 minutes. Unless
otherwise stated, means in the text are accompanied by the standard error and
the sample size (N or n).
3.2.2. Cluster analysis
Intra- and inter-species variability in claw-waving displays were analysed using
open-source, Matlab®-based cluster analysis software (Balasko et al., 2005).
Unless otherwise stated, three variables were included in the analysis: wave
duration, maximum vertical speed, and vertical tortuosity. Maximum vertical
Vertical tortuosity was a measure of straightness of claw-tip elevation plots (i.e.
Figs. 3.3-9E), which was calculated by normalising plot height to plot length,
then dividing the total length of the plot trace with the direct length from start to
finish.
The K-mean hard partitioning method (MacQueen, 1967) was used to
divide the data into a predetermined number of clusters on the basis of the three
variables above. The method operates by allocating each data point to a
randomly positioned cluster centre depending on its proximity to the current
cluster centre positions. The positions of these cluster centres are then adjusted
and the within-cluster sum of squares is minimised. This is repeated over a
number of iterations, with the point allocation to each cluster being re-evaluated
at each step, until an optimal clustering of the data is reached. Cluster number
was chosen according to the number of groups present in the analysis. For
example, in the analysis of inter-specific variation the number of clusters chosen
was equal to the number of species in the analysis. The results are presented as
cross-referencing plots, in which the test group is represented on the x-axis and
cluster group along the y-axis. The percentage of data points from each test
group that fall within each cluster is graphically represented by the area of a
44
3.3. Results
3.3.1. Subgenus: Celuca (Crane, 1975)
[Latin: “fast-moving” fiddler crabs]
The subgenus Celuca contains a large number of species from both the
Americas and the Indo-West Pacific regions. Celucans are characteristically
small to medium sized, broad-fronted fiddler crabs that use lateral claw-waving
displays (Crane, 1975). Until recently, the two Celucan species in this analysis,
U. mjoebergi and U. perplexa, were classed as subspecies of U. lactea (Crane,
1975), although today they are treated as species in their own right (Rosenberg,
2001). Although relatively little is known about the Australian species, other
Celucan species from the Americas and Indo-Pacific region have been the
subject of much research, including U. beebei (Christy, 1987, 1988a, b; Christy
& Schober, 1994; Backwell et al., 1995; deRivera et al., 2003), U. annulipes
(Walker, 1972; Backwell & Passmore, 1996; Jennions & Backwell, 1996, 1998;
Zeil & Al-Mutairi, 1996; Zeil, 1998; Backwell et al., 1999) and U. lactea
(Yamaguchi, 1970, 2000; Murai et al., 1987; Goshima & Murai, 1988;