An Interconverting Family of Coordination Cages and a
meso
-Helicate; E
ff
ects of Temperature, Concentration, and Solvent on the
Product Distribution of a Self-Assembly Process
William Cullen,
†Christopher A. Hunter,
†,‡and Michael D. Ward
*
,† †Department of Chemistry, University of Sheffield, Sheffield S3 7HF, U.K.‡Department of Chemistry, University of Cambridge, Lensfield Road, Cambridge CB2 1EW, U.K.
*
S Supporting InformationABSTRACT: The self-assembly between a water-soluble bis-bidentate ligand L18wand Co(II) salts in water affords three high-spin Co(II) products: a dinuclear meso-helicate [Co2(L18w)3]X4; a tetrahedral cage [Co4(L18w)6]X8; and a
dodecanuclear truncated-tetrahedral cage [Co12(L18w) 18]X24
(X = BF4 or ClO4). All three products were crystallized
under different conditions and structurally characterized. In [Co2(L18w)3]X4all three bridging ligands span a pair of metal
ions; in the two larger products, there is a metal ion at each vertex of the Co4or Co12polyhedral cage array with a bridging
ligand spanning a pair of metal ions along every edge. All three structural types are known: what is unusual here is the presence of all three from the same reaction. The assembliesCo2,Co4, andCo12are in slow equilibrium (hours/days) in aqueous solution, and this can be conveniently monitored by1H NMR spectroscopy because (i) the paramagnetism of Co(II) disperses the signals
over a range of ca. 200 ppm and (ii) the different symmetries of the three species give characteristically different numbers of independent 1H NMR signals, which makes identification easy. From temperature- and concentration-dependent 1H NMR
studies it is clear that increasing temperature and increasing dilution favors fragmentation to give a larger proportion of the smaller assemblies for entropic reasons. High concentrations and low temperature favor the larger assembly despite the unfavorable entropic and electrostatic factors associated with its formation. We suggest that this arises from the hydrophobic effect: reorganization of several smaller complexes into one larger one results in a smaller proportion of the hydrophobic ligand surface being exposed to water, with a larger proportion of the ligand surface protected in the interior of the assembly. In agreement with this,1H NMR spectra in a nonaqueous solvent (MeNO
2) show formation of only [Co2(L18w)3]X4because the
driving force for reorganization into larger assemblies is now absent. Thus, we can identify the contributions of temperature, concentration, and solvent on the result of the metal/ligand self-assembly process and have determined the speciation behavior of theCo2/Co4/Co12system in aqueous solution.
■
INTRODUCTIONThe assembly of architecturally complex polyhedral coordina-tion cages, from a combinacoordina-tion of labile metal ions and relatively simple bridging ligands, has fascinated coordination chemists for more than 25 years.1 From Saalfrank’s early examples of M4L6tetrahedral cages2to Fujita’s recent Pd24L48 nanospheres,3 the synthesis, structural characterization, and guest-binding properties of these hollow metal−organic capsules have provided deep insights into control of self-assembly as well as some useful examples of functional behavior arising from the host−guest chemistry.1,4
If a particular metal−ligand combination forms an assembly that is significantly more thermodynamically stable than the other possibilities, then a single product is formed and isolated, and will generally have the same structure in the solid state as it does in solutionbehaving, in effect, like a conventional kinetically stable compound. This is very often the case, particularly when metal ions with strong stereoelectronic
preferences (Pd2+, Pt2+) are combined with rigid bridging
ligands that have a fixed, predictable arrangement of metal binding sites, as illustrated by work from the groups of Fujta,1b,3 Stang,5 and Shionoya.6 In these cases, appropriate design of mutually complementary metal−ligand components can ensure that a single product is formed. In other cases, however, when
flexible bridging ligands and/or metal ions with weaker stereochemical preference are used, numerous possible metal−ligand assemblies may be similar in energy with the result that different cages can form under different conditions, and two or more cages may exist in dynamic equilibrium in solution.7
This is the characteristic behavior of dynamic combinatorial libraries (DCLs).8In a DCL, there is generally a large number of possible products in equilibriumthe more the better. By a
Received: November 19, 2014
Published: February 20, 2015
Article
pubs.acs.org/IC
change in conditions, in particular addition of a template, it is possible to bias the equilibrium, amplifying one component of the library by binding to it and making it more stable. In the
field of metallosupramolecular chemistry, prominent examples include mixtures of cyclic helicates of different sizes in which one component is amplified by a templating guest anion that binds strongly into the central cavity of whichever cyclic helicate in the mixture provides a cavity with the best size match.9
Dynamic mixtures of molecular polygons have come from the work of Fujita7fand Cotton.7cMore elaborate examples of dynamic equilibria in metal complex assemblies include interconversion between a M2L3 dinuclear triple helicate and a M4L6tetrahedron from Raymond’s group7jand
interconver-sion between large Ag(I)-based molecular grid and quadruple helicate structures from Lehn’s group.10Recently Nitschke has developed large families of interconverting cages based on the same metal/ligand components whose equilibrium constitution can be controlled by changes in, for example, anion type and pH,7i and many other researchers have provided related examples of DCLs of metallosupramolecular assemblies.7 Understanding and manipulating a complex equilibrium between many types of metal/ligand assemblies provides the next level of control in metallosupramolecular chemistry beyond the ligand design and choice of metal ion to give a specific assembly, which was the paradigm a few years ago.
Among our own family of coordination cages1e,7aan extensive series based on combination of labile transition metal ions with bridging ligands containing pyrazolyl−pyridine chelating terminiwe observed recently conversion between an M16L24 assembly, which formed in the solid state and was crystallographically characterized, and a smaller M6L9assembly,
which slowly formed in dilute solution when crystals of the M16L24 cage dissolved,7awith the interconversion triggered by
the concentration change. In this contribution, we report a more elaborate equilibrium involving an interconversion between three different assembliesan M2L3 cylindrical “mesocate” and M4L6 and M12L18 cages, all of which were
structurally characterized. The position of the equilibrium is dependent on three variables (concentration, temperature, and solvent). We show how control of these parameters allows the equilibrium to be biased in favor of one component or another, using electrospray (ES) mass spectrometry (MS) and1H NMR
spectroscopy to characterize the product distribution in solution.
■
RESULTS AND DISCUSSION(i). Synthesis of Ligand and Complexes.We reported a while ago the assembly and structural characterization of the cage family [M12(L18naph)
18]X24(M = Co, Cu, Cd, all in the 2+
state; X−= BF4−or ClO4−).11In these cages, as in all members of
this family,1e a bridging ligand with two bidentate termini is combined with a six-coordinate metal ion, resulting in an assembly with a 2M/3L ratio that results in a polyhedral cage that has a 2:3 ratio of vertices to edges, with a metal ion occupying every vertex and a bridging ligand spanning a pair of metal ions along every edge. This has afforded (among others) M4L6tetrahedra, M6L9trigonal prisms, and M8L12cubes;1ethe [M12(L18naph)18]24+ cage cations have the form of truncated
tetrahedra.11 We have also found recently that making our cages water-soluble by addition of hydroxymethyl substituents to the external surface results in strong binding of hydrophobic guests in water, because the interior surface of the cage cavities
is lined with CH groups from the ligand backbones and is therefore hydrophobic.12Seeking to extend this principle to the [M12(L18naph)
18]24+ cages, we prepared the
hydroxymethyl-substituted ligand L18w and prepared its Co(II) complex, expecting to obtain the water-soluble potential hosts [Co12(L18w)18]X24 with a view to examining its host−guest
properties.
The ligand synthesis is shown in Scheme 1 and follows a recently reported method.12a The key intermediate is
compound A, the chelating pyrazolyl−pyridine unit with a pendant t-butyl-dimethyl-silyl (TBDMS)-protected hydroxy-methyl group at the pyridyl C4 position. Reaction of this
compound with 1,8-bis(bromomethyl)naphthalene, in the presence of NaH to remove the acidic pyrazole protons, afforded the TBDMS-protected ligand B; treatment with Bu4NF liberated the hydroxy groups to afford L18w. The crystal
structure of L18w·HBF4is provided in Supporting Information.
We combined L18wwith Co(BF
4)2or Co(ClO4)2in MeOH
(3:2 molar ratio) and heated the mixture to 100°C for 12 h in an autoclave, followed by slow cooling. This did not yield any crystals but gave an orange solution, which was evaporated to dryness. It was immediately obvious from1H NMR and ES MS
measurements on the dried material that a complicated mixture of products had formed rather than a single species. The 1H
NMR spectrum showed a very large number of signals of varying intensity dispersed over the range from−120 to +100 ppm due to the paramagnetism of the high-spin Co(II) ions.12,13The mass spectrum was more informative and showed characteristic sequences of peaks corresponding to {Co2(L18w)
3X4−n}n+, {Co4(L18w)6X8−n}n+, and {Co12(L18w)18
-X24−n}n+, plus other peaks that could not be assigned. Accordingly we looked at ways to isolate the individual components.
(ii). Structural Characterization of the Dinuclear Mesocate [Co2(L18w)3](BF4)4. Diffusion of diethyl ether vapor into a solution of the crude product (from the solvothermal synthesis) in MeNO2 afforded crystals of what
proved to be the dinuclear complex [Co2(L18w)
3](BF4)4
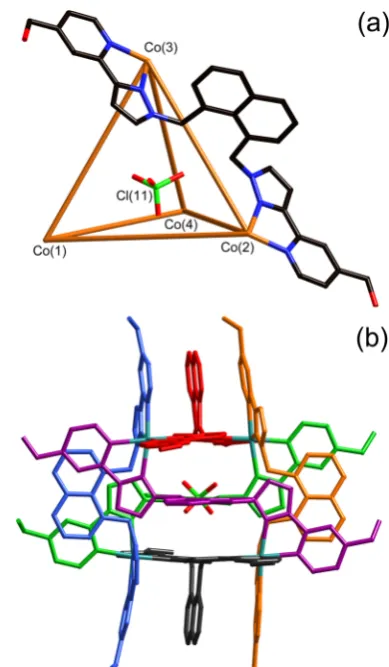
(Figure 1; abbreviated hereafter as Co2) in which all three ligands span both metal centers. Superficially it looks like a triple helicate, but in fact the two metal centers within each molecule have opposed chirality so this is an example of a “meso-helicate” or mesocate, lacking helical chirality.14 The conformation of the three ligands is clearly not the continuous spiral strand as seen in helicates; instead, there is a sharp bend in each ligand allowing one pyrazolyl−pyridine terminus to be angled in the opposite sense to the other. This allows the naphthyl group of each ligand to form a π−π stacking interaction (separation 3.3−3.4 Å) with the coordinated Scheme 1. Structural Formulae of the Ligands L18naphand L18wand the Synthetic Intermediates A and B
pyrazolyl−pyridine group from another liganda typical interaction between parallel and overlapping electron rich and electron deficient aromatic fragments, of the sort that is commonplace in this family of complexes.1e,11,12All three such interactions are at the same end of the complex, with the three pyrazolyl−pyridine units around Co(1) all forming stacking interactions with adjacent naphthyl groups; this cannot happen around the other terminus [Co(2)] without a substantial change in the ligand conformations. Thus, the stacking interactions appear to “lock” the ligands in an asymmetric conformation with two inequivalent termini. Bond distances around the Co(II) ions are unremarkable and characteristic of high-spin Co(II), lying in the range of 2.12−2.17 Å. The Co(1)···Co(2) separation is 7.85 Å. A space-filling view is shown in Supporting Information. Crystallographic data are summarized in Table 1.
The result is that the complex cation has 3-fold rotational symmetry with the axis passing through both fac tris-chelate metal centers. However, the absence of 2-fold symmetry within each ligand means that the molecular symmetry is just C3,
rather thanD3as is normally seen in triple helicates when the
ligands each have 2-fold symmetry with equivalent termini. This is comparable to the situation that occurs in triple helicates of nonsymmetrical ditopic ligands that have different “head”and“tail”ends, with the three ligands aligned in a“ head-to-head-to-head”manner.15
The 3-fold molecular symmetry means that, if this structure is preserved in solution, we expect to see one ligand environment but with no internal symmetry, that is, 24 independent signals in the1H NMR spectrum (not including
[image:3.625.164.461.64.259.2]the exchangeable OH protons). This assumes that the protons of the two methylene groups are diastereotopic in the local chiral environment around each tris-chelate metal center and Figure 1.Two views of the complex cation of [Co2(L18w)3](BF4)4. (left) A view of the complete cation showing all three (equivalent) ligands
colored separately. (right) A view showing the conformation of one ligand and the stacking at one end of the complex [around Co(1)] between the naphthyl groups of one ligands and the coordinated pyrazolyl−pyridine group of another.
Table 1. Crystal Parameters, Data Collection, and Refinement Details for the Structures in This Paper
complex [Co2(L18w)3](BF4)4 [Co4(L18w)6](ClO4)8·18H2O [Co12(L18w)18](BF4)24·1.5H2O L18w·HBF4·2CHCl3 formulaa C90H78N18B4Co2F16O6 C180H192N36Cl8Co4O62 C540H471N108B24Co12F96O37.5 C32H29BCl6F4N6O2
molecular weight 1972.8 4371.0 11 863.8 829.12
T, K 100(2) 100(2) 100(2) 100(2)
crystal system trigonal triclinic trigonal triclinic
space group R3̅c P1̅ R3̅ P1̅
a, Å 18.885(3) 19.2188(13) 44.705(9) 9.5725(3)
b, Å 18.885(3) 29.070(2) 44.705(9) 11.1173(3)
c, Å 101.44(2) 35.460(3) 68.621(14) 17.7204(5)
α, deg 90 90.322(3) 90 83.021(2)
β, deg 90 98.971(3) 90 77.285(2)
γ, deg 120 98.598(3) 120 84.835(2)
V, Å3 31 333(11) 19 340(2) 118 768(54) 1813.47(9)
Z 12 4 6 2
ρ, g cm−3 1.255 1.501 0.995 1.518
crystal size, mm3 0.22×0.08×0.03 0.18×0.11×0.05 0.1×0.1×0.1 0.35×0.33×0.08 data, restraints, parameters 4534, 463, 335 88 225, 5308, 4968 23 528, 2282, 1767 6141, 0, 462
finalR1,wR2b 0.188, 0.519 0.128, 0.406 0.199, 0.522 0.044, 0.112
aThese formulas (and consequently the crystal densities) are necessarily approximate given that large amounts of diffuse electron density in
solvent-accessible voids was removed from the refinements using either the“SQUEEZE”function in PLATON or the OLEX“Solvent Mask”function. See CIFs, and comments in Experimental Section, for details.bThe value ofR1 is based on“observed”data withI> 2σ(I); the value ofwR2 is based on all data.
[image:3.625.74.562.318.523.2]will therefore give separate signals. The1H NMR spectrum of a
solution prepared from freshly dissolved crystals ofCo2in D2O
was consistent with this (Figure 2), with 24 signals apparent in
the range from−120 to +90 ppm. The signals have not been individually assigned butas we have seen in other1H NMR
spectra of high-spin Co(II) cages13b,cthe broad, less intense peaks are from the protons with a shortt1value due to their proximity to the paramagnetic centers, and the sharper, more intense signals arise from the protons further from the metal centers. As usual, individual1H−1H couplings are not resolved. The key point is that the number of signals in this spectrum is exactly what we would expect from theC3-symmetric solution
structure. By analogy with previously reported spectra, for example, we can say that the two weak, broad signals between 80 and 90 ppm (signals 1 and 3) are from the pyridyl H6
protons of the two similar but inequivalent termini of L18w,13b,c and the four signals at negative chemical shift (pairs of signals 21/22 and 23/24) are from the two inequivalent methylene groups, each of which is diastereotopic. The presence of signals in pairscorresponding to the two halves of the ligand being in two slightly different chemical environmentsis particularly clear for the four pairs of signals numbered 13−20 in Figure 2. The ES mass spectrum of freshly dissolved crystals shows the sequence of peaks corresponding to the species {Co2(L18w)
3(X)4−n}n+ (n = 1, 2, 3, 4) with correct isotopic spacings in each case and correct accurate mass measurements on selected signals (see Supporting Information).
(iii). Structural Characterization of the Tetrahedral Cage [Co4(L18w)6](ClO4)8. Slow cooling of a solution of the crude reaction mixture in D2O afforded crystals of what proved
to be the tetrahedral cage [Co4(L18w)
6](ClO4)8 (Figure 3,
hereafter abbreviatedCo4). This has afactris-chelate metal ion at each vertex of the tetrahedron, and a bridging ligand spanning a pair of metal ions along each of the six edges.11a,13b,16 The naphthyl group of each bridging ligand forms π-stacking interactions with the coordinated pyrazolyl− pyridine termini of two other ligands, forming a three-component A/D/A sandwich (A = electron-deficient pyr-azolyl−pyridine acceptor unit, D = electron-rich naphthyl donor unit) along every edge of the tetrahedron. As is usually the case in these tetrahedral cages, an anion occupies the central cavity.11a,13b,16This guest anion is inverted with respect
to the cage tetrahedron such that each O atom of the perchlorate guest is oriented toward the space in the center of one of the triangular faces of the Co4 tetrahedral array. The
anion is involved in CH···O hydrogen-bonding interactions with the interior surface of the cage, with numerous nonbonded H···O separations in the range of 2.6−2.7 Å, and the associated C···O separations being ca. 3.2−3.3 Å. The Co···Co separations along the edges of the cage cations are in the range of 9.34− 9.60 Å (average 9.53 Å), and the Co−N separations are again in the range of 2.11−2.19 Å. A space-filling view is in Supporting Information.
Although there are two crystallographically independent complex molecules, each with no internal symmetry, in the asymmetric unit, in solution the loss of symmetry from crystal packing is relaxed, and the 1H NMR spectrum in D2O is
consistent with the complex having T symmetry (Figure 4). This arises from the presence of fourC3axes (one through each
metal center) and threeC2axes (bisecting each opposed pair of ligands). This means that the two halves of each ligand are magnetically equivalent, and the 1H NMR spectrum
[image:4.625.343.538.64.398.2]accord-ingly contains only 12 signals (excluding exchangeable OH protons) between −80 and +90 ppm. By inspection the spectrum is clearly only half as complex as that ofCo2in Figure Figure 2.400 MHz1H NMR spectrum (D
2O, 298 K) of redissolved
crystals of [Co2(L18w)3](BF4)4. All 24 expected signals are resolved
and numbered; “S” denotes the signal from residual protonated solvent.
Figure 3.Two views of the complex cation of [Co4(L18w)6](ClO4)8.
(a) A view emphasizing the tetrahedral topology, with a metal ion at each vertex, a bridging ligand spanning each edge, and the presence of an encapsulated perchlorate ion guest, which is inverted with respect to the Co4tetrahedron. (b) A view of the complete complex cation
[image:4.625.60.302.107.265.2]2, withfor exampleonly a single pyridyl H6signal (No. 3)
and a single signal for each of the diastereotopic methylene protons (signals 11 and 12). The integrity of the complex in solution was also confirmed by the ES mass spectrum, which showed a series of peaks corresponding to the species {Co4(L18w)6(ClO4)8−n}n+ (n = 2, 3, 4); see Supporting Information. The signal atm/z913 for {Co4(L18w)
6(ClO4)4}4+
c o u l d b e d i s t i n g u i s h e d f r o m t h e s i g n a l f o r {Co2(L18w)
3(ClO4)2}2+at the same m/z value (fromCo2) by its isotopic pattern and the spacing of 0.25 units, instead of 0.5 units, between adjacent components of the isotope sequence. The same applies to all other signals, making assignments unambiguous.
(iv). Structural Characterization of the Truncated Tetrahedral Cage [Co12(L18w)18](BF4)24.We were unable to isolate the larger componenttentatively identified as dodecanuclear [Co12(L18w)
18](BF4)24 from the mass spectrum
of the crude materialfrom the initially obtained mixture by fractional crystallization, so we sought to effect chromato-graphic purification. On the basis that any dodecanuclear complex would be much larger than the dinuclear and tetranuclear species identified so far, we used size-exclusion chromatography with Sephadex G-50, eluting with water. The column developed as a well-defined orange band that eluted
first and was shown to be pure [Co12(L18w)
18]X24 by mass
spectrometry; this band was followed by a more diffuse orange band containing the smaller complexes, which did not separate under these conditions.
Concentrating and cooling the aqueous solution of the initial fraction afforded crystals of what proved to be the initially expected truncated-tetrahedral complex [Co12(L18w)
[image:5.625.340.544.62.420.2]18](BF4)24
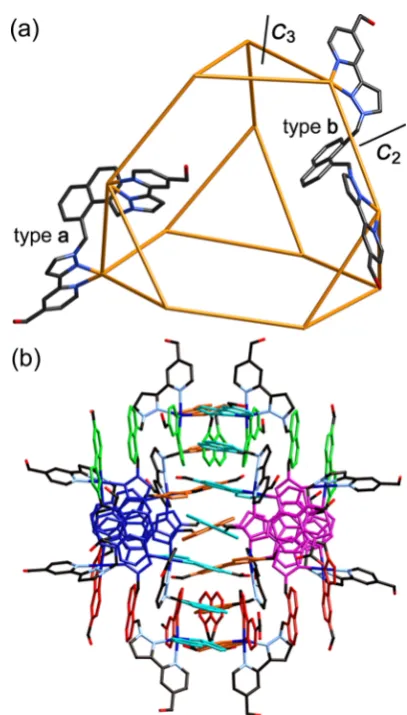
(Figure 5). This has the general structure that we have seen before in complexes of the parent ligand L18naph.11
The truncated tetrahedron is an Archimedean solid with all vertices equivalent, but two types of facestriangular and hexagonal and two types of edge. The two types of edge may be described as type a, which are the 12 edges associated with the four triangular faces, and typeb, which are the six edges connecting these trianglesthese are the edges of the parent tetrahedron before it was truncated. The ligands spanning these edges may
therefore be abbreviated as La, of which there are 12 (with no
internal symmetry), and Lb, of which there are six (lying on a 2-fold axis). Each M3(La)
3triangular face is a cyclic helicate, with
four of these linked in a tetrahedral array by additional bridging ligands. All metal centers in this structure are meridional tris-chelatesin contrast to thefirst two structuresand all metal centers are homochiral. The arrangement of ligands, and in particular the flexibility associated with the methylene groups that link the pyrazolyl-pyridine termini to the central aromatic core, permits extensive aromatic stacking (Figure 5b) with six seven-membered A-D-A-D-A-D-A stacks around the periphery of the complex, where (as before) A denotes an electron-deficient pyrazolyl−pyridine acceptor, and D denotes an electron-rich naphthyl donor. Co−N distances are in the range of 2.09−2.23 Å, and Co···Co separations are in the range of 9.35−9.53 Å (average 9.45 Å).
[image:5.625.67.298.64.249.2]The spaces in the center of each triangular and hexagonal face provide a pocket that accommodates a tetrafluoroborate anion that forms CH···F interactions with the surrounding ligand; thus, eight anions are associated with the surface of the Figure 4.400 MHz1H NMR spectrum (D
2O, 298 K) of redissolved
crystals of [Co4(L18w)6](ClO4)8. Of the 12 expected signals, 10 are
clear (1−8, 11, and 12) and the other two (9, 10) are overlapping close to the residual broad protonated solvent peak centered at∼5 ppm.
Figure 5.Two views of the complex cation of [Co12(L18w)18](BF4)24.
(a) A view emphasizing the truncated tetrahedral topology, with a metal ion at each vertex and a bridging ligand spanning each edge, and the presence of two different ligand environments according to whether the ligand spans an edge of a triangular (typea) or one of the edges linking two triangular faces (typeb). 3-Fold and 2-fold rotation axes are also illustrated. (b) A view of the complete complex cation with the six π-stacked arrayseach of which contains a seven-component alternating array of pyrazolyl−pyridine and naphthyl componentscolored separately.
cage. The central cavity probably also contains a combination of anions and/or solvent molecules, but these were severely disordered and could not be modeled successfully in the crystallographic refinement. Additional views of the structure are in Supporting Information.
In the absence of crystal packing effects, we expect again that in solution this complex cation will haveTsymmetry, which is a common consequence of removing symmetry planes from point groups of higher-symmetry polyhedra.17 There is a C3
axis through the center of each M3(La)3triangular face (and
also through the opposite hexagonal face), as well as threeC2
axes, each of which bisects an opposite pair of Lbligands along the typeb edges. The result of this is that there must be 1.5 magnetically independent ligand environments. In the 12 La ligands, all protons are inequivalent due to the helical chirality of the M3(La)3triangular array, which means that the ligands
have distinct “head”and“tail”ends. The six Lbligands are all
bisected byC2axes, generating 12 equivalent halves of the Lb
[image:6.625.64.296.317.490.2]-type ligands. The result is 36 magnetically inequivalent protons with the same abundance (excluding exchangeable OH protons), and the 1H NMR spectrum is consistent with this
(Figure 6). The spectrum at 298 K was noticeably broader and
less well-resolved than those of Co2 and Co4 at the same temperature, presumably due to the slow tumbling of the large molecule in solution, which broadens the spectrum above and beyond the effects of paramagnetism. Warming the solution sharpened the signals, and Figure 6 shows the 1H NMR
spectrum at 90 °C. We can now easily identify 33 of the expected 36 signals; the missing ones may be obscured under the HOD peak (there are many closely spaced signals in this region) or may still be too broad to detect. However, this spectrum is clearly in agreement with the symmetry of the solid-state structure, and in particular we can see how some signals occur in sets of three corresponding to the three independent ligand halves [e.g., broad signals 1, 8, and 11 in Figure 6 are the three pyridyl H6 environments, and signals 29−31 arise from one of the protons on each of the three independent methylene groups]. The ES mass spectrum (see Supporting Information) confirms the integrity of the cage in aqueous solution, showing a sequence of seven peaks from the
species {Co12(L18w)
18(BF4)24−n}n+(n= 6−12 inclusive) formed by successive loss of tetrafluoroborate anions.
(v). Interconversion between the Structures in Aqueous Solution: Effects of Temperature.Since multiple attempts at changing the experimental conditions for the synthesis results in a similar mixture of components in every case, the possibility suggests itself that the different species isolated as crystals could be in slow equilibriumas we have seen in one other case.7aThe fact that we could obtain clean1H
NMR spectra of each species independently from redissolved crystals means that any equilibrium must be on a time scale of hours or longer at room temperature, which made separation and individual identification of the components possible (e.g., we could isolate pure Co12 by size-exclusion column chromatography). 1H NMR spectroscopy provides a
conven-ient tool to study any equilibration between components, in particular because (i) the paramagnetism disperses the signals over such a wide chemical shift range, such that most individual signals are clearly resolved;13and (ii) the different symmetries result in different numbers of independent signals for each complex (12, 24, or 36), which allows each set of signals to be identified easily. The NMR studies were performed using the [BF4]−salts (except where we needed pure crystallineCo4, for which we used redissolved crystals of the [ClO4]− salt). In
aqueous solution the nature of the anion makes no difference to the complex structure as it is solvated; the perchlorate and tetrafluoroborate salts of a given complex cation gave the same
1H NMR spectra in water.
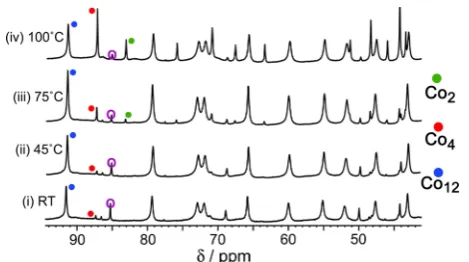
Initially we examined the effect of temperature. A solution of some of the initially isolated crude mixture of complex products (6 mg in 0.6 mL of D2O) was prepared, and the 1H NMR
spectrum was recorded at 25 °C; the mixture at this point contained mainly the Co12 and Co4 species (Figure 7).
Warming the solution to 45 °C resulted in some changes in relative intensity of different components, so the solution was held at this temperature until no further changes occurred (4 d). At this temperature, we saw that weak signals due to the M2
complex had appeared. At 70°C, the solution needed only 1 d before equilibrium was reached. This spectrum showed a large change in the composition of the mixture: the major species were now Co4 and Co2, with none of the Co12 complex present. Finally the temperature was raised to 100°C, and the sample was monitored by1H NMR spectroscopy until a new equilibrium had been reached (12 h). At this temperature, not only had theCo12species disappeared, but there was very little Figure 6.400 MHz1H NMR spectrum (D
2O, 90°C) of redissolved
crystals of [Co12(L18w)18](BF4)24. Of the 36 expected signals, 33 are
[image:6.625.327.562.442.563.2]clear. The others are assumed to be either obscured by the residual protonated solvent peak (S) or too broad to detect (see main text).
Figure 7. Partial 1H NMR spectra of the as-isolated mixture of
complexes ([BF4]−salts) after equilibration of the sample (6 mg in 0.6
cm3of D
2O, corresponding to total Co concentration of 10−2M) at (i)
of theCo4complex, with theCo2complex being the dominant species. Allowing the mixture to cool to 25 °C re-established the initial equilibrium composition after 3 d. These spectroscopic changes are summarized in Figure 7.
We prepared a solution that was not at equilibrium by dissolving crystals of Co2 in D2O to give the same total
concentration of Co(II) ions as before. The initial 1H NMR
spectrum at 25 °C was that of pure Co2 (cf. Figure 2). However, the spectrum slowly changed, with the signals characteristic of Co4 and Co12 growing in intensity until equilibrium was established after ∼36 h (Figure 8). At this
point the composition of the mixture was identical to that obtained above from the crude reaction mixture at 25 °C. Increasing the temperature to 100 °C and then recooling, allowing appropriate equilibration time at each stage, resulted in the same evolution of spectra as seen before (Figure 7). Similar experiments using redissolved crystals of pureCo4 or
Co12[again, with the same total concentration of Co(II) ions] gave the same results: the initially obtained spectrum of pure complex in each case evolved slowly to show the same equilibrium mixture ofCo2,Co4, andCo12appropriate to the temperature. Thus, we see identical behavior in solution whether we start from the as-isolated mixture of complex components or from redissolved crystals ofany one component, proving that the Co2/Co4/Co12 system exists in aqueous solution as a fully reversible equilibrium.
Fragmentation of Co12 into a larger number of smaller complexes is entropically favorable, so as the temperature increases the value ofTΔS°increases, and the equilibrium shifts towardCo4andCo2. In addition, this fragmentation disperses the positive charges over more particles, which is electrostati-cally favorable.
This raises the question of why the larger assemblies form at all: there must be an additional factor specifically favoring formation of Co12 in preference to six molecules of Co2 or three molecules ofCo4. Many of the specific interactions that contribute toΔH°for formation of an individual complex scale linearly with complex size so do not provide a driving force for
formation of larger assemblies. For example, the total number of metal−ligand bonds is independent of the size of the assembly: oneCo12complex contains the same number of Co− N bonds (of similar length, according to the crystal structures, and therefore similar strength) as threeCo4complexes or six
Co2complexes. Similarly, there are more pairwiseπ−πstacking interactions in larger assemblies, but the crystal structures show 12 such interactions inCo4and 36 inCo12, so the number of
π−πstacking interactions is two per ligand in each case. The main systematic structural change that would favor formation of larger assemblies is a decrease in the surface area to volume ratio: the larger the assembly, the smaller is the proportion of hydrophobic ligand backbone that is exposed to water at the surface, and the greater is the proportion that is buried in the interior and protected from solvent. Thus, the hydrophobic effect systematically favors larger assemblies.18We can estimate the surface areas of the complexes by using the X-ray crystal structures. Using a water molecule as the probe, the solvent-accessible surface areas of the complex cations ofCo4 and Co12 are 2076 and 4885 Å2, respectively. Thus, three complex cations ofCo4have an external surface area of ca. 6200 Å3in contact with the aqueous solvent, and reorganizing them into a single Co12 complex cation reduces the hydrophobic surface area by ca. 1300 Å3, providing a strong driving force for formation of the larger assembly in water.19This competition between an increased hydrophobic effect, which promotes larger assemblies, with other entropic/electrostatic factors promoting fragmentation into smaller assemblies, qualitatively explains the concentration and temperature dependence of the equilibrium composition of the Co2/Co4/Co12 mixture in aqueous solution.
(vi). Effect of Changing Solvent.Our hypothesis that the hydrophobic effect drives formation of the larger assemblies by minimizing the solvent-accessible surface area is easily tested by measuring 1H NMR spectra in nonaqueous solvents. The
complexes are poorly soluble in anything except water. However, a saturated solution of the as-isolated reaction mixture in CD3NO2at 25°C (ca. 1 mg in 0.6 cm3of solvent),
allowed to equilibrate for several days, showed the presence of onlyCo2(Figure 9a). The spectrum was weak and noisy, but in
[image:7.625.60.302.198.337.2]the negative chemical shift region we can clearly see that there are four signals consisting of two protons in two different environments, exactly similar to what we see forCo2in aqueous solution (Figure 2) and inconsistent with formation of either of the larger complexes. ES mass spectra of the saturated solution ofCo2in CD3NO2agreed with this, with signals forCo2but none forCo4orCo12being apparent. This solution was then Figure 8. Partial 1H NMR spectra showing the evolution of the
mixture of complexes under different conditions, starting with redissolved crystals ofCo2[6 mg in 0.6 cm3of D2O; spectrum (i)].
Spectra (ii) and (iii) show the equilibrium slowly being established at RT, with spectrum (iii) being similar to thefirst spectrum of Figure 7 (the as-isolated mixture of complexes at RT). Spectra (iv) and (v) show the change in composition toward almost completely pureCo2
over 24 h as the temperature is increased to 100°C; spectrum (vi) shows that cooling the sample to RT results in the previous equilibrium of spectrum (iii) being re-established.
Figure 9. Partial 1H NMR spectra at 25 °C of the crude reaction
product [(BF4)−salt; 1 mg in 0.6 cm3of solvent]: (a) in CD3NO2,
showing the presence of onlyCo2(compare with Figure 2), and (b) in
D2O, showing the presence of a mixture ofCo2(green●) andCo4
[image:7.625.335.555.516.612.2]evaporated to dryness and redissolved in 0.6 cm3 of D 2O, to
allow comparison of the 1H NMR spectra between the two solvents at the same concentration. After a few days to allow the solution to equilibrate at room temperature (RT), the1H NMR spectrum in D2O (Figure, 9b) showed thatbothCo2and
Co4were present, as illustrated by the appearance of six signals in the negative chemical shift region, four from Co2 and two from Co4, exactly matching the corresponding signals in Figures 2 and 4. This solution was too dilute to allow formation of anyCo12(see next section), but the general behavior is clear: in a nonaqueous solvent, onlyCo2can be detected because the hydrophobic effect, which is the driving force for assembly of Co4andCo12in water, disappears. Indeed we could only obtain crystals ofCo2from MeNO2solutionall crystallizations from
aqueous solution afforded eitherCo4orCo12.
(vii). Interconversion between the Structures in Aqueous Solution: Effects of Concentration. We also examined the effect of concentration on the equilibrium between the three species in water. We repeated the series of experiments described above at different temperatures (25, 45, 70, and 100°C) but using a solution that was 10 times more concentrated (60 mg of material in 0.6 cm3 of D2O). The
difference was striking (Figure 10). At 25 °C, the higher
concentration resulted in the solution at equilibrium containing almost entirelyCo12, withCo4andCo2being barely detectable. As before, as the temperature increased, the amount ofCo12 diminished, and the amounts ofCo4andCo2increased; at 100 °C all three components were present in significant amounts (Figure 8). This result contrasts with the dilute solution in whichCo2dominated at 100°C (Figure 7).
This is a manifestation of basic principles of equilibria when there are different numbers of species on either side of the process. Consider the equilibrium between three molecules of Co4and one ofCo12(eq 1).
⇌
3Co4 Co12 (1)
=K
[Co ]12 [Co ]4 3 (2)
The associated equilibrium constant (eq 2) shows that, as the total concentration increases, the balance will quickly shift
toward the larger complex. A factor of 10 increase in the equilibrium concentration of Co4 requires a factor of 1000 increase in the concentration of Co12 to maintain the equilibrium constant, that is, the [Co12]/[Co4] ratio will increase by a factor of 100. Similarly, in the 2Co2 ⇌ Co4 equilibrium, increasing the concentration ofCo2by a factor of 10 requires [Co4] to increase by a factor of 100, that is, a factor of 10 increase in the [Co4]/[Co2] ratio. A shift in concentration domain by a factor of 10as per the difference between spectra in Figures 7 and 8therefore strongly increases the proportions of the larger complexes present in the equilibrium mixture.
Apart from the signals in the1H NMR spectrum assignable to Co2, Co4, and Co12, at the high concentration/low temperature limit, we can see evidence of additional weak signals (shown in purple in Figure 10), which do not correspond to any of the three known species. These signals decrease in intensity at higher temperature. The appearance of signals that are only present at high concentrations and low temperatures is consistent with a small amount of an as-yet unidentified species that is even larger thanCo12. We could not identify this complex by mass spectrometry of the high concentration/low temperature mixture. We note, however, that we have identified (with different bridging ligands) examples of M16L24 assemblies in this cage family, so this
additional species might be an assembly of that nature.7a,20 (viii). Calculation of Speciation Behavior for the Co2/ Co4/Co12System in Aqueous Solution.From integration of signals associated with different species in the equilibrium we can determine their relative concentrations. This requires careful consideration of the symmetry of the complexes, as a single signal corresponds to a different number of protons in each case. InCo2 one signal corresponds to 3H as there are three equivalent ligands with no internal symmetry; in Co4, with six equivalent ligands all having 2-fold symmetry, each signal corresponds to 12H; and inCo12, with 18 ligands split into 12 equivalent sets (each of 1.5 magnetically equivalent ligands), each signal again corresponds to 12H. Taking this into account, and knowing the total amount of complex used, we can calculate the concentration of each species. From the set of spectra at 25°C we obtain, for the 2Co2⇌Co4equilibrium, an equilibrium constant of 8.4×10³M−1(ΔG°=−22 kJ mol−1);
[image:8.625.64.299.330.461.2]and for the 3Co4⇌Co12equilibrium, we obtain an equilibrium constant of 1.5×10⁷M−2(ΔG°=−41 kJ mol−1). These values are averaged from several NMR measurements at different concentrations. From these equilibrium constants, we see that for the 6Co2⇌Co12equilibrium, the equilibrium constant is 9.1×10¹⁸ M−5[ΔG= 108 kJ mol−1, i.e., 3(−22) + (−41) kJ mol−1 within rounding errors]. Table 2 lists the equilibrium Figure 10. A repeat of the experiment in Figure 7, but using a
concentration 10 times higher (60 mg of as-isolated complex mixture in 0.6 cm3of D
2O, corresponding to total Co concentration of 0.1 M).
The shift in the equilibrium composition (compared to the more dilute solution) at each temperature toward the larger complexes is clear. The purple circle denotes an unidentified complex that is not detectable at lower concentrations, which we believe to be a complex with nuclearity > Co12 on the basis of its concentration and
temperature dependence (see main text).
Table 2. Equilibrium Constants for Interconversions between Co2, Co4, and Co12at Different Temperatures
Based on Integration of Signals in1H NMR Spectraa
temperature,°C K2−4, M−1 K4−12, M−2 K2−12, M−5
25 8.4×10³ 1.5×10⁷ 9.1×10¹⁸ 45 2.8×10³ 4.8×10⁷ 1.1×10¹⁸ 70 7.4×10² 2.1×10⁷ 8.7×10¹⁵ 100 3.6×10² 1.0×10⁷ 4.6×10¹⁴
aEquilibrium constantK
2−4is for the 2Co2⇌Co4equilibrium;K4−12
is for the 3Co4⇌Co12equilibrium; andK2−12is for the 6Co2⇌Co12
equilibrium. HenceK2−12= [K2−4]3[K4−12].
constants at four different temperatures (25, 45, 70, and 100
°C). From these equilibrium constants, we can determine the speciation behavior for the whole three-component system at a range of temperatures, as shown in Figure 11. The accuracy of
the speciation diagrams is limited by uncertainty in measure-ments of integral values of weak signals in paramagnetic complexesin the 6Co2 ⇌ Co12 equilibrium constant, for example, the equilibrium constant includes an intensity measurement with an estimated uncertainty of ±20% raised to the sixth powerbut the general behavior is clear.
As the temperature increases we see the curves that describe the proportions of each species at that temperature shift to the right such that the concentration at whichCo12disappears, and the smaller complexes appear, increases. Thus, at higher temperatures, a given concentration results in more fragmenta-tion. The black line in Figure 11 drawn at [Co] = 1×10⁻²M corresponds to the concentration used for the1H NMR spectra
in Figure 7. From the intersections of this line with the 25°C curves (marked by circles on Figure 11) we can see that the equilibrium solution contains Co12 as the major component,
Co4 as a significant minor component, and almost no Co2, which agrees with the RT spectrum in Figure 7. Conversely the intersections of the black line with the 100°C speciation curves (marked by crosses) show that the equilibrium solution is dominated byCo2with a small amount ofCo4and virtually no
Co12, which again agrees well with the 100°C spectrum (top of Figure 7). The match between the observed1H NMR spectra
in Figure 10, recorded at the higher concentration of [Co] = 0.1 M, and the calculated speciation behavior in Figure 11, is less quantitatively convincingpresumably because our model does not take into account the formation of the additional fourth species, larger thanCo12, which starts to appear at high concentrations (purple circles in Figure 10).
We note also that Figure 11 shows how fortunate we were to be able to isolate crystals ofCo4from cold aqueous solution: the high concentrations (molar) in developing crystals should
give almost exclusivelyCo12under those conditions, except that the interconversion fromCo4toCo12was clearly very slow at that temperature compared to the time scale of crystal growth (days).
■
CONCLUSIONSThe three complexes [Co2(L18w)
3]4+ (Co2, a dinuclear mesocate), [Co4(L18w)6]8+ (Co4, a tetrahedral cage), and [Co12(L18w)
18]24+(Co12, a truncated tetrahedral cage) exist in slow equilibrium with each other in aqueous solution. All three could be crystallized under different conditions and have been structurally characterized: inCo2all three bridging ligands span both metal ions, whereasCo4andCo12are cages with a metal ion at each vertex and a bridging ligand spanning every edge. The equilibrium depends on both temperature and concen-tration and could readily be followed by1H NMR spectroscopy of the paramagnetic complexes. Increasing temperature and increasing dilution both favor fragmentation to give a large proportion of the smaller assemblies, for entropic reasons. In opposition to this, the hydrophobic effect favors reorganization of the smaller complexes to giveCo12, which results in a greater proportion of the hydrophobic surface area being shielded from the water, so that the larger assembly dominates at high concentrations and low temperatures. Confirmation of this hypothesis comes from measurement of the product distribu-tion in a nonaqueous solvent: in MeNO2 (in which the
complexes are sparingly soluble) only the smallest complexCo2 could be detected by 1H NMR spectroscopy and mass spectrometry with no traces of the larger assemblies, whereas in water at the same low concentration, substantial proportions of Co4 are present. Thus, we have demonstrated a complex equilibrium between three structurally characterized metal− ligand assemblies, which can be understood on the basis of changes in temperature, concentration, and solvent, and we have calculated the speciation behavior for theCo2/Co4/Co12 system in water.
■
EXPERIMENTAL SECTIONGeneral Details. Instrumentation used for 1H NMR and
low-resolution mass spectrometry measurements was described previ-ously.12Ligand precursorA(Scheme 1) was prepared according to the published method.12a Other metal salts and organic reagents were obtained from Sigma-Aldrich and used as received. High-resolution mass spectra (see Supporting Information) were measured using a ThermoFisher Orbitrap Elite instrument equipped with an HESI source: full details of instrument settings and conditions are in Supporting Information.
Ligand Synthesis. (i). Protected Ligand B. A mixture of compound A (0.50 g, 1.73 mmol) and sodium hydride (60% dispersion in mineral oil; 0.069 g, 1.73 mmol) in dry tetrahydrofuran (THF, 25 cm3) under N
2 was stirred for 10 min.
1,8-Bis-(bromomethyl)naphthalene (0.27 g, 0.86 mmol) was then added, and the mixture was stirred at 70 °C for 8 h, at which point an additional portion of sodium hydride (60% dispersion in mineral oil; 0.069 g, 1.73 mmol) was added. The reaction was monitored by thin layer chromatography (silica, CH2Cl2/MeOH, 95:5 v/v) until starting
materials were consumed (∼24 h). The reaction was then cooled to room temperature, and MeOH (10 cm3) was added slowly and
dropwise to destroy residual NaH. After evaporation of solvents the crude product was purified by column chromatography (silica, CH2Cl2/MeOH, 95:5 v/v). Traces of residual
1,8-bis(bromomethyl)-naphthalene elute with the solvent front; the product has an Rf of
∼0.6, and other impurities adhered to the top of the column. PureB
was obtained as a yellow oil. Yield: 0.61 g, 97%. ES MS:m/z731.4 (M
+ H)+.1H NMR (400 MHz, CDCl
[image:9.625.66.290.118.278.2]3):δ0.13 (12H, s; Me), 0.96 (18H,
Figure 11.Speciation behavior of theCo2 (green)/Co4 (red)/Co12
(blue) system in aqueous solution at four different temperatures (25, 45, 70, 100°C) based on the stepwise equilibrium constants (Table 2) calculated from the NMR spectral integrals at each temperature. For each species the curves corresponding to the limiting temperatures of 25 and 100°C are labeled; the temperature increase from one curve to the next follows the direction of the arrows. The black vertical line, corresponding to [Co] = 1×10⁻²M, is to facilitate comparison with
the1H NMR spectra in Figure 7; the○symbols show the intersection
with the 25°C curves, and the×symbols show the intersection with the 100°C curves (see main text).
s;tBu), 4.79 (4H, s; CH
2O), 5.95 (4H, s; CH2), 6.89 (2H, d,J= 2.5
Hz; pyrazolyl), 7.17 (2H, d, J = 2.5 Hz; pyrazolyl), 7.26 [4H, m; overlapping pyridyl H5and naphthyl (H2/7or H4/5)], 7.48 (2H, t,J= 8.0 Hz; naphthyl H3/6), 7.88 (2H, s; pyridyl H3), 7.94 [2H, d,J= 8.0 Hz; naphthyl (H2/7or H4/5)], 8.60 (1H, d,J= 5.0 Hz; pyridyl H6).
(ii). Deprotected Ligand L18w.To a solution of protected ligand B
(0.610 g, 0.834 mmol) in THF (30 cm3) was added
tetrabutylammo-niumfluoride (0.530 g, 1.67 mmol); the reaction mixture was stirred for 18 h at room temperature. After this time CHCl3(40 cm3) was
added, and the mixture was stirred for a further 5 min. The mixture was then washed with water (3 ×50 cm3); the remaining organic
phase was dried over MgSO4, and the solvent was removed to give a
yellow solid. This was purified by column chromatography (silica, CH2Cl2/MeOH, 9:1 v/v) to afford pure L18was a white solid: in this
case trace impurities elutefirst, and the polar ligand is the last fraction to elute with an Rf of ∼0.1. Yield: 0.41 g (96%). Low-resolution
ESMS:m/z503.2 (M+ H)+. High-resolution ESMS: observed, m/z
503.2173; C30H27N6O2 (MH+) requires 503.2195. 1H NMR (400
MHz, deuterated dimethyl sulfoxide (DMSO-d6)):δ4.53 (4H, d,J=
5.6 Hz; CH2OHsimplifies to singlet on D2O shake), 5.46 (2H, t,J=
5.6 Hz; OHdisappears on D2O shake), 6.22 (4H, s; CH2), 6.91 (2H,
d,J= 2.5 Hz; pyrazolyl), 7.02 (2H, d,J= 8.0 Hz; naphthyl H2/7or
H4/5), 7.23 (2H, d,J= 5.0 Hz; pyridyl H5), 7.47 (2H, t,J= 8.0 Hz;
naphthyl H3/6), 7.73 (2H, d, J = 2.5 Hz; pyrazolyl), 7.90 (2H, s;
pyridyl H3), 7.97 (2H, d,J= 8.0 Hz; naphthyl H2/7or H4/5), 8.47 (2H,
d,J= 5.0 Hz; pyridyl H6). Found: C, 62.3; H, 5.6; N, 14.4%. Required for C30H26N6O2·4H2O: C, 62.7; H, 6.0; N, 14.6%.
Syntheses of Complexes.A mixture of L18w(30 mg, 0.06 mmol) and either Co(ClO4)2·6H2O (14.6 mg, 0.04 mmol) or Co(BF4)2·
6H2O (13.6 mg, 0.04 mmol) in MeOH (8 cm3) in a sealed Tefl
on-lined autoclave (total volume ca. 20 cm3) was heated to 100°C for 12
h in an oven and then slowly cooled (0.1 °C/min) to room temperature. The resulting orange solution was a mixture of the three complexesCo2,Co4, andCo12. The complexes could be isolated as
either their [BF4]−or [ClO4]−salts; however, X-ray quality crystals of
Co2 and Co12 were best obtained as their [BF4]− salts, and X-ray
quality crystals ofCo4 could only be obtained as the [ClO4]− salt.
Caution! Perchlorate salts are potentially explosive, should only be prepared and handled in small quantities, and not subjected to mechanical shock or grinding.
The conditions necessary for growing X-ray quality crystals of each component separately are as follows. Crystals of [Co2(L18w)3](BF4)4
(orange plates) were obtained by diffusion of diethyl ether or diisopropyl ether vapor into a solution of the crude product in MeNO2. The yield of these from the crystallization was quantitative as
the larger complexes do not form in this solvent (see main text). Crystals of [Co4(L18w)6](ClO4)8(light orange blocks) were obtained
in low yield from slow cooling of a solution of the crude reaction mixture in D2O in an NMR tube. The crystallization was not allowed
to go to completion to avoid contamination with crystals ofCo12,
which also grow from aqueous solution. Crystals of [Co12(L18w)18]
-(BF4)24(orange blocks) were obtained in low yield from slow cooling
of a solution of [Co12(L18w)18](BF4)24 that had been prepurified by
size-exclusion chromatography on Sephadex G-50 column (see main text). Again the crystallization was not allowed to go to completion to avoid contamination with crystals of Co4, which also grow from
aqueous solution. ES mass spectra and1H NMR spectra were obtained
on samples prepared using freshly redissolved crystals of the purified complexes.
Data for [Co2(L18w)3](ClO4)4: m/z 1923, 912, 575, 406 for
{Co2(L18w)3(ClO4)4−n}n+(n= 1, 2, 3, 4, respectively). Accurate mass
measurement for the signal from {Co2(L18w)3(ClO4)2}2+: measured,
m/z911.1998; calculated for C90H78N18O14Cl2Co2,m/z911.1993 (see
Supporting Information).
Data for [Co4(L18w)6](ClO4)8: m/z 1926, 1251, 913 for
{Co4(L18w)6(ClO4)8−n}n+ (n = 2, 3, 4, respectively). Accurate mass
measurements were performed on the tetrafluoroborate salt. For the signal from {Co4(L18w)6(BF4)5}3+: measured, m/z 1228.3425;
calculated for C180H156N36O12B5F20Co4,m/z1228.3448 (see
Support-ing Information).
Data for [Co12(L18w)18](BF4)24:m/z1887, 1611, 1394, 1229, 1098,
990, 900 for {Co12(L18w)18(BF4)24−n}n+ (n = 6, 7, 8, 9, 10, 11, 12,
respectively). Accurate mass measurement for the signal from {Co12(L18w)18(BF4)16}8+: measured, m/z 1392.7642; calculated for
C570H494N114O38B16F64Co12,m/z1392.7638 (see Supporting
Informa-tion).
Crystallography.The work to obtain the crystal structure of the ligand L18w·HBF
4·2CHCl3was performed at the University of Sheffield
using a Bruker Apex-2 diffractometer with a Mo Kα sealed tube source; data collection, solution, and refinement were routine, and the structure is shown in the Supporting Information.
For [Co2(L18w)3](BF4)4, [Co4(L18w)6](ClO4)8·18H2O, and
[Co12(L18w)18](BF4)24·1.5H2O, data collections in each case were
performed at the EPSRC National Crystallography Service at the University of Southampton, U.K., using a Rigaku FR-E+ diffractometer equipped with a Saturn 724+ CCD detector, using high-intensity Mo Kαradiation from either a rotating anode or a microfocus sealed-tube source.21Structure solution and refinement was with the SHELX suite of programmes.22In all cases crystals exhibited the usual problems of this type of structure, namely, weak scattering due to a combination of poor crystallinity, extensive solvation, and disorder of anions/solvent molecules. In each case the basic structure and connectivity of the complex cation could be unambiguously determined, which is all that is required for the purposes of this work. Extensive use of geometric restraints on aromatic rings, anions, and aromatic displacement parameters were required to keep refinements stable. Solvent molecules that could be modeled satisfactorily were included in the final refinements; in all cases large regions of diffuse electron density that could not be modeled (from disordered solvents/counterions) were removed from the refinement, using either the SQUEEZE function in PLATON (forCo4)23 or the“Solvent Mask”function in
OLEX-2 (forCo2andCo12).24Full details are in the individual CIFs.
We emphasize that the compositions given in Table 1 are approximate not just because of severe disorder of anions/solvents but because the number of anions may be lower than expected (i.e., less than two per Co2+ion) if some of the OH groups on the complex cations are deprotonated in the crystals: the high positive charge on the complex cations renders the OH groups acidic in aqueous solution, which makes this plausible.18g For Co2 the total electron count
removed by the“solvent mask”in OLEX was 551 e/unit cell, which amounts to ca. 46 electrons per dinuclear complex unit. Only one and one-half of the expected four [BF4]− anions could be located per
dinuclear complex cation. The 46 e/complex unit removed during the refinement by the “solvent mask” function is equivalent to ca. one additional [BF4]−anion, implying partial deprotonation of peripheral
OH groups on the complex cation and therefore fewer anions than expected.
For Co4 the total electron count per unit cell removed by the
“SQUEEZE”function in PLATON was 133 e, which amounts to ca. 33 electrons per tetranuclear complex unit. We could only locate seven [ClO4]−anions per complex unit rather than the expected eight. The
“SQUEEZED” electron density is insufficient to account for this missing anion (49 e) so we suggest that there are only seven [ClO4]−
anions per complex cation in the crystal due to loss of one acidic proton from the cation, with the 33 e/complex being equivalent to ca. three water molecules per complex.
For Co12 only four of the expected 24 [BF4]− anions could be
located perCo12cation. The total electron count per unit cell removed
by the“solvent mask”in OLEX was 3943 e/unit cell, or ca. 657 e/Co12
complex unit, which is consistent with ca. 16 [BF4]−anions, giving a
(maximum) total of 20 anions, or fewer anions plus solvent molecules. This is again consistent with partial deprotonation of OH groups during crystallization to reduce the high positive charge of the cage.
■
ASSOCIATED CONTENT*
S Supporting Informationhexagonal faces of a complex cation, CIFfiles containing X-ray crystallographic data and structures. This material is available free of charge via the Internet at http://pubs.acs.org.
■
AUTHOR INFORMATIONCorresponding Author
*E-mail: m.d.ward@sheffield.ac.uk.
Notes
The authors declare no competingfinancial interest.
■
ACKNOWLEDGMENTSWe thank the EPSRC for a Ph.D. studentship (to W.C.), Dr. A Stephenson and Mr. H. Adams for assistance with the X-ray crystallography, and Dr. R. Beniston for recording the high-resolution mass spectra. Mass spectrometry analysis was undertaken in biOMICS, the University of Sheffield Faculty of Science Mass Spectrometry Facility, supported by funding from Yorkshire Cancer Research (SHEND01), the European Structural Fund Programme, and the University of Sheffield Alumni Fund.
■
REFERENCES(1) Reviews on coordination cages: (a) Fiedler, D.; Leung, D. H.; Bergman, R. G.; Raymond, K. N. Acc. Chem. Res. 2005, 38, 349. (b) Fujita, M.; Tominaga, M.; Hori, A.; Therrien, B.Acc. Chem. Res. 2005,38, 369. (c) Seidel, S. R.; Stang, P. J.Acc. Chem. Res.2002,35, 972. (d) Hamilton, T. D.; MacGillivray, L. R.Cryst. Growth Des.2004,
4, 419. (e) Ward, M. D.Chem. Commun.2009, 4487. (f) Perry, J. J.; Perman, J. A.; Zaworotko, M. J. Chem. Soc. Rev. 2009, 38, 1400. (g) Alvarez, S.Dalton Trans.2006, 2209. (h) Amouri, H.; Desmarets, C.; Moussa, J.Chem. Rev.2012,112, 2015. (i) Williams, A. F.Coord. Chem. Rev.2011,255, 2104. (j) Laughrey, Z.; Gibb, B.Chem. Soc. Rev. 2011,40, 363. (k) Jin, P.; Dalgarno, S. J.; Atwood, J. L.Coord. Chem. Rev.2012,254, 1760. (l) Chakrabarty, R. J.; Mukherjee, P. S.; Stang, P. J.Chem. Rev.2011,111, 6810. (m) Inokuma, Y.; Kawano, M.; Fujita, M. Nat. Chem. 2011, 3, 349. (n) Pluth, M. D.; Bergman, R. G.; Raymond, K. N.Acc. Chem. Res.2009,42, 1650. (o) Breiner, B.; Clegg, J. K.; Nitschke, J. R.Chem. Sci.2011,2, 51. (p) Smulders, M. M. J.; Riddell, I. A.; Browne, C.; Nitschke, J. R.Chem. Soc. Rev.2013,42, 1728. (q) Nakamura, T.; Ube, H.; Shionoya, M.Chem. Lett.2014,42, 328.
(2) (a) Saalfrank, R. W.; Stark, A.; Peters, K.; von Schnering, H. G.
Angew. Chem., Int. Ed. Engl.1988,27, 851. (b) Saalfrank, R. W.; Stark, A.; Bremer, M.; Hummel, H.-U.Angew. Chem., Int. Ed. Engl.1990,29, 311.
(3) (a) Tominaga, M.; Suzuki, K.; Kawano, M.; Kusukawa, T.; Ozeki, T.; Sakamoto, S.; Yamaguchi, K.; Fujita, M.Angew. Chem., Int. Ed. 2004,43, 5621. (b) Sun, Q.-F.; Iwasa, J.; Ogawa, D.; Ishido, Y.; Sato, S.; Ozeki, T.; Sei, Y.; Yamaguchi, K.; Fujita, M.Science 2010,328, 1144. (c) Harris, K.; Fujita, D.; Fujita, M.Chem. Commun.2013,49, 6703.
(4) Ward, M. D.; Raithby, P. R.Chem. Soc. Rev.2013,42, 1619. (5) Northrop, B. H.; Zheng, Y.-R.; Chi, K.-W.; Stang, P. J.Acc. Chem. Res.2009,42, 1554.
(6) (a) Clever, G. H.; Kawamura, W.; Tashiro, S.; Shiro, M.; Shionoya, M.Angew. Chem., Int. Ed. Engl.2012,51, 2606. (b) Han, M.; Hey, J.; Kawamura, W.; Stalke, D.; Shionoya, M.Inorg. Chem.2012,
51, 9574. (c) Clever, G. H.; Tashiro, S.; Shionoya, M.J. Am. Chem. Soc. 2010,132, 9973.
(7) (a) Stephenson, A.; Argent, S. P.; Riis-Johannessen, T.; Tidmarsh, I. S.; Ward, M. D.J. Am. Chem. Soc.2011,133, 858. (b) Albrecht, M.; Janser, I.; Runsink, J.; Raabe, G.; Weis, P.; Fröhlich, R.Angew. Chem., Int. Ed.2004,43, 6662. (c) Cotton, F. A.; Murillo, C. A.; Yu, R.Dalton Trans. 2006, 3900. (d) Yamanoi, Y.; Sakamoto, Y.; Kusukawa, T.; Fujita, M.; Sakamoto, S.; Yamaguchi, K.J. Am. Chem. Soc.2001,123, 980. (e) Umemoto, K.; Yamaguchi, K.; Fujita, M.J. Am. Chem. Soc.
2000,122, 7150. (f) Fujita, M.; Sasaki, O.; Mitsuhashi, T.; Fujita, T.; Yazaki, J.; Yamaguchi, K.; Ogura, K. Chem. Commun. 1996, 1535. (g) Chand, D. K.; Biradha, K.; Kawano, M.; Sakamoto, S.; Yamaguchi, K.; Fujita, M. Chem.Asian J. 2006, 1−2, 82. (g) Samanta, D.; Mukherjee, P. A. Chem.Eur. J. 2014, 20, 12483. (h) Meng, W.; Ronson, T. K.; Clegg, J. K.; Nitschke, J. R.Angew. Chem., Int. Ed.2013,
52, 1017. (i) Riddell, I. A.; Hristova, Y. R.; Clegg, J. K.; Wood, C. S.; Breiner, B.; Nitschke, J. R. J. Am. Chem. Soc. 2013, 135, 2723. (j) Scherer, M.; Caulder, D. L.; Johnson, D. W.; Raymond, K. N.
Angew. Chem., Int. Ed. Engl.1999,38, 1588. (k) Chen, Q.; Jiang, F.; Yuan, D.; Lyu, G.; Chen, L.; Hong, M.Chem. Sci.2014,5, 483.
(8) (a) Lehn, J.-M.Chem.Eur. J.1999,5, 2455. (b) Cougnon, F. B. L.; Sanders, J. K. M.Acc. Chem. Res.2012,45, 2211. (c) Moulin, E.; Cormos, G.; Guiseppone, N.Chem. Soc. Rev.2012,41, 1031.
(9) (a) Campos-Fernandez, C. S.; Schottel, B. L.; Chifotides, H. T.; Bera, J. K.; Bacsa, J.; Koomen, J. M.; Russell, D. H.; Dunbar, K. R.J. Am. Chem. Soc.2005,127, 12909. (b) Hasenknopf, B.; Lehn, J.-M.; Boumediene, N.; Dupont-Gervais, A.; Van Dorsselaer, A.; Kneisel, B.; Fenske, D.J. Am. Chem. Soc.1997,119, 10956.
(10) Baxter, P. N. W.; Lehn, J.-M.; Baum, G.; Fenske, D.Chem. Eur. J.2000,6, 4510.
(11) (a) Argent, S. P.; Adams, H.; Riis-Johannessen, T.; Jeffery, J. C.; Harding, L. P.; Mamula, O.; Ward, M. D.Inorg. Chem.2006,45, 3905. (b) Bell, Z. R.; Jeffery, J. C.; McCleverty, J. A.; Ward, M. D.Angew. Chem., Int. Ed.2002,41, 2515.
(12) (a) Whitehead, M.; Turega, S.; Stephenson, A.; Hunter, C. A.; Ward, M. D.Chem. Sci. 2013,4, 2744. (b) Turega, S.; Cullen, W.; Whitehead, M.; Hunter, C. A.; Ward, M. D.J. Am. Chem. Soc.2014,
136, 8475. (c) Cullen, W.; Turega, S.; Hunter, C. A.; Ward, M. D.
Chem. Sci.2015,6, 625.
(13) (a) Amouri, H.; Mimassi, L.; Rager, M. N.; Mann, B. E.; Guyard-Duhayon, C.; Raehm, L.Angew. Chem., Int. Ed.2005,44, 4543. (b) Tidmarsh, I. S.; Taylor, B. F.; Hardie, M. J.; Russo, L.; Clegg, W.; Ward, M. D.New J. Chem.2009,33, 366. (c) Hall, B. R.; Manck, L. E.; Tidmarsh, I. S.; Stephenson, A.; Taylor, B. F.; Blaikie, E. J.; Vander Griend, D. A.; Ward, M. D.Dalton Trans.2011,40, 12132. (d) Turega, S.; Whitehead, M.; Hall, B. R.; Meijer, A. J. H. M.; Hunter, C. A.; Ward, M. D.Inorg. Chem.2013,52, 1122.
(14) (a) Albrecht, M.; Kotila, S.Angew. Chem., Int. Ed.1995,34, 2134. (b) Xu, J.; Parac, T. N.; Raymond, K. N.Angew. Chem., Int. Ed. 1999, 38, 2878. (c) Zhang, Z.; Dolphin, D. Chem. Commun. 2009, 6931. (d) Ronson, T. K.; Adams, H.; Riis-Johannessen, T.; Jeffery, J. C.; Ward, M. D.New J. Chem.2006,30, 26.
(15) (a) Harding, L. P.; Jeffery, J. C.; Riis-Joannessen, T.; Rice, C. R.; Zeng, Z. T.Dalton Trans.2004, 2396. (b) Albrecht, M.; Fröhlich, R.J. Am. Chem. Soc.1997,119, 1656.
(16) (a) Fleming, J. S.; Mann, K. L. V.; Carraz, C.-A.; Psillakis, E.; Jeffery, J. C.; McCleverty, J. A.; Ward, M. D.Angew. Chem., Int. Ed. 1998,37, 1279. (b) Paul, R. L.; Bell, Z. R.; Jeffery, J. C.; McCleverty, J. A.; Ward, M. D.Proc. Natl. Acad. Sci. U. S. A.2002,99, 4883.
(17) Cotton, F. A.; Murillo, C. A.; Yu, R.Dalton Trans.2005, 3161. (18) (a) Southall, N. T.; Dill, K. A.; Haymet, A. D. J.J. Phys. Chem. B 2002,106, 521. (b) Hummer, G.; Garde, S.; García, A. E.; Paulaitis, M. E.; Pratt, L. R.J. Phys. Chem. B 1998,102, 10469. (c) Pratt, L. R.; Pohorille, A. Chem. Rev. 2001, 102, 2671. (d) Tanford, C. Science 1978,200, 1012. (e) Houk, K. N.; Leach, A. G.; Kim, S. P.; Zhang, X.
Angew. Chem., Int. Ed.2003,42, 4872. (f) Meyer, E. A.; Castellano, R. K.; Diederich, F.Angew. Chem., Int. Ed.2003,42, 1210. (g) Hunter, C. A.Chem. Sci.2013,4, 834.
(19) We showed recently that burial of an aromatic ring in the hydrophobic cavity of a cage from this family resulted in stabilisation by 0.12 kJ mol−1per Å2of desolvated surface (ref 12a). On this basis
combining threeCo4complexes into a singleCo12complex in aqueous
solution would afford ∼160 kJ mol−1 of stabilization from the
hydrophobic effect. This must be substantially offset by factors favouring fragmentation into smaller assemblies, or the smaller assemblies would never form, but it gives an indication of the magnitude of the effect. In fact from 1H NMR integrals we can
estimate the 3Co4⇌Co12equilibrium constant, which givesΔG°= −41 kJ mol−1at 298 K (section viii, Table 2).
(20) Stephenson, A.; Sykes, D.; Ward, M. D.Dalton Trans.2013,42, 6756.
(21) Coles, S. J.; Gale, P. A.Chem. Sci.2012,3, 683. (22) Sheldrick, G. M.Acta Crystallogr., Sect. A2008,64, 112. (23) (a) Spek, A. L.J. Appl. Crystallogr.2003,36, 7. (b) van der Sluis, P.; Spek, A. L.Acta Crystallogr., Sect. A: Found. Crystallogr. 1990,46, 194.
(24) Dolomanov, O. V.; Bourhis, L. J.; Gildea, R. J.; Howard, J. A. K.; Puschmann, H.J. Appl. Crystallogr.2009,42, 339.
4. (left) A view of the complete cation showing all three (equivalent) ligandscolored separately](https://thumb-us.123doks.com/thumbv2/123dok_us/7877127.183246/3.625.74.562.318.523/figure-complex-cation-complete-showing-equivalent-ligandscolored-separately.webp)
24](https://thumb-us.123doks.com/thumbv2/123dok_us/7877127.183246/6.625.64.296.317.490/figure-mhz-h-nmr-spectrum-redissolvedcrystals-co-bf.webp)
![Figure 8. Partialredissolved crystals ofmixture of complexes under di 1H NMR spectra showing the evolution of thefferent conditions, starting with Co2 [6 mg in 0.6 cm3 of D2O; spectrum (i)].Spectra (ii) and (iii) show the equilibrium slowly being establishe](https://thumb-us.123doks.com/thumbv2/123dok_us/7877127.183246/7.625.335.555.516.612/partialredissolved-ofmixture-complexes-evolution-theerent-conditions-equilibrium-establishe.webp)
![Figure 11. Speciation behavior of thethe next follows the direction of the arrows. The black vertical line,corresponding to [Co] = 1calculated from the NMR spectral integrals at each temperature](https://thumb-us.123doks.com/thumbv2/123dok_us/7877127.183246/9.625.66.290.118.278/speciation-behavior-direction-vertical-corresponding-calculated-integrals-temperature.webp)
