This is a repository copy of Introducing Importance-Performance-Impact Analysis (IPIA): A method to strategically prioritize resources allocation.
White Rose Research Online URL for this paper: http://eprints.whiterose.ac.uk/86337/
Version: Accepted Version
Proceedings Paper:
Lin, Z and Vlachos, I orcid.org/0000-0003-4921-9647 (2015) Introducing
Importance-Performance-Impact Analysis (IPIA): A method to strategically prioritize resources allocation. In: Proceedings of EURAM 2015. EURAM 2015: 15th Annual Conference, 17-20 Jun 2015, Warsaw, Poland. EURAM .
Reuse
Items deposited in White Rose Research Online are protected by copyright, with all rights reserved unless indicated otherwise. They may be downloaded and/or printed for private study, or other acts as permitted by national copyright laws. The publisher or other rights holders may allow further reproduction and re-use of the full text version. This is indicated by the licence information on the White Rose Research Online record for the item.
Takedown
If you consider content in White Rose Research Online to be in breach of UK law, please notify us by
Introducing Importance-Performance-Impact Analysis (IPIA): A method to
strategically prioritize resources allocation
Abstract
The importance–performance analysis (IPA) model has been widely used as a strategic
resource allocation tool for improving customer satisfaction. There are several shortcomings
associated with IPA which could lead to incorrect decisions. In this paper, we propose a
novel analytical framework, the “Importance-Performance-Impact Analysis” (IPIA) to
overcome those shortcomings so as to provide managers with a powerful decision making
tool. The IPIA takes advantage of several advanced analytical techniques, such as Back
Propagation Neural Network (BPNN), Decision Making Trial and Evaluation Laboratory
(DEMATEL) and Analytic Network Process (ANP). We illustrate IPIA using the case of an
airline company in China. Two primary data sources were used: A passenger survey to obtain
the attribute importance and performance, and an expert panel survey to obtain attribute
impact. Resources allocation recommendations for improving passenger satisfaction were
then derived from the IPIA. We discuss limitations and provide recommendations for future
research.
Keywords
Importance-Performance-Impact Analysis; Strategic resources allocation; Airlines
Introduction
Company managers need to strategically prioritize resource allocation to achieve optimal
level of customer satisfaction, which has been well recognized as the key to the firm’s
competitive advantage (Arif, Gupta, & Williams, 2013). One of the widely used analytical
frameworks by manager to make such decision is importance-performance analysis (IPA,
Azzopardi & Nash, 2013; Caber, Albayrak, & Loiacono, 2013; Pan, 2015). First introduced
by Martilla and James (1977), IPA is a simple and useful analytical tool based on a
two-dimension matrix, which displays the results of customer evaluation of the importance and
performance for the attributes of a product or service. In spite of its popularity, IPA suffers
from a number of shortcomings that reduce its reliability and usefulness of resource
allocation decisions (Deng, 2007; Oh, 2001). These shortcomings include conceptual ones,
such as construct validity of ‘Importance’ dimension and reliability of ‘Performance’
dimension, and methodological ones, such as discriminating thresholds of IPA quadrants,
measurement errors, lack of control, and the relationships between attributes Performance
and Importance. Critics of IPA have highlighted: (a) erroneous assumptions of linear
relationships between attribute performance and overall customer satisfaction (Caber et al.,
2013; Deng, 2007; Geng & Chu, 2012; Oh, 2001); (b) inadequate measures of attribute
importance (Matzler, Bailom, Hinterhuber, Renzl, & Pichler, 2004); and (c) assuming
independence individual attributes whereas there is strong correlation among them (Geng &
Chu, 2012; Matzler et al., 2004; Oh, 2001). Different modifications of IPA have been
proposed in the literature, such as IPA with Kano’s Model or Three-Factor Theory (e.g.
Arbore & Busacca, 2011; Kuo, Chen, & Deng, 2012), Marginal Utility Analysis based IPA
(Bacon, 2012), neural network based IPA (Mikulić & Prebežac, 2012) and the Asymmetric
These modifications have enhanced the usefulness of IPA for management practice.
Nevertheless, there are at least three issues that need to be solved. First, there are still a
number of conceptual and methodological shortcomings that need to be tackled. Second,
there have been very few studies that have integrated advanced decision making techniques
such as Back Propagation Neural Network (BPNN), Decision Making Trial and Evaluation
Laboratory (DEMATEL) and Analytic Network Process (ANP) into IPA (e.g. Hughes, Bond,
& Ballantyne, 2013; H.-S. Lee, 2015; O’Leary & Deegan, 2005; Sheng, Simpson, & Siguaw,
2014; Ziegler, Dearden, & Rollins, 2012). Third, prioritizing scarce resources in improving
service delivery and enhancing customer satisfaction is a Multi-Criteria Decision Making
(MCDM) task for managers (Geng & Chu, 2012; Hu, Lee, Yen, & Tsai, 2009). Researchers
have adopted MCDM techniques to improve IPA, nevertheless, their analysis was not based
on manager decision making data (eg. Hu et al., 2009). This is surprising, because ultimately
it is the manager decisions on prioritizing investment on delivery of the service that impact
on customer experience and satisfaction.
This paper aims to address the above issues of IPA by introducing a novel framework -
‘Importance- Performance-Impact Analysis’ (IPIA), which is based on several advanced
decision making techniques. The contribution of IPIA method is threefold: (a) it overcomes a
number of conceptual and methodological shortcomings by adding a new dimension (impact)
to the existing two IPA attributes (performance, importance), thus increasing the reliability
and validity of the proposed resource allocation. (b) IPIA takes advantage of several
advanced and powerful analytical tools that was not available in conventional IPA analysis.
In so doing, IPIA arrives at reliable propositions overcoming data limitations. (c) the addition
of impact dimension provides more insights to tourist managers that helps them in decide
We selected one of the major airline companies in China for the empirical illustration
of our framework, because of the growing importance of the Chinese market for the global
airlines industry (IATA, 2013), and the intense competition within the Chinese domestic
airline market (Shaw, Lu, Chen, & Zhou, 2009). The Chinese airline industry has experienced
tremendous growth in the last 30 years, and it is now the world’s second largest aviation
market, only behind the United States (Fu, Zhang, & Lei, 2012). The market continues to
grow at a very fast pace, thanks to a growing affluent middle class in the country, and it is
expected that the number of civil airports will reach 244 in 2020 (Fu et al., 2012).
Competition among industry rivals is particularly fierce due to the recent relaxation of market
entry for private firms, and global airlines entering to the Chinese market through either
direct flights or global alliance networks, such as Oneworld, SkyTeam and Star Alliance.
Intense competition also come from the aggressive development of the country’s high-speed
rail service, which has the world’s largest high-speed rail network linking virtually all major
cities in the country (Fu et al., 2012). This provides an especially appropriate field context for
the research.
The next section reviews the conventional IPA in the context of airline services
literature and discusses the development of IPIA, providing solutions to the existing
weaknesses of IPA in more detail. The subsequent section presents the four steps of IPIA
method, the selection of airline service in China, and the application of IPIA in this airline. It
follows findings section presenting the IPIA results, the IPIA table and IPIA bubble matrix.
Importance-Performance Analysis
Importance-Performance Analysis (IPA) has been widely adopted in a variety of sectors for
understanding customer satisfaction, identifying areas for improvement, and prioritizing
resource allocation. In a conventional IPA (Martilla & James, 1977), data are collected from
customer surveys that measure customer perceptions of the importance of a list of several
product and/or service attributes, and their satisfaction with respect to each of the attributes.
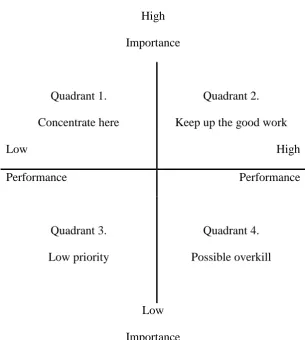
The data are then presented in a matrix, with the x-axis depicts attribute importance and the
y-axis attribute satisfaction, i.e. performance, with four quadrants based on their rankings (see
Figure 1). Attributes located in Quadrant 1 are “high importance and low performance”,
which require managers to “concentrate” their efforts and resources; Quadrant 2 is for
attributes that have both high importance and performance rankings, thus managers need to
“keep up the good work”; attributes in Quadrant 3 are low in both importance and
performance rankings, which are “low priority” for resource allocation, finally those fall into
Quadrant 4 are low in importance but high in performance, thus possibly ‘overkill’, managers
might direct their resources elsewhere, particularly to improve the performance of attributes
in Quadrant 1.
[Figure 1 about here]
The main advantage of IPA method is its simplicity for supporting management
decisions, yet there are several conceptual and methodological shortcomings which have been
identified in the literature (Bacon, 2003; Lai & Hitchcock, 2015; Matzler & Sauerwein, 2002;
Oh, 2001; Sever, 2015).
Conceptual shortcomings
Conceptual shortcomings of IPA include: construct validity of ‘Importance’ dimension and
Construct validity of ‘Importance’ dimension. Importance is often used as a proxy of
customer expectations (Oh, 2001), yet there is no agreement how to measure the perceived
value or significance of a product or service attribute to an individual. Construct validity of
the Importance dimension is usually influenced by cultural and demographic variables, which
makes the comparison of research results hard to interpret. Scholars also argue that customer
self-expressed value of importance cannot adequately capture the relative importance of the
attributes, which is another assumption of IPA method. To deal with this problem, some
scholars have resorted to the statistic inference methods to evaluate the relative importance of
the attributes. For example, Matzler and Sauerwein (2002) used multi-regression analysis to
derive the relative importance of quality characteristics, termed as the hidden importance.
Reliability of ‘Performance’ dimension. Performance dimension is used to evaluate how well
companies perform in allocating their resources based on the levels of customer satisfaction.
However, relying on one source of evidence to evaluate performance can jeopardize resource
allocation. Companies often use other sources of evidence such as mystery shopping, retail
and brand audits and competitor benchmarking to evaluate how well they perform across a
number of key performance indicators. Restricting Performance measurement across only the
importance attributes would mislead resource allocation decisions.
Methodological shortcomings
Methodological shortcomings of IPA include: discriminating the thresholds of IPA quadrants,
measurement errors, lack of control, and non-linear relationships between attributes’
Performance and Importance.
Discriminating the thresholds of IPA quadrants. The positioning of the thresholds that divide
the plot into quadrants is based on subjective judgment which could lead to inconsistencies in
in empirical applications. Two approaches have been commonly used to determine the
thresholds, which could lead to opposing results: (i) a data-centric approach uses the actual
the data mean values of observed importance and performance ratings as the cut-off points
among quadrants and (ii) a scale-centered approach uses the actual scales e.g. Likert scales
to divide IPA map. Results generated from using arbitrary scales could be biased and make
IPA comparisons unreliable. Moreover, actual data mean values of observed importance and
performance factors violates the conceptual assumption of IPA method that importance and
performance are measured independently.
Measurement errors: scales and measures of Importance and Performance are not developed
in a systematic way. Systematic bias towards attributes that favor high importance scores
would result in scales that underestimate performance attributes. To overcome the inadequacy
of direct measure of attribute importance (Matzler et al., 2004; Oh, 2001; Ryan & Huyton,
2002), statistical techniques such as correlation analysis (Deng, 2007), multiple regression
(Matzler & Sauerwein, 2002), and structural equation model have been used to acquire the
implicitly derived importance of attributes (Deng & Pei, 2009). Researchers have recently
applied artificial neural network analysis such as Back-Propagation Neural Network (BPNN)
to estimate attribute importance (Deng, Chen, & Pei, 2008; Hu et al., 2009).
Lack of control: Most IPA studies ignore the need to control IPA results over various factors.
IPA studies do not use statistical methods to examine the validity and reliability of results.
For example, Sever (2015) used Receiver Operating Characteristic (ROC) analysis to
categorize IPA attributes, while testing its validity and reliability.
Non-linear relationships between attributes Performance and Importance: Over the years,
the attribute linearity assumption, inherent in the conventional IPA, has been addressed in the
literature (Azzopardi & Nash, 2013; Matzler et al., 2004; Mittal & Kamakura, 2001). In an
customer satisfaction, researchers have incorporated Three-Factor Theory (e.g. Arbore &
Busacca, 2011; Kuo et al., 2012). To deal with the problems of interdependence among
attributes (Tsai & Chou, 2009; Wang & Tzeng, 2012; Wu, 2008; Yang, Shieh, Leu, & Tzeng,
2008), researchers have employed a hybrid model combining Decision Making Trial and
Evaluation Laboratory (DEMATEL) with Analytic Network Process (ANP) (Yang et al.,
2008).
Most of the improvements made to conventional IPA still focus on one perspective only,
namely by comparing the differences between attribute importance and performance based on
customer experience. But the intra-customer importance-performance analysis is not
sufficient for management decision making (Brown & Swartz, 1989; Krepapa, Berthon,
Webb, & Pitt, 2003). Although customer experience of services has impact on satisfaction
and consequently retention, ultimately it is the service provider’s perceptions that directly
affect the design and delivery of the service (Krepapa et al., 2003), and mismatch between
customer’s and provider’s perceptions can result in a waste of resources, and possibly
customer dissatisfaction and defection (Brown & Swartz, 1989). Multi-source evaluation can
enhance the firm’s ability to self-monitor and correct the deficiencies that arise in areas for
Proposed analytical framework: Importance-Performance-Impact Analysis
Inclusion of Impact dimension
In order to overcome the shortcomings of IPA method, we included one more dimension,
Impact, in the existing two dimensions of importance and performance. Impact refers to the
direct impact of attributes on resource allocation. Consumer surveys and retail audit can only
assess the indirect impact of attributes on resource allocation via performance, yet, decision
makers need to take into account how attributes influence resource allocation. For example,
putting too much emphasis on one attribute over the others can impact their availability,
production processes. The relation between attributes and resource allocation are far from
being linear and there is a complex interrelation between attributes and operation processes,
requiring multi-dimensional decision making tools to assist resource allocation. Consumer
surveys are not suitable for assessing attributes impact but experts and managers can provide
invaluable insights on it. Therefore, we propose to include an Impact dimension in the
existing IPA method. The data source for attribute impact is drawn from panel interview of
experienced managers in the industry.
Importance-Performance-Impact Analysis (IPIA)
To overcome the weaknesses of IPA, we propose the Importance-Performance-Impact
Analysis (IPIA) to help managers prioritizing resources, by adding Impact attribute
dimension to the existing importance and performance dimensions in IPA. Specific, IPIA
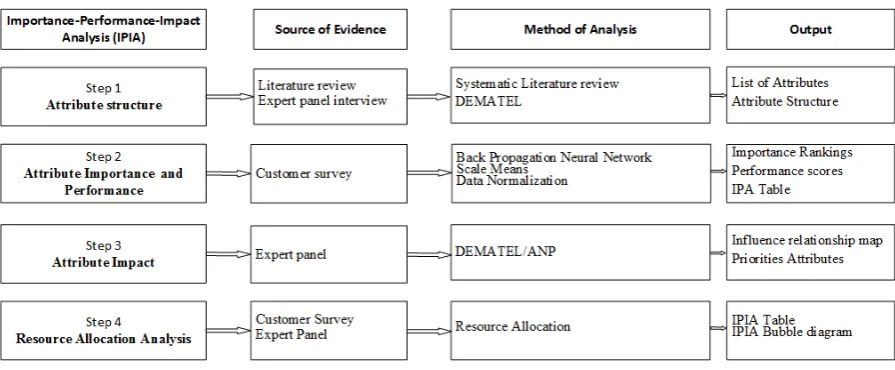
takes place the following steps (Figure 2):
Step 1. Determine attribute structure
Step 2. Measure and normalize the Importance and Performance of attributes
Step 3. Measure and normalize the Impact of each attributes,
[Figure 2 about here]
IPIA Step 1: Determine attributes Structure. The IPA model is considered as an
expectation-disconfirmation model that models customer satisfaction as a function of importance and
performance of different product or service attributes (Oh, 2001; Sever, 2015). Identifying
the key attributes, it is the first step to prioritize and allocate resources that create customer
satisfaction. However, there is no systematic way of generating a list of key attributes.
Furthermore, the linearity and independence of attributes is an assumption in IPA studies.
A number of empirical studies have reported that integrating Kano model or the ‘three
-factor theory’ with a revised IPA is superior to conventional models that have not considered
the non-linear effects. For example, the study of mobile service in Taiwan by Kuo et al.
(2012); the study of Taiwanese hot springs tourism by Deng (2007), the study of customer
satisfaction of banking service in Italy by Arbore and Busacca (2011), and the study of
European tourist satisfaction of their holiday destination, the Balearics, Spain by Alegre and
Garau (2011).
IPIA Step 2: Measure and Normalize attributes Importance and Performance. IPIA is an
extension of IPA method, therefore we suggest that the Importance and Performance of
attributes need to be measured using the established IPA tools taking into account any
conceptual and methodological shortcomings. For this reason, we use customer surveys as the
data source for measuring Importance and Performance of attributes. However, to overcome
the systematic bias towards attributes that favor high importance scores in conventional IPA
analysis, we measure Importance using artificial neural networks and Back-propagation
neural network.
Artificial neural network models were first introduced in the early 1960s, and have
& Ruys, 2003; Law, 2000; Tsaur, Chiu, & Huang, 2002; Uysal & El Roubi, 1999). Artificial
neural network models are computer models that imitate the human pattern recognition
function (Chiang, Zhang, & Zhou, 2006; Hu et al., 2009). They do not require any restrictive
assumptions about the relationship between input and output variables. Moreover, they are
adaptive and can respond to structural changes in the data generation process in ways that
parametric models cannot and in most cases, they outperformed parametric models used in
statistical techniques such as correlation, regression and structural equation modelling
(Chiang et al., 2006; Deng et al., 2008; Garver, 2003; Hu et al., 2009).
Back-propagation neural network (BPNN) is one of the most commonly used artificial
neural network models (Hu et al., 2009). In the context of tourism demand forecast study,
Law (2000) show that BPNN outperforms regression models, time-series models, and
feed-forward neural networks in terms of forecasting accuracy. Researchers have recently used
BPNN in IPA studies, for example, Hu et al. (2009) employ BPNN to estimate attribute
importance in their case study of the computer industry in Taiwan.
Therefore, the Importance of each attribute is based on their respective BPNN
weightings. The structure of BPNN has three parts: one put layer, one or several hidden
layers, and one output layer, and based on a BPNN model that is completely trained,
importance of the input variable requested is used as the importance weights for the IPIA (Hu
et al., 2009). BPNN run in three steps, as suggested by Hu et al. (2009): (a). Set attribute
performance as the input variable at the input layer of BPNN and customer satisfaction as
output variable at the output layer for BPNN; (b) Step 2: Train and test the BPNN model; and
(c) Step 3: Obtain the impact of each attribute. The absolute weights of each attribute are the
Importance values in the IPIA framework.
Since the importance of customer self-expression cannot authentically render the
attribute thus overcoming the systematic bias found in traditional IPA methods. Further, it
reliably determines the quadrant thresholds providing meaningful interpretations of IPA
observations.
Measurement of Performance follows the conventional IPA approach, i.e. by using
scale means of observed ratings. This has the advantage of measuring and analyzing the IPA
dimensions independently. There is no hidden layer in performance or hidden performance
similar to hidden importance, therefore, the scale means of Performance attributes are
considered reliable.
Importance and Performance needs to be normalized in order to produce meaningful
comparisons. Data transformations to improve normality include square root transformation,
log transformation, inverse transformation, arcsine transformation and box-cox
transformation. The following formula was used to normalize numeric Importance values:
. Performance values were normalized with the inverse hyperbolic
function in order to produce the IPIA diagram.
IPIA Step 3: Measure and Normalize attributes Impact. Instead of relying on customer
surveys to allocate resources, we choose to have expert opinions on the impact of attributes
on resource allocation. Since this is a complex, multidimensional, decision making problem
that needs to produce a one-dimensional scale that prioritizes the inputted attribute set, we
choose to adopt a combination of DEMATEL and ANP methods. Responses from managers
were inputs of DEMATEL/ANP methods to produce an Impact ranking attributes taking into
account the interdependencies between the attributes and any structure that may exist among
the attributes.
Decision-making trial and evaluation laboratory (DEMATEL) method was originally
Geneva between 1972 and 1976 (Fontela & Gabus, 1976). DEMATEL method takes into
account the interrelations between attributes and divides the relevant attributes into cause and
effect groups in a visual structural map (Hu, Chiu, Cheng, & Yen, 2011; Tsai, Chou, & Lai,
2010). The method has been widely applied in a range of studies, including travel and
tourism, usually in combination with other Multiple Criteria Decision Making (MCDM)
methods, such as Analytic Network Process (ANP) method (e.g. Horng, Chou, Liu, & Tsai,
2013; Tsai, Chou, et al., 2010), whereas combination with other methods have also been used,
for example, Liu, Tzeng, and Lee (2012) employed the method in a different hybrid model
for improving national tourism policy implementation.
ANP is an extension of the analytic hierarchy process and it addresses the invalid
assumption of independence among attributes for prioritization decision making in analytic
hierarchy process (Saaty, 1980). The ANP has the advantage of being able to handle
dependence within a cluster of attributes (inner dependence) and among different clusters
(outer dependence), in addition to its nonlinear structure (Yang et al., 2008). ANP has been a
successful strategic decision support method, and has been used in a variety of industries
from manufacturing (e.g. Van Horenbeek & Pintelon, 2014) to services, which includes travel
and tourism (e.g. Tsai, Hsu, Chen, Lin, & Chen, 2010).
In a hybrid model of DEMATEL and ANP, the key interdependences of variable
clusters are obtained via DEMATEL, and the ANP algorithm determines the
interdependences between the clusters of variables (Yang et al., 2008). The hybrid model is
particularly suitable for solving the issues of with different degrees of effects among
attributes in a conventional IPA. The hybrid model has been widely used in a number of areas,
specifically for travel and tourism, in studies such as performance of national park websites
environment design (Horng et al., 2013). Data normalization was conducted in the same way
the other two attributes were normalized.
IPIA Step 4: Resource allocation analysis: Develop the IPIA Table and IPIA Matrix. The
Importance weights generated from BPNN, the Performance scale means of performance,
and the Impact attribute weights of DEMATEL/ANP for each attribute are presented in IPIA
Table, normalized, and depicted in the IPIA bubble Matrix to help resources allocation. The
IPIA Table is similar to IPA Table having one more column, that of Impact dimension. The
IPIA bubble Matrix is similar to IPA Matrix with Importance and Performance axes to
determine the four quadrants. We incorporate the Impact dimension by using the size of the
Empirical application: The case of an airline company in China
The case company is one of the ‘Big Four’ airlines in China, namely Air China, China
Eastern, China Southern and Hainan, which together accounted approximately 90% of the
domestic market share by capacity. According to the International Air Transport Association
(IATA, 2014), the case company was the world’s third largest airline among the 240 IATA
member airlines in 2013. The data used in this study include a survey of 298 customers of the
firm and an expert panel that includes ten of the company’s managers who are responsible for
marketing or passenger services.
IPIA Step 1
IPIA starts with the identification of key airline service attributes. Following the process of
service attribute selection as suggested by Oh (2001) and adopted in the prior studies (eg. G.
Lee & Lee, 2009), an initial list of 20 attributes was extracted from the extant literature, and
presented to four airline managers for discussion.
We select airline managers based on their experience and willingness to contribute to this
study. All managers had over 10 years working expertise in airline companies. The managers
were asked to select from the list of attributes that are essential for an airline to attract and
retain customers for creating a competitive edge in the market, and then group them into the
different categories, according to each attribute’s respective impact. The managers were told
that they could amend the attributes in the list or add new attributes as necessary. Since this is
a quantitative study and managers filled in the questionnaires, there were no qualitative
evidence collected or analysed.
IPIA Step 2
Passenger survey was conducted using a web-based questionnaire. The rationale of using
e-ticketing and online check-in for airline services. Participants were invited to participate in
the survey through an introduction message and a link posted in two large nation-wide air
traveler community websites. Online travel community members are more willing to
participate in web-based survey, as they often have a high level of interest in travel surveys
because of their strong desire to improve their travel experience (Van Selm & Jankowski,
2006). The item wording and measurements in the questionnaire are similar to those
commonly used in industry customer satisfaction surveys (Mittal & Kamakura, 2001).
Respondents were asked to rate their perception of their frequently traveled airline
along the ten service attributes, anchored on a 5-point scale (where 0=very poor, and
5=excellent). Their overall satisfaction of the airline was based on an 11-point scale by
answering to the question ‘based on your overall travel experience, how would you rate your
satisfaction with this airline?’ (where 0 = extremely dissatisfied, and 10 = extremely
satisfied). The survey site went live for about 3 months and during this period, the site
received 2,640 visits, with 824 survey responses, generated a response rate of 31%. Seven of
the responses were incomplete and excluded from further analysis, thus the valid sample size
is 817, which include customers of all the major airlines in China. For IPIA illustration
purpose, we selected the sample of the case company’s customers only, which include 298
responses for data analysis. Within this sample, 56% of them are business travelers; 78% of
them have one or more FFP cards; 83% of them male; 91% of them have a university degree
or above; 54% of them were in the high income bracket (annual income over 10K Chinese
Yuan).
IPIA Step 3
A panel survey of managers’ perceptions is used to assess the impact of the attributes in
2011; Hu et al., 2009; Huang, Wu, & Hsu, 2006). The four managers participating in the
discussion of service attribute selection invited their colleagues in their own and other airlines
to join the manager panel. The panel consisted of twenty-two managers responsible from
their airlines’ sales, passenger services or marketing tasks. All members in the sample had a
bachelor’s degree or above. Twenty-five participants in the manager survey represented four
of the major airlines in the country: Air China, China Southern, Xiamen Airlines, and Hainan
Airlines. We selected the data contributed by the 10 managers of the case company for
analysis.
IPIA Step 4
The IPIA Matrix and IPIA Table were developed and are presented in the next section that
Findings
IPIA Step 1: Attributes structure
Following a discussion with the airline managers, we produced a final list of 10 items which
were organized along the three categories of factors: basic factors (safety, punctuality,
comfortable aircraft, and frequent flyer program or FFP), performance factors (frequency of
flights, schedule, and price) and excitement factors (in-flight food and drinks, and in-flight
staff service).
Findings - IPIA Step 2: Measurement of Importance and Performance
We run BPNN to obtain the values of attribute importance using customer responses as the
input to the BPNN model. The learning rate and momentum were both set at 0.7, and
decreased as training proceeds; and the process was set to terminate at 100,000 cycles. The
training sample used 151 cases (approx.50%) randomly selected from the dataset and
validating sample used the remaining 147 cases. The results show that the mean absolute
percentage error (MAPE) was 0.019 (with a maximum of 0.32 and minimum of 0.00),
indicating a good model fit (Hu et al., 2009). The key important attributes are reputation
(0.18), punctuality (0.16), price (0.15) and safety.
IPIA Step 3: Measurement of the Impact
The panel consisted of ten managers responsible from their airlines’ sales, passenger services
or marketing tasks. The sample’s tenure in the management position ranged from 3 years to
over 20 years, with a median of 7 years. Two of the respondents were in senior-level
management, five were in middle-level, management, and the remaining three were in
frontline supervisory positions. The median age of the participants was 35 years old, with a
The interdependent relationships of ten airline attributes were analyzed by applying
DEMATEL and ANP. Among the ten attributes, both Excitement factors are the most
important ones: In-flight services (weight 0.54), and In-flight food (weight 0.46). The score
of weights refer to the membership of the cluster but the limiting value does not change the
rank of attributes. High in priority the following airline attributes were also ranked: Airline
reputation (weight 0.36), safety (0.27), punctuality (0.26), flight schedule (0.26) and frequent
flyer program (0.25). The lowest priority received the attributes: frequency of flights (0.18),
ticket price (0.20), and conformable aircraft (0.22). The detailed results of the DEMATEL
and ANP are presented in Appendix1-7.
IPIA Step 4: IPIA Table and IPIA Matrix
The weights of Performance, Importance and Impact were presented in Table 1, IPIA Table
depicted in Figure 3, the IPIA Matrix. According to data included in IPIA Table, airline
reputation had the highest valued in all three attributes, indicating a right balance of allocated
resources and customer satisfaction. Punctuality and ticket price had high Importance values
but Performance was relatively low, indicating a need to concentrate on these two attributes.
The reported Impact was low for both punctuality and ticket price, yet punctuality had a
higher Impact value than ticket price which indicates that airlines requires more resources to
achieve punctuality in their flights while ticket price reflects the strategic orientation and
business operations of the specific company. Therefore, the company needs to concentrate on
both punctuality and ticket price with a higher priority on punctuality. Although managers’
priority is right, given the punctuality is a ‘basic’ factor, managers are advised to improve its
performance if resources are available.
[Table1 about here]
In-flight service, safety, frequent flyer program, and frequency of flights were attributes
with low importance but high performance, which may indicate that more resources have
been allocated to them than customer satisfaction requires. Among these attributes, only
in-flight service had a high Impact value which indicates that airline puts too much emphasis on
it and needs to remove attention to other priorities. Attributes with low Impact and low
Importance often are either overlooked by managers or get more resources allocated than
needed. In-flight food and drink received a high Impact from managers, yet Importance and
Performance were low, indicating that management might spend too much time on this
attribute, overlooking other priorities. The rankings of aircraft comfort were low across all
the three dimensions. Therefore, the company may maintain the current position and improve
it when resources are available. However, due to the large capital investment in aircraft fleet,
Conclusion
Conventional IPA studies have received criticisms regarding methodological and conceptual
shortcomings. A stream of research has developed improved IPA models and suggested a
number of improvements over the original IPA method. This study proposes a novel
analytical framework to strategically prioritize resources allocation to achieve optimal level
of customer satisfaction: the Importance-Performance-Impact Analysis (IPIA). The
framework was empirically applied in an airline company in China. In so doing, this study
has the following three contributions:
Theoretical contributions: Scholars also argued that using Importance as a proxy of customer expectations (Oh, 2001) cannot authentically render the relative importance of
quality features, particularly for the tourist sector that culture mediate expectations and
experience. In this study, we used advanced neural network method (BPNN) to increase the
validity of Importance construct to evaluate the relative importance of quality attributes.
Another conceptual limitation of conventional IPA is the reliability of ‘Performance’
dimension. Restricting Performance measurement across only the Importance attributes
would mislead resource allocation decisions. To overcome this shortcoming, we took two
steps. First, we incorporated the 3-factor model with IPA to create a structure among
attributes (IPIA Step 1). The relation between attributes and resource allocation are far from
being linear and the often complex relation between attributes and operation processes
requires multi-dimensional decision making tools to solve complex resource allocation
problems. This study used DEMATEL/ANP (IPIA Step 3) that takes into account the
structure of attributes (Figure 2). Secondly, we expand the IPA boundaries by including
Impact into analysis. Triangulating two or more sources of evidence (customers, managers)
increases the reliability of Performance and Impact attributes.
Methodological contributions: IPIA takes advantage of statistical power of techniques, such as Back Propagation Neural Network (BPNN), Decision Making Trial and Evaluation
Laboratory (DEMATEL) and Analytic Network Process (ANP) in order to estimate attribute
values. IPIA Table and IPIA Matrix present attribute values in ways that facilitate resource
the industry over time. The IPIA method inherits the strengths of conventional IPA: the
results are simple to interpret and to easily applicable in strategic resource allocation decision
making. In addition, as the values of attribute importance are derived from performance
measures, eliminating the needs to set questions for measuring the importance of attributes,
customer survey questionnaire is thus greatly simplified.
Practical contributions: IPIA presents resource allocation with two tools: IPIA Table and IPIA Matrix. Both tools include more information than conventional IPA that help manager
to allocate resources to achieve optimal level of customer satisfaction. The inclusion of
Impact values help manager to discriminate between high and low Impact attributes that are
in the same IPIA quadrant. This is easily depicted in the IPIA bubble Matrix that visualizes
the impact as the size of each attribute.
The empirical application of IPIA in examining the service of an airline company in China
confirms that IPIA outperforms conventional IPA. For example, Punctuality had a higher
Impact value than Ticket price which indicates that the airline would require more resources
to achieve Punctuality in their flights. The IPIA Table as well as the IPIA Matrix are useful
tools to interpret results and create operational priorities regarding allocation of resources
based on their impact on customer satisfaction.
Limitations and further research
There are several limitations associated with this study, which introduce further research
opportunities. Although IPIA triangulates data from different sources of customers and
managers thus improves the validity of the study compared to traditional IPA method, our
customer data were collected from a cross-sectional survey and the expert panel consisted of
a limited number of managers. We suggest future IPIA studies to maintain the current
research design and take advantage of more data sources such as retail audits and wider
expert panels. We also recommend future studies to apply IPIA method in other industries
and countries which would generate a basis for cross-validation of the model. Customer
satisfaction was used as an outcome variable in BPNN model as in conventional IPA, and
as these variables incorporates customers’ consideration of competitive offers and costs
References
Alegre, J., & Garau, J. (2011). The factor structure of tourist satisfaction at sun and sand destinations. Journal of Travel Research, 50(1), 78-86.
Arbore, A., & Busacca, B. (2011). Rejuvenating importance-performance analysis. Journal of Service Management, 22(3), 409-429.
Arif, M., Gupta, A., & Williams, A. (2013). Customer service in the aviation industry–An exploratory analysis of UAE airports. Journal of Air Transport Management, 32, 1-7. Azzopardi, E., & Nash, R. (2013). A critical evaluation of importance–performance analysis.
Tourism Management, 35(April), 222-233.
Bacon, D. R. (2003). A comparison of approaches to importance-performance analysis. International Journal of Market Research, 45(1), 55-72.
Bacon, D. R. (2012). Understanding priorities for service attribute improvement. Journal of Service Research, 15(2), 199-214.
Brown, S. W., & Swartz, T. A. (1989). A gap analysis of professional service quality. Journal of Marketing, 53(2), 92-98.
Caber, M., Albayrak, T., & Loiacono, E. T. (2013). The classification of extranet attributes in terms of their asymmetric influences on overall user satisfaction: An introduction to Asymmetric Impact-Performance Analysis. Journal of Travel Research, 52(1), 106-116.
Chen, F.-H., Hsu, T.-S., & Tzeng, G.-H. (2011). A balanced scorecard approach to establish a performance evaluation and relationship model for hot spring hotels based on a hybrid MCDM model combining DEMATEL and ANP. International Journal of Hospitality Management, 30(4), 908-932.
Chiang, W.-y. K., Zhang, D., & Zhou, L. (2006). Predicting and explaining patronage behavior toward web and traditional stores using neural networks: a comparative analysis with logistic regression. Decision Support Systems, 41(2), 514-531.
Deng, W.-J. (2007). Using a revised importance–performance analysis approach: The case of Taiwanese hot springs tourism. Tourism Management, 28(5), 1274-1284.
Deng, W.-J., Chen, W.-C., & Pei, W. (2008). Back-propagation neural network based importance–performance analysis for determining critical service attributes. Expert Systems with Applications, 34(2), 1115-1125.
Deng, W.-J., & Pei, W. (2009). Fuzzy neural based importance-performance analysis for determining critical service attributes. Expert Systems with Applications, 36(2), 3774-3784.
Fontela, E., & Gabus, A. (1976). The DEMATEL Observer: Battelle Institute, Geneva Research Center.
Fu, X., Zhang, A., & Lei, Z. (2012). Will China’s airline industry survive the entry of high -speed rail? Research in Transportation Economics, 35(1), 13-25.
Garver, M. S. (2003). Best practices in identifying customer-driven improvement opportunities. Industrial Marketing Management, 32(6), 455-466.
Geng, X., & Chu, X. (2012). A new importance–performance analysis approach for customer satisfaction evaluation supporting PSS design. Expert Systems with Applications, 39(1), 1492-1502.
Horng, J.-S., Chou, S.-F., Liu, C.-H., & Tsai, C.-Y. (2013). Creativity, aesthetics and eco-friendliness: A physical dining environment design synthetic assessment model of innovative restaurants. Tourism Management, 36(June), 15-25.
Hu, H.-Y., Chiu, S.-I., Cheng, C.-C., & Yen, T.-M. (2011). Applying the IPA and
network communication equipment manufacturing industry. Expert Systems with Applications, 38(8), 9674-9683.
Hu, H.-Y., Lee, Y.-C., Yen, T.-M., & Tsai, C.-H. (2009). Using BPNN and DEMATEL to modify importance–performance analysis model–A study of the computer industry. Expert Systems with Applications, 36(6), 9969-9979.
Huang, Y.-C., Wu, C.-H., & Hsu, C. J. (2006). Using importance-performance analysis in evaluating Taiwan medium and long distance national highway passenger
transportation service quality. Journal of American Academy of Business, 8(2), 98-104.
Hughes, K., Bond, N., & Ballantyne, R. (2013). Designing and managing interpretive
experiences at religious sites: Visitors' perceptions of Canterbury Cathedral. Tourism Management, 36(June), 210-220.
IATA. (2013). IATA Annual Review International Air Transport Association, Vol. 2013. Retrieved from www.iata.org
IATA. (2014). News Brief: Tracking Airline Industry Performance in 2013 - World Air Transport Statistics Released. http://www.iata.org/pressroom/pr/Pages/2014-08-12-01.aspx
Kim, J., Wei, S., & Ruys, H. (2003). Segmenting the market of West Australian senior tourists using an artificial neural network. Tourism Management, 24(1), 25-34. Krepapa, A., Berthon, P., Webb, D., & Pitt, L. (2003). Mind the gap: an analysis of service
provider versus customer perceptions of market orientation and the impact on satisfaction. European Journal of Marketing, 37(1/2), 197-218.
Kumar, P. (2002). The impact of performance, cost, and competitive considerations on the relationship between satisfaction and repurchase intent in business markets. Journal of Service Research, 5(1), 55-68.
Kuo, Y.-F., Chen, J.-Y., & Deng, W.-J. (2012). IPA–Kano model: A new tool for
categorising and diagnosing service quality attributes. Total Quality Management & Business Excellence, 23(7-8), 731-748.
Lai, I. K. W., & Hitchcock, M. (2015). Importance–performance analysis in tourism: A framework for researchers. Tourism Management, 48(0), 242-267.
Law, R. (2000). Back-propagation learning in improving the accuracy of neural network-based tourism demand forecasting. Tourism Management, 21(4), 331-340.
Lee, G., & Lee, C.-K. (2009). Cross-cultural comparison of the image of Guam perceived by Korean and Japanese leisure travelers: Importance–performance analysis. Tourism Management, 30(6), 922-931.
Lee, H.-S. (2015). Measurement of visitors' satisfaction with public zoos in Korea using importance-performance analysis. Tourism Management, 47(0), 251-260.
Liu, C.-H., Tzeng, G.-H., & Lee, M.-H. (2012). Improving tourism policy implementation – The use of hybrid MCDM models. Tourism Management, 33(2), 413-426.
Martilla, J. A., & James, J. C. (1977). Importance-performance analysis. Journal of Marketing, 41(1), 77-79.
Matzler, K., Bailom, F., Hinterhuber, H. H., Renzl, B., & Pichler, J. (2004). The asymmetric relationship between attribute-level performance and overall customer satisfaction: a reconsideration of the importance–performance analysis. Industrial Marketing Management, 33(4), 271-277.
Mikulić, J., & Prebežac, D. (2012). Accounting for dynamics in attribute-importance and for competitor performance to enhance reliability of BPNN-based importance–
performance analysis. Expert Systems with Applications, 39(5), 5144-5153. Mittal, V., & Kamakura, W. A. (2001). Satisfaction, repurchase intent, and repurchase
behavior: investigating the moderating effect of customer characteristics. Journal of Marketing Research, 38(1), 131-142.
O’Leary, S., & Deegan, J. (2005). Ireland’s image as a tourism destination in France: Attribute importance and performance. Journal of travel research, 43(3), 247-256. Oh, H. (2001). Revisiting importance–performance analysis. Tourism Management, 22(6),
617-627.
Pan, F. C. (2015). Practical application of importance-performance analysis in determining critical job satisfaction factors of a tourist hotel. Tourism Management, 46(0), 84-91. Ryan, C., & Huyton, J. (2002). Tourists and aboriginal people. Annals of Tourism Research,
29(3), 631-647.
Saaty, T. L. (1980). The analytic hierarchy process: planning, priority setting, resources allocation. New York: McGraw-Hill.
Sever, I. (2015). Importance-performance analysis: A valid management tool? Tourism Management, 48, 43-53.
Shaw, S.-L., Lu, F., Chen, J., & Zhou, C. (2009). China’s airline consolidation and its effects on domestic airline networks and competition. Journal of Transport Geography, 17(4), 293-305.
Sheng, X., Simpson, P. M., & Siguaw, J. A. (2014). U. S. winter migrants' park community attributes: An importance–performance analysis. Tourism Management, 43(0), 55-67. Tsai, W.-H., & Chou, W.-C. (2009). Selecting management systems for sustainable
development in SMEs: A novel hybrid model based on DEMATEL, ANP, and ZOGP. Expert Systems with Applications, 36(2), 1444-1458.
Tsai, W.-H., Chou, W.-C., & Lai, C.-W. (2010). An effective evaluation model and
improvement analysis for national park websites: A case study of Taiwan. Tourism Management, 31(6), 936-952.
Tsai, W.-H., Hsu, J.-L., Chen, C.-H., Lin, W.-R., & Chen, S.-P. (2010). An integrated
approach for selecting corporate social responsibility programs and costs evaluation in the international tourist hotel. International Journal of Hospitality Management, 29(3), 385-396.
Tsaur, S.-H., Chiu, Y.-C., & Huang, C.-H. (2002). Determinants of guest loyalty to
international tourist hotels—a neural network approach. Tourism Management, 23(4), 397-405.
Uysal, M., & El Roubi, M. S. (1999). Artificial neural networks versus multiple regression in tourism demand analysis. Journal of Travel Research, 38(2), 111-118.
Van Horenbeek, A., & Pintelon, L. (2014). Development of a maintenance performance measurement framework—using the analytic network process (ANP) for maintenance performance indicator selection. Omega, 42(1), 33-46.
Van Selm, M., & Jankowski, N. W. (2006). Conducting online surveys. Quality and Quantity, 40(3), 435-456.
Wang, Y.-L., & Tzeng, G.-H. (2012). Brand marketing for creating brand value based on a MCDM model combining DEMATEL with ANP and VIKOR methods. Expert Systems with Applications, 39(5), 5600-5615.
Yang, Y.-P. O., Shieh, H.-M., Leu, J.-D., & Tzeng, G.-H. (2008). A novel hybrid MCDM model combined with DEMATEL and ANP with applications. International Journal of Operations Research, 5(3), 160-168.
Table1. The IPIA Table
Attributes Importance
(BPNN)
Performance (Scale means)
Impact (DEMATEL+ANP)
Management recommendations
Reputation 0.18 High 3.83 High 0.36 High Right balance, maintain resources
Punctuality 0.16 High 3.49 Low 0.26 Low Concentrate here
Ticket price 0.15 High 3.28 Low 0.20 Low Concentrate here
In-flight service 0.05 Low 3.61 High 0.54 High
Re-locate resources to other customer needs to address
impact
Safety 0.10 Low 3.96 High 0.27 Low recover resources to other priorities
Frequent flyer plan 0.09 Low 3.71 High 0.25 Low recover resources to other priorities
Schedule 0.07 Low 3.71 High 0.26 Low recover resources to other priorities
Frequency of flights 0.05 Low 3.67 High 0.18 Low recover resources to other priorities
In-flight food 0.08 Low 3.26 Low 0.46 High Divert attention to other priorities
Aircraft comfort 0.07 Low 3.51 Low 0.22 Low Right balance, could be improved
Min & Max, Average 0.05-0.18; 0.10 3.26-3.96; 3.60 0.18-0.54; 0.30
Overall, reputation is high, yet company needs to
focus on punctuality and ticket price rather than
High
Importance
Quadrant 1.
Concentrate here
Quadrant 2.
Keep up the good work
Low High
Performance Performance
Quadrant 3.
Low priority
Quadrant 4.
Possible overkill
Low
[image:30.595.144.450.116.457.2]Importance
APPENDICES
Appendix 1. The direct-influence matrix A.
Ticket price
Flight schedule
Frequency of flight
Inflight
services FFP Punctuality
Comfortable
aircraft Safety
Airline reputation
Inflight food &drinks
Zi
Ticket price NA 5 5 6 5 5 4 4 4 6 43
Flight schedule 6 NA 7 7 6 5 5 4 6 7 55
Frequency of
flight 6 6 NA 6 6 5 5 4 5 6 49
Inflight
services 4 4 4 NA 4 3 4 2 4 6 35
FFP 4 5 6 5 NA 5 5 2 4 6 42
Punctuality 6 7 7 8 8 NA 7 4 6 7 59
Comfortable
aircraft 6 5 6 7 6 4 NA 3 6 7 50
Safety 8 8 8 8 8 8 8 NA 7 8 71
Airline
reputation 5 5 6 6 7 5 5 4 NA 6 48
Inflight food
&drinks 3 4 4 4 6 3 4 2 4 NA 33
Appendix 2. The total-influence matrix T. Factors Ticket
price Flight schedule Frequency of flight Inflight services Frequent
flyer Punctuality
Comfortable
aircraft Safety
Airline reputation Inflight food &drinks Ticket price 0.1228
0.1933 0.1998 0.2201 0.2104 0.1640 0.1687 0.1245 0.1814 0.2227
Flight
schedule 0.2308 0.1514 0.2542 0.2765 0.2557 0.1982 0.2147 0.1464 0.2363 0.2741
Frequency of
flight 0.2185 0.2157 0.1507 0.2469 0.2363 0.1772 0.1955 0.1391 0.2103 0.2420
Inflight
services 0.1462 0.1509 0.1637 0.1172 0.1648 0.1214 0.1434 0.0939 0.1550 0.1905
Frequent
flyer 0.1779 0.1812 0.2105 0.2124 0.1371 0.1606 0.1775 0.1076 0.1782 0.2186
Punctuality
0.2421 0.2477 0.2654 0.2910 0.2816 0.1374 0.2389 0.1514 0.2466 0.2825 Comfortable
aircraft 0.2141 0.1993 0.2254 0.2523 0.2372 0.1726 0.1316 0.1288 0.2208 0.2525
Safety
0.2956 0.2962 0.3193 0.3424 0.3290 0.2674 0.2897 0.1225 0.2906 0.3373 Airline
reputation 0.1966 0.2012 0.2213 0.2440 0.2396 0.1777 0.1984 0.1331 0.1362 0.2330
Inflight food
Appendix 3. The sum of influences of factors
Category Attributes D R
D+R
Prominence
D-R
Relation
Performance factor Ticket price
1.81 1.98 3.79 -0.18 Performance factor Flight schedule
2.24 1.98 4.22 0.26 Performance factor Frequency of flight
2.03 2.16 4.19 -0.13 Performance factor Airline reputation
1.45 2.37 3.82 -0.92
Basic factor Frequent flyer program
1.76 2.27 4.03 -0.51
Basic factor Punctuality
2.38 1.69 4.07 0.69
Basic factor Comfortable aircraft
2.03 1.90 3.94 0.13
Basic factor Safety
2.89 1.23 4.12 1.66 Excitement factor Inflight food
1.98 2.00 3.99 -0.02 Excitement factor Inflight services
Appendix 5. Un-weighted Supermatrix
Groups Factors
1. Basic factors 2. Performance factors 3. Excitement factors
Safety Punctuality
Comfortable
aircraft FFP
Frequency of flight
Flight
schedule Ticket price
Airline reputation Inflight food & drinks Inflight services 1. Basic factors
Safety 0.171 0.272 0.260 0.256 0.243 0.248 0.234 0.247 0.232 0.240
Punctuality
0.321 0.213 0.331 0.321 0.295 0.300 0.297 0.291 0.302 0.295
Comfortable
aircraft 0.304 0.303 0.196 0.287 0.272 0.268 0.271 0.276 0.269 0.260
FFP
0.204 0.212 0.213 0.136 0.190 0.184 0.199 0.186 0.198 0.205
2.
Performance factors
Frequency of
flight 0.191 0.196 0.206 0.193 0.139 0.218 0.212 0.211 0.190 0.200
Flight schedule
0.260 0.268 0.260 0.265 0.286 0.186 0.285 0.297 0.263 0.259
Ticket price
0.230 0.216 0.221 0.230 0.241 0.234 0.157 0.252 0.236 0.231
Airline
reputation 0.318 0.320 0.313 0.312 0.334 0.362 0.346 0.240 0.310 0.309
3. Excitement factors
Inflight food &
drinks 0.587 0.588 0.594 0.594 0.571 0.610 0.583 0.619 0.478 0.677
Inflight services
Appendix 6. Weighted Supermatrix
Groups Factors
1. Basic factors 2. Performance factors 3. Excitement factors
Safety Punctuality
Comfortable
aircraft FFP
Frequency of flight
Flight
schedule Ticket price
Airline reputation Inflight food & drinks Inflight services 1. Basic factors Safety
0.057 0.091 0.087 0.085 0.081 0.083 0.078 0.082 0.077 0.080
Punctuality
0.107 0.071 0.110 0.107 0.098 0.100 0.099 0.097 0.101 0.098
Comfortable
aircraft 0.101 0.101 0.065 0.096 0.091 0.089 0.090 0.092 0.090 0.087
FFP
0.068 0.071 0.071 0.045 0.063 0.061 0.066 0.062 0.066 0.068
2.
Performance factors
Frequency of
flight 0.064 0.065 0.069 0.064 0.046 0.073 0.071 0.070 0.063 0.067
Flight schedule
0.087 0.089 0.087 0.088 0.095 0.062 0.095 0.099 0.088 0.086
Ticket price
0.077 0.072 0.074 0.077 0.080 0.078 0.052 0.084 0.079 0.077
Airline
reputation 0.106 0.107 0.104 0.104 0.111 0.121 0.115 0.080 0.103 0.103
3. Excitement factors
Inflight food &
drinks 0.196 0.196 0.198 0.198 0.190 0.203 0.194 0.206 0.159 0.226
Inflight services
Appendix 7. Limit Supermatrix
Groups Factors
1. Basic factors 2. Performance factors 3. Excitement factors
Safety Punctuality
Comfortable
aircraft FFP
Frequency of flight
Flight
schedule Ticket price
Airline reputation Inflight food & drinks Inflight services 1. Basic factors
Safety 0.080 0.080 0.080 0.080 0.080 0.080 0.080 0.080 0.080 0.080
Punctuality 0.098 0.098 0.098 0.098 0.098 0.098 0.098 0.098 0.098 0.098
Comfortable
aircraft 0.090 0.090 0.090 0.090 0.090 0.090 0.090 0.090 0.090 0.090
FFP 0.065 0.065 0.065 0.065 0.065 0.065 0.065 0.065 0.065 0.065
2.
Performance factors
Frequency of
flight 0.066 0.066 0.066 0.066 0.066 0.066 0.066 0.066 0.066 0.066
Flight schedule 0.088 0.088 0.088 0.088 0.088 0.088 0.088 0.088 0.088 0.088
Ticket price 0.076 0.076 0.076 0.076 0.076 0.076 0.076 0.076 0.076 0.076
Airline
reputation 0.105 0.105 0.105 0.105 0.105 0.105 0.105 0.105 0.105 0.105
3. Excitement factors
Inflight food &
drinks 0.195 0.195 0.195 0.195 0.195 0.195 0.195 0.195 0.195 0.195