EVALUATING CHANGES IN THE ELEMENTAL COMPOSITION OF MICROMETEORITES DURING ENTRY
INTO THE EARTH
’
S ATMOSPHERE
N. G. Rudraswami1, M. Shyam Prasad1, S. Dey1,2, J. M. C. Plane3, W. Feng3, and S. Taylor4 1
National Institute of Oceanography(Council of Scientific and Industrial Research), Dona Paula, Goa 403004, India;[email protected]
2
Indian Institute of Technology, Roorkee, Uttarakhand 247667, India 3
School of Chemistry, University of Leeds, Leeds LS2 9JT, UK 4
Cold Regions Research and Engineering Laboratory, 72 Lyme Road, Hanover, NH 03755-1290, USA Received 2015 August 19; accepted 2015 October 17; published 2015 November 17
ABSTRACT
We evaluate the heating of extraterrestrial particles entering the atmosphere using the comprehensive chemical ablation model (CABMOD). This model predicts the ablation rates of individual elements in a particle with a defined size, composition, entry velocity, and entry angle with respect to the zenith(ZA). In the present study, bulk chemical analyses of 1133 Antarctica micrometeorites (collected from the south pole water well)are interpreted using CABMOD. The marked spread in Fe/Si values in unmelted, partially melted, and melted micrometeorites is explained by the loss of relatively volatile Fe during atmospheric entry. The combined theoretical modeling and elemental composition of the micrometeorites(Mg/Si ratios)suggest that∼85% of particles have a provenance of carbonaceous chondrites, the remaining ∼15% are either ordinary or enstatite chondrites. About 65% of the micrometeorites have undergone <20% ablation, while a further 20% have lost between 20% and 60% of their original mass. This has implications for understanding the micrometeoriteflux that reaches the Earthʼs surface, as well as estimating the pre-atmospheric size of the particles. Our work shows that the unmelted particles thatcontribute∼50% to the total micrometeorite collection on Earthʼs surface have a small entry zone: ZA=60°– 90°if the entry velocity is∼11 km s−1, and ZA=80°–90°for>11–21 km s−1.
Key words:atmospheric effects–Earth–interplanetary medium–meteorites, meteors, meteoroids–Sun: general
1. INTRODUCTION
The extraterrestrial dust entering the Earthʼs atmosphere
(∼30,000–40,000 t yr−1) is produced from comets and aster-oids,and is a unique source of information on the formation processes of the early solar system (Love & Brownlee 1993; Peucker-Ehrenbrink & Ravizza2000; Plane2012). The size of most of the dust ranges from a few μm to a few mm. A significant aspect of micrometeorite studies is that some of these particles may have sampled unfamiliar asteroids that are not represented in our meteorite collection (Yada et al. 2005; Gounelle et al. 2009). The dust particles are anticipated to originate predominantly in the asteroid belt anddrift further -into the inner solar system with a large probability of getting trapped in orbital resonance with Earth due to their smaller orbital eccentricities compared to cometary particles (Dermott et al.1994; Reach et al.1997; Brownlee2001, pp. 1–12). There is some noteworthy contribution from the cometary bodies based onInfrared Astronomical Satellite(IRAS)data, although the IRAS evidence is not very clear to allow us toarrive at accurate estimates (Dermott et al. 1994, 1996). Similarly, cosmic background explorer observations suggested trapping asteroidal dust dominantly, making cometary dust insignificant
(Kortenkamp et al.2001, pp. 13–30). The numerical model by Kortenkamp & Dermott (1998) estimated that∼25% of dust reaching Earth is contributed by comets. Nesvorný et al.
(2010,2011)suggested that comets from theJupiter family are a major source of dust particles and contribute>80% of dust flux arriving at the Earth, in contradiction to above estimates. In any circumstance, estimating the exact contribution of the asteroidal and cometary reservoirs to the total flux is challenging. The low orbital eccentricities of asteroidal dust compared to those of higher eccentricities of cometary dust gives an advantage of greater gravitational capture cross section
to asteroidal particles, making themthe largest contributor of extraterrestrial dust, probably followed by cometary dust
(Flynn 1989b; Kortenkamp & Dermott 1998). The cometary particles traveling at higher velocities encounter a small amount gravitational capture than their counterpart asteroidal particles
(Flynn1989b; Brownlee 2001). However, it is worthwhile to note that the cometary particles trapped in resonance with Jupiter will have similar behaviorto that of asteroid dust particles(Kortenkamp et al.2001, pp. 13–30).
The bulk chemical composition of a meteoroid can change because of the rapid heating it experiences during atmospheric entry. Besides a relatively small loss of matter through sputtering with air molecules, the particleʼs temperature may reach its melting point and then lose a much larger fraction of mass through evaporation. Both of these processes are described by the term “ablation”(Vondrak et al. 2008). The degree of elemental change depends on the range of the heating event it undergoes, which in turn depends on the density, mass, chemical composition, entry velocity, and entry zenith angle
elemental ratios as a function of entry parameters. The chemical and mineralogical compositions of 1133 Antarctic micrometeorites will then be examined in order to infer the degree of mass loss and compositional alteration experienced during atmospheric entry, and hence the nature of the particles pre-entry.
2. SAMPLE COLLECTIONS
The samples were collected in 2000 from the South Pole Water Well (SPWW) at a depth of∼100 m below the snow surface. This meltwater well had a diameter of∼24 m, a depth of ∼15 m, and a water volume of ∼5000 m3 (Taylor et al.
1998,2000). The micrometeorites collected from this well were dated to between 1100 and 1500 AD(Taylor et al.1998). The polar ice offers a pristine environment for micrometeorite collectionwhere the melt water is filtered and thefiltrates are examined for micrometeorites. Contaminants are very few in this environment and the compressed ice also provides a pre-concentration of the extraterrestrial particles from the large volumes of ice melted. The polar samples are better preserved and therefore less weathered compared to deep sea micro-meteorite collections. The samples collected in different size ranges above 50μm were sieved into various size fractions
(Taylor et al. 1998). Using a binocular microscope, ∼1200 particles were sorted, mounted in epoxy, and polished for further study using a scanning electron microscope and electron microprobe. There are standard parameters for the identification of extraterrestrial particulate matter identified over a period of time(Blanchard et al.1980; Brownlee et al.1997; Taylor et al.
2000 and Genge et al. 2008): spherical morphology or even non-spherical and irregular shapes for unmelted particles, the presence of magnetite rims due to entry heating, Fe–Ni bead, platinum group nuggets, Mg-rich relict olivines, the formation of vesicles, chemical composition, elemental ratios, miner-alogical properties, and the absence of terrestrially abundant elements. The classification of the micrometeorites is based on the textures and mineralogical composition as suggested in Genge et al.(2008).
3. ANALYTICAL TECHNIQUES
Back-scattered electron(BSE)images of the polished epoxy-mounted and carbon-coated micrometeorites were obtained using a JEOL JSM 5800LV SEM with an OXFORD INCA Energy Dispersive Spectrometer detector(EDS, ISIS-300 at the National Institute of Oceanography, Goa). The image is useful for classifying and identifying the proper phases for chemical analyses using a Cameca SX5 Electron Micro Probe Analyzer
(at the National Institute of Oceanography, Goa)equipped with four spectrometers. The elemental compositions determined in the micrometeorites were Na, Mg, Si, Al, P, K, Ca, Ti, Cr, Mn, Fe, and Ni. The operating conditions used were as follows: accelerating voltage:∼15 kV, beam current∼12 nA, and beam diameter of ∼1–2μm. The data are corrected using the PAP model (Pouchou & Pichoir 1991, pp. 31–75). The analytical totals are less than 100% in some micrometeorites, whichcan be due to multiple reasons. The presence of the hydrous phases or porous contents, sub-micron void spaces, and cracks result in analytical deficiencies. However, care is taken by carrying out multiple analyses on the same spot. In any case, a small deviation from 100% can be considered to be within the permissible limits of the instrument analytical capabilities.
4. ABLATION MODEL DESCRIPTION
CABMOD(Vondrak et al. 2008)uses the classical physics equations to describe the time dependence of the meteoroid energy and velocity. The model includes sputtering by collision with air molecules before the particle melts, followed by Langmuir evaporative loss of metal atoms and oxides from the molten particles (treated by the thermodynamic model MAGMA)as a function of altitude(Schaefer & Fegley2005). Particles are considered to be a single phase with a density of 2 g cm−3, with a CI composition taken from multiple sources
(Mason 1971; Sears & Dodd 1988, pp. 3–31; Lodders & Fegley 1998). The fact that the fundamental properties of density for the majority of unmelted extraterrestrial particles havebeen suggested to be 2 g cm−3, which is similar to that of the CI chondrites, suggests that the particle are primitive(Love et al.1994). In addition, the major element compositions of the micrometeorites studied by various groups are close to CI composition (e.g., Brownlee et al. 1997; Taylor et al. 2000; Prasad et al.2013).Therefore, the CI chondrites with a density of 2 g cm−3is an appropriate choice for the model calculation based on observations on the large population of micrometeor-ites by many investigators.
In the present study, we use CABMOD to quantify the elemental composition changes that particles undergo as a function of particle diameter, velocity, and ZA. Differing combinations of these variables can produce similar composi-tional changes. For those particles with a size range from 100 to few hundredμm, the maximum entry velocity for a majority of the particles to survive atmospheric entry is∼16 km s−1. The choice of this size is based on the population of the micrometeorites studied (e.g., Taylor et al. 2000; Prasad et al. 2013). If the velocity of the particle goes beyond 16 km s−1, the ablation can surpass∼70%(Table1). However, for particles less than 100μm in size, there is greater chance of survival even at higher velocities. For the present study, we have used the following boundary conditions: entry velocity of
16 km s−1, peak temperature the particle can attain during entry to<2000 K, sizes ranging from∼100μm to few hundred
μm across, and ZAs of∼45°–90°. Love & Brownlee (1991)
suggested that the increase in mass loss with increasing temperature reaches a zenith at 2000 K, which is suggested as the practical upper limit that any particle can reach during atmospheric entry. Even if a particle survives beyond this temperature, its chemical composition deviates due to large-scale vaporization and tends to lose its characteristic features such as elemental ratios that are crucial for the identification of precursors. Most of the micrometeorites recovered have sizes in the range of 100 to few hundred μm. However, model calculation suggests thatZA ∼0°–45° will experience large heating and ablation depending on the velocity (discussed in Section 6.1 and Table 1). Hence, we restrict ourselves to velocities16 km s−1and temperatures<2000 K, as tempera-tures above this will lead to elemental vaporization that can potentially alterthe chemical composition, losing our under-standing on the precursors composition(Table1). It should be noted that the present work does not consider the atmospheric fragmentation of a particle during entry(Lal & Jull 2002).
5. MICROMETEORITE CHEMICAL COMPOSITION
Table 1
The Percent of Mass Ablated for Various Sizes, Zenith Angles, and Entry Velocities
Entry Velocity(km s−1) Percent of Mass Ablated
Size(μm) ZA=0° 10° 20° 30° 40° 50° 60° 70° 80° 90°
11 100 1 1 0 0 0 0 0 0 0 0
200 3 3 3 2 2 1 1 0 0 0
300 16 15 13 10 7 4 2 0 0 0
400 33 32 29 25 18 11 5 0 0 0
16 100 22 21 18 14 9 5 2 1 0 0
200 76 75 72 67 59 45 26 8 0 0
300 93 93 92 89 85 77 62 35 0 0
400 96 95 95 95 94 90 80 58 0 0
21 100 90 89 87 83 76 64 43 14 0 0
200 97 97 97 96 96 95 91 71 0 0
300 97 97 97 97 97 97 96 93 0 0
400 98 98 98 97 97 97 97 96 0 0
26 100 97 97 97 97 96 95 92 72 16 0
200 97 97 97 97 97 98 97 96 77 0
300 98 98 98 98 98 97 97 97 95 0
400 98 98 98 98 98 98 97 97 96 0
31 100 98 98 98 99 98 98 97 95 65 0
200 98 98 98 98 98 97 97 98 96 0
300 98 98 98 98 98 98 98 97 97 0
400 98 98 98 98 98 98 98 98 98 0
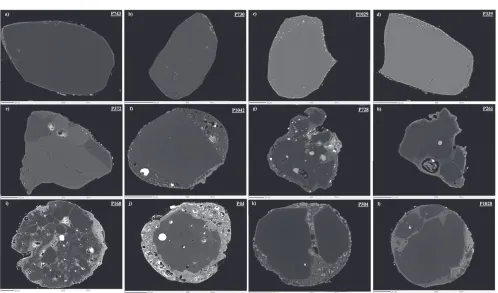
[image:3.612.58.556.362.655.2]spherules, there were 11 particles thatcan be classified as unmelted micrometeorites. The remaining micrometeorites are classified as follows: 42 are relict-grain bearing, 57 are scoriaceous, 355 are porphyritic, 137 are barred, 119 are cryptocrystalline 371 are glass, 18 are I-type spherules, and 23 are G-type spherules. Among the porphyritic, a large number of spherules had relict grains with sizes >50μm,
[image:4.612.46.571.79.653.2]indicative of preservation during atmospheric entry. Olivine is the most abundant relict mineral, dominated by a fosteritic composition; however, some minor minerals such as pyroxene, spinel, and plagioclase are also found. Figure 1 shows representative BSE images of the unmelted and relict-bearing micrometeorites. Figures1(a)–(d)are unmelted single mineral grains with uniform chemical composition. Figure 1(e) is an Table 2
Bulk Chemical Composition(wt%)of Unmelted and Relict-bearing Micrometeorites
Micrometeorites Na2O MgO Al2O3 SiO2 CaO Cr2O3 MnO FeO CoO NiO Total
(a)Unmelted
P339 K 34.9 K 37.6 0.2 0.3 0.7 24.1 K K 97.8
P46 0.1 33.8 1.1 39.1 0.7 0.3 0.4 23.9 K 0.3 99.7
P561 0.8 30.9 1.5 47.4 1.2 0.5 0.7 12.9 K K 96.3
P730 K 41.7 K 38.8 K K 0.4 18.2 K K 99.2
P743 K 53.7 0.1 41.7 0.2 0.3 0.1 2.3 K K 98.6
P1029 0.1 30.3 0.7 37.2 0.7 0.3 0.4 28.3 K 0.1 98.0
P1042 K 26.5 0.4 34.5 0.5 0.3 0.3 34.1 0.1 0.4 97.1
P29 0.8 26.2 5.7 45.7 3.7 0.5 0.8 14.7 K 0.1 98.3
P261 K 43.3 2.4 46.8 1.7 0.5 0.1 3.7 K 0.2 98.8
P372 1.5 25.0 4.5 52.8 0.9 0.1 0.3 9.7 K K 95.2
P727 0.1 29.6 0.2 36.0 0.4 0.2 0.5 32.1 K 0.1 99.1
(b)Relict-bearing
P44 K 32.9 1.5 44.0 1.0 0.5 0.2 18.3 K 0.1 98.6
P59 K 34.1 1.3 36.8 1.7 0.3 0.2 23.6 K 0.6 98.6
P88 K 39.4 1.3 45.0 0.5 0.4 0.2 11.2 K 0.4 98.4
P95 0.2 26.7 1.3 36.8 1.5 0.4 0.3 28.0 K 0.2 95.4
P106 0.1 23.0 0.6 52.1 0.7 0.5 0.6 19.7 K 0.1 97.5
P108 0.1 27.7 1.6 43.6 1.2 0.5 0.4 19.6 K 1.2 96.0
P109 0.1 27.0 1.2 40.5 1.6 0.7 0.2 23.0 K 0.6 95.0
P128 0.9 27.9 4.0 55.1 2.2 0.6 0.4 6.7 K 0.1 98.1
P160 0.3 37.2 2.8 44.4 1.6 0.7 0.2 9.4 K 0.3 96.8
P167 K 29.6 1.2 41.2 1.1 0.6 0.5 23.5 K 0.1 97.9
P220 0.5 22.8 3.6 42.9 3.6 0.3 0.3 23.4 K 0.2 97.7
P251 1.0 27.8 2.0 57.7 1.4 0.5 0.4 6.9 K K 98.0
P302 K 30.3 1.3 44.4 1.2 0.5 0.5 18.3 K 0.1 96.8
P304 0.3 25.3 1.6 37.1 1.5 0.6 0.4 29.4 K 0.1 96.4
P351 K 33.4 0.8 37.7 0.7 0.3 0.3 24.4 K K 97.7
P363 0.2 31.1 2.1 46.4 1.7 0.4 0.2 13.4 K 0.5 96.0
P392 K 55.4 0.1 40.1 0.4 0.2 0.1 0.9 K K 97.4
P408 K 26.2 3.5 35.0 4.0 0.3 0.2 27.1 0.1 0.1 96.5
P415 0.1 23.8 3.8 43.9 3.8 0.4 0.6 20.3 K 0.1 96.8
P419 0.1 28.9 3.7 44.4 2.8 0.3 0.4 17.4 K 0.2 98.3
P504 K 34.3 0.6 36.7 0.7 0.4 0.7 24.9 K 0.1 98.4
P522 K 51.1 0.5 41.6 1.4 0.2 0.2 3.4 K 0.2 98.5
P541 0.2 30.4 1.7 39.4 1.4 0.2 0.5 22.7 0.1 0.3 96.9
P544 K 33.6 1.8 38.8 1.4 0.2 0.2 22.0 K 1.0 99.1
P586 K 24.9 1.4 49.8 1.1 0.5 0.4 18.7 0.1 0.5 97.4
P607 K 34.7 1.8 45.9 1.5 0.4 0.2 12.8 K 0.3 97.6
P627 0.1 30.9 1.7 49.1 3.2 0.4 0.2 11.0 K 0.5 97.2
P645 0.2 34.2 1.0 40.5 3.3 0.0 0.3 15.3 K 0.1 95.2
P668 K 27.2 2.3 38.3 2.3 0.4 0.2 26.8 K 0.4 98.0
P700 0.4 26.1 2.0 37.6 1.5 0.2 0.4 29.3 K 0.3 97.8
P703 0.5 27.1 1.7 36.6 1.3 0.3 0.4 30.0 K 0.1 98.1
P710 K 33.2 1.7 37.9 1.6 0.1 0.2 22.4 K 0.5 97.7
P721 0.4 29.9 2.1 43.6 2.0 0.3 0.5 19.7 K 0.1 98.7
P728 K 44.1 1.1 45.3 0.6 0.5 0.2 6.8 K 0.1 98.7
P791 1.9 22.1 2.1 43.6 1.6 0.2 0.6 25.4 K K 97.7
P913 0.2 28.0 0.7 50.9 0.9 0.2 0.4 16.8 K K 98.1
P930 0.1 31.9 0.4 38.0 0.6 0.2 0.3 28.0 K 0.1 99.6
P931 K 42.0 0.2 38.9 0.2 0.3 0.9 16.3 K 0.1 98.9
P939 K 43.3 1.8 46.1 1.2 0.5 0.3 4.5 K 0.2 98.1
P1028 K 30.4 1.5 37.1 1.4 0.3 0.5 24.4 K K 95.7
P1162 0.5 32.9 1.4 49.2 1.0 0.3 0.3 10.2 K 0.9 96.7
example of a multiple mineral micrometeorite. Figures1(f)–(h) are micrometeorites that experienced partial heating during atmospheric entry, but largely preserved their relict mineral compositions. P160 shows the presence of a large number of Mg-rich fosterites along with pyroxenes (Figure 1(i)). Large relict-grain bearing micrometeorites are seen in Figures1(j)–(l). Table 2 lists the bulk chemical composition for the unmelted and relict-bearing micrometeorites. The unmelted microme-teorites should preserve chemical compositions similar to those of their parent bodies. Spinel is one the refractory minerals that is rarely found in micrometeorites, though commonly found in calcium aluminum-rich inclusions (CAIs). Previously, some evidence of spinel earlier in micrometeorites/cosmic spherules has been reported (Taylor et al. 2008, 2012). In the present study, spinels were observed in four spherules, whose BSE images are shown in Figure2and chemical composition listed in Table3.
Multiple analyses by electron microprobe on different phases and compositions are helpful in finding the bulk chemical composition of micrometeorites. The Lispix software program
[image:5.612.118.495.52.339.2](http://www.nist.gov/lispix/)produces phase images where a modal proportion of the volume is calculated (Berlin 2009). This method to determine the bulk chemical composition is more accurate than a simple average of electron microprobe data, or the defocussed beam technique where the broad beam frequently hits a void space or vesicle, leading to low total counts of chemical composition. The bulk chemical composi-tions of the cosmic spherules are similar to those found in the deep sea sediments and polar regions(Brownlee et al.1997; Taylor et al. 2000; Rudraswami et al. 2012, 2014, 2015; Prasad et al.2013). The depletion of volatile elements such as Na and S, followed by Fe, is evident during atmospheric heating. A plot of Ca/Si versus Al/Si follows along the solar composition line (Figure 3). The glass, barred olivine, and Figure 2. Four spinel-bearing micrometeorites. Micrometeorites P583 and P440 have also been reported earlier by Taylor et al.(2008, 2012). The chemical compositions of the spinel and the relict minerals of the micrometeorites are given in Table3.
Table 3
Chemical Composition(wt%)of Spinel Found in Micrometeorites
Micro-meteorites Na2O MgO Al2O3 SiO2 CaO TiO2 Cr2O3 MnO FeO CoO NiO Total
P522
Sp1 K 26.7 66.4 0.1 K K 1.2 K 0.8 0.1 K 95.3
P583
Sp1 K 23.1 55.5 6.9 1.5 0.0 0.2 K 11.4 K 0.1 98.9
P440
Sp1 K 25.1 60.4 5.1 1.9 0.1 0.3 0.1 5.4 K K 98.3
Sp2 K 27.5 69.3 0.1 0.3 0.1 0.3 K 0.8 K 0.1 98.5
Sp3 K 25.9 62.5 2.7 1.1 0.1 0.5 K 5.0 K 0.1 97.9
P392
Sp1 K 30.5 57.1 6.2 0.1 0.0 1.4 0.1 1.6 K K 97.0
cryptocrystalline spherules are essentially close to the solar line; however, there is some spread in other micrometeorites
(e.g., scoriaceous and porphyritic). The Mg/Si ratios exhibit a spread from 0.5–1.5(Figure4(a)), although dominated by the CI composition ratio irrespective of the type of micrometeorite. The same behavior of Mg/Si is also seen in the case of the deep sea spherules(Brownlee et al.1997; Prasad et al.2013). Fe is more volatile than Mg (which is bound in the melt as a stable oxide), and its faster evaporation causes a much greater spread in the Fe/Si ratio (Figure 4(b)), in contrast to Mg/Si. The Fe/Si is spread much lower than the CI value. The peak at Fe/Si >2 is due to the Fe-rich composition in Scoriaceous, porphyritic, cryptocrystalline, and barred micrometeorites. The behavior of Fe/Si is slightly different in the deep sea spherules, likely because of a magnetic bias in the collection that causes the collected spherules to be richer in Fe(Brownlee et al.1997).
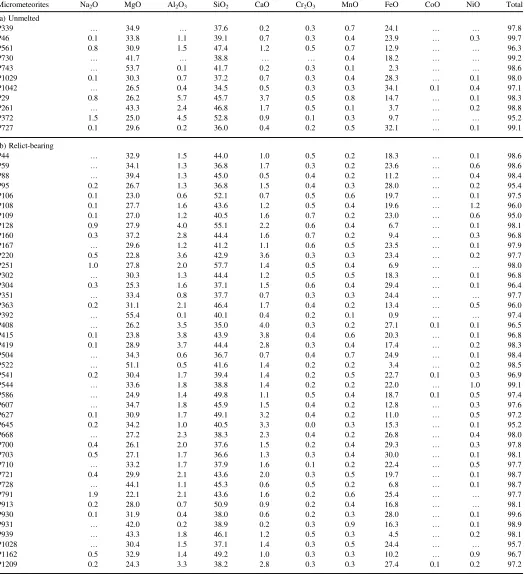
The Al/Si(Figure4(c))and Ca/Si(Figure4(d))ratios are in good agreement with their CI values, unlike Fe/Si. Si is more volatile than Ca and Al, leading to the depletion of Si during entry (Hashimoto 1983; Vondrak et al. 2008) and a second peak of Al/Si and Ca/Si. The Mg–Fe–Si ternary diagram
(Figure5)for 1110 micrometeorites(excluding G-type)along with the trend of extraterrestrial particles and terrestrial particles suggests that different types of collections from the deep sea, Antarctica, or Greenland have similar chemical composition ranges(Brownlee et al.1997; Taylor et al.2000; Rochette et al.2008).
6. DISCUSSION
6.1. Chemical Variation of Particles during Atmospheric Entry
The present study focuses on understanding the changes in the elemental composition of the incoming particles as a function of size, ZA, and velocity. Here we examine the major elements such as Si, Mg, Fe, Ca, and Al which contribute more than 90% of the particle mass (along with O). For the present, the parameters considered will be discussed in Section 6.3. For example, considering the above constraints, for the minimum entry velocity of ∼11 km s−1, ZA∼0°, and particle size ∼100μm, the peak temperature achieved is
∼1700 K where the percent of ablation is close to ∼1%. This
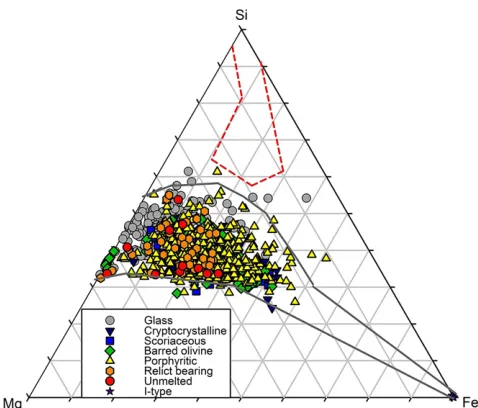
percent of mass ablation and the peak temperatures achieved by the particles increases rapidly, primarily with entry velocity and ZA, but also as a function of the mass of the incoming particle. For two ZAs of 45°and 60°with different velocities and sizes, it can be seen in Figure6that the peak temperature of the particles exceeds 2000 K even for 200μm particles at velocities greater than 16 km s−1. The particles that have crossed 2000 K have greater chances to undergo large-scale changes in chemical composition by vaporization of elements, thereby losing distinctive features of the precursors (Love & Brownlee1991).
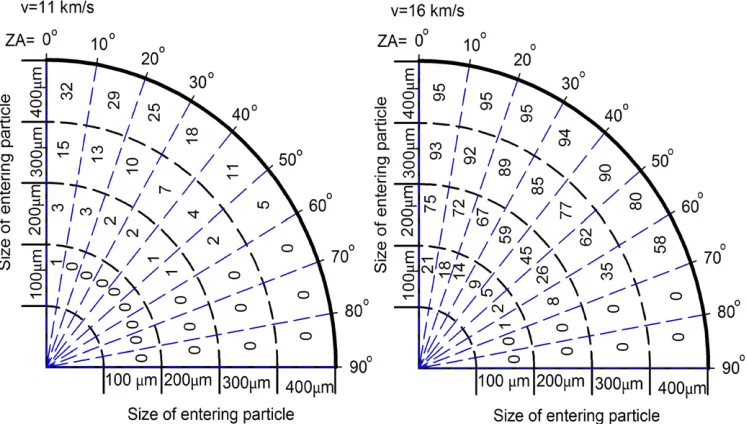
At an entry velocity of 11 km s−1, a large mass of the particles is preserved irrespective of ZA with maximum∼30% ablation (Table 1). However, as the entry velocity increases, ablation increases for all ZA apart from near-horizontal entry where ZA = 80°–90° (Figure 7 and Table 1). The survival chancesof the particles without any disturbance are highest for those that enter in the narrow window of ZA=80°–90°and entry velocity<21 km s−1. This is true for ZA 60°–90°and an entry velocity 11 km s−1(Figure6and Table1). Almost 50% of the micrometeorites collected from the Greenland ice cap are unmelted, especially those in the size range of 50–10φ μm
(Maurette et al.1987). Yada et al.(2004)found that nearly 60% of the particles collected around the Yamato Mountains in Antarctica are unmelted, while the remaining are cosmic spherules. The SPWW micrometeorite collection also found that roughly half of the particles collected were unmelted in the size range of 50–10φ μm(Taylor et al.2007b). The Antarctic and Greenland Ice collections therefore suggest that unmelted micrometeorites and melted spherules are approximately equal in number, unlike deep sea spherules(Taylor & Brownlee1991; Brownlee et al. 1997; Rudraswami et al. 2012; Prasad et al.2013). There is a narrow zone of ZA and velocity that will allow a meteoroid with a diameter greater than 100μm to enter the atmosphere without melting and altering the mineralogical features or texture: ZA = 80°–90° and entry velocity<21 km s−1. The ZA 80°–90°is the zone where nearly 50% of the total recovered particles with sizes greater than 100μm reaches the Earth’s surface survive ablation and are well preserved. However, if the velocity of the entering particle is∼11 km s−1, then ZA 60°–90°is the minimum ablation zone for any size less than few hundred microns across as sputtering will always also occur in unmelted particles.
The elemental changes that the particles undergo are observed largely in Mg, Fe, and Si, which contribute more than 90% of the particle mass in the oxide form as the major silicate minerals, followed by the refractory elements Ca and Al. Fe is the most volatile of these elements(after Na and K) and after particle melting contributes most to the ablative loss, followed by Si and Mg, while there is no major ablation of Ca and Al (Figure 8). For example, for a ZA = 45°, diameter
∼200μm, and entry velocity ∼16 km s−1, Fe decreases from 28 wt% to <8 wt% by the time at the particle descends to 70 km altitude, while the loss in Fe results in the enrichment of Mg and Si from∼15% and 16% to 25% and 19%, respectively
[image:6.612.48.289.54.222.2](Figure 9). The jogs in Figure 9 are the regions where the ablation begins to occur at the altitude of 95–101 km. Thefirst element to be ablated is Na followed by K. As a result, the particle loses mass, but not of Mg, Si, or Fe, so there seems to be a slight enrichment of these elements compared to their initial composition. For any given size, a smaller ZA and larger Figure 3.Ca/Si vs. Al/Si for different types of micrometeorites collected from
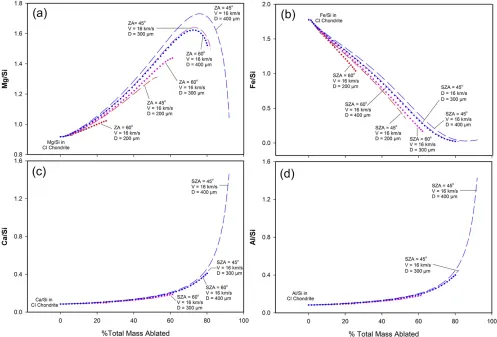
velocity give rise to a greater fraction of mass loss through elemental ablation(Table1). As the ablative fraction increases, the Fe/Si ratio decreases: 20% ablation results in a 33% decrease of the Fe/Si ratio, and once ablation is higher than 70% the particle has lost more than 90% of its Fe
(Figure 10(b)). The Mg/Si ratios (Figure 10(a)) exhibit a reverse trend compared to Fe/Si. The Mg/Si ratios increase with mass ablation until 80% of the mass is gone, at which point the ratio decreases. There is little change in the Mg/Si ratio up to ∼20% ablation. A higher degree of ablation will potentially alter the mineralogical composition due to the loss of Fe followed by Si and Mg. In contrast, the refractory elements such as Ca and Al do not evaporate significantly even after 50% ablation, at which point Si evaporation causes a substantial increase in the Ca/Si ratio(Figure10(c)). The Al/Si ratio behaves in a similar way (Figure 10(d)). The slow vaporization of Ca and Al can be useful for identifying the precursors from Ca/Si and Al/Si ratios. The disadvantage is the difficulty involved in considering the chemical composition of the particle that does not represent the bulk mineralogical of the precursors. Small fragments of dust generated by disruption during asteroidal collisions may be of an individual mineral or group of minerals and far from the bulk mineralogical composition of the parent bodies.
[image:7.612.65.557.53.402.2]Various methods to determine the mass accretion of extraterrestrial particles has provided a wide range of estimates
Figure 4.Histogram plot of the elemental ratio for different types of micrometeorites collected from the South Pole Water Well(SPWW):(a)Mg/Si,(b)Fe/Si,(c) Ca/Si, and(d)Al/Si. The dashed vertical line is the CI composition(Lodders & Fegley1998). The peaks of Mg/Si, Ca/Si,and Al/Si are similar to the CI composition, besides Fe/Si which exhibits a large spread.
Figure 5.Ternary diagram representing Mg–Si–Fe(atoms)of different types
(unmelted: 11, relict-bearing: 42, scoriaceous: 57, porphyritic: 355, crypto-crystalline: 119, barred olivine: 137, glass: 371, I-type: 18)of micrometeorites
[image:7.612.323.562.466.670.2](Plane 2012). The analysis of micro-impact craters on the space-facing side of the Long duration exposure facility
(LDEF) satellite at an altitude of 350–480 km constrains the total accreted mass to be 30,000 t yr−1with a large uncertainty of±20,000 t yr−1; however, this estimate requires an assumed velocity distribution of the particles (Love & Brownlee1993; Taylor et al. 1998). Os isotopes studies in marine sediments have indicated an accretion rate of 30,000±15,000 tons yr−1 which is similar to that of the LDEF satellite estimate( Peucker-Ehrenbrink & Ravizza 2000). The accumulation of Ir, Pt, and super-paramagnetic Fe particles in polar ice cores also imply a large dust flux of at least 36,000 t yr−1(Gabrielli et al. 2004; Lanci et al. 2007). In contrast, the sampling of cosmic spherules from the SPWW gave an estimate of 2700±1400 t yr−1(Taylor et al.1998). The accretion rate of micrometeorites in blue ice was estimated to be 16,000±9000 t yr−1, based on the collective analyses of handpicked particles and noble gas measurements done of the residual particles (Yada et al. 2004). The Greenland ice micrometeorite collection yields an estimate of ∼4000 t yr−1
(Maurette et al. 1987). The mass accretion rate estimated by counting cosmic spherules in deep sea sediments yielded a low estimate, as most of the fragile particles seemto get destroyed in the harsh environment (Prasad et al. 2013). Each of these estimation techniques depends on various assumptions and is then scaled up to provide the global input(Plane2012). In any case, a significant fraction of the meteoroid flux entering the atmosphere ablates. The resulting metal vapours then oxidize
and polymerize to form meteoric smoke particles (Plane et al.2015), which is the major form of extraterrestrial material sampled in ice cores. For meteoroids with ZA= 0°–50° and velocity >16 km s−1, at least 70% of the particle mass is vaporized during entry. However, for an entry velocity <21 km s−1and ZA=50°–70°, a particle will melt and form a cosmic spherule (such as porphyritic, barred, cryptocrystal-line, glass). ZA = 70°–80°is the zone where relict-grain-bearing, scoriaceous spherules are partially heated and transported to the Earthʼs surface. As discussed earlier, unmelted micrometeorites have a very narrow window of ZA = 80°–90° for velocity ∼16–21 km s−1, or 60°–90° for
∼11 km s−1.
6.2. Micrometeorites and Their Likely Precursors
The mineralogy of the micrometeorites is important for gaining information on the precursors from which they originated. CABMOD is useful to some extent for extrapolat-ing from the micrometeorite back to the original mass and the nature of the meteoroid from which it formed. As shown in the ternary diagram(Figure5), the micrometeorites in the present study fall within the limit of the extraterrestrial line, similar to those seen in other studies of Antarctic micrometeorite collections obtained either by melting ice or traps (Taylor et al. 2000; Rochette et al. 2008). The diffusion and evaporation rate of elemental Fe is much faster than that of Mg (Hashimoto 1983), which explains the occurrence of magnetite rims formed on micrometeorites during atmospheric entry. A thin Fe-rich rim is common even on unmelted particles or single minerals, suggesting that Fe fractionating in particles takes places even at relatively low temperatures. The spread in the Fe/Si ratio in Figure 4(b) suggests that the process of diffusion or evaporation of Fe leads to the rapid depletion of Fe/Si, since there are a comparatively small number of micrometeorites near the CI value. An additional reason may be because of a large precursor that is dominated by chondrules that have low Fe/Si values.
The Mg/Si values are largely close to the CI chondrite value
[image:8.612.49.291.52.374.2](∼0.8–1.0), within the analytical error involved in estimating the bulk chemical composition of the micrometeorites. The number of micrometeorites studied here makes them appro-priate for statistical interpretation. Nearly 65% of the micro-meteorites from the present study have Mg/Si values ranging from 0.8 to 1.0, irrespective of the texture or type. CABMOD suggests that the range will have20% of ablation for an entry velocity less than 16 km s−1and ZA greater than 45°marked as region I in Figure 11. For other lower velocities and similar ZA, the ablation is much less than 20% and close to CI values and fall in region I. On the other hand, 20% of micrometeorites have bulk Mg/Si in the range of 1.0–1.4 have ablation from 20%–60% suggesting large alteration during the entry(marked as region II in Figure11). Above this range the ablation is very high with large-scale vaporization of Fe and Si, and any particle that has large dimension may not be able to retrievable as a micrometeorite on the Earthʼs surface(marked as region III in Figure11). For velocity 11 km s−1, the ablation is less than 20% and will lie in region I. However,∼15% of particles that do not fall in these three regions are those with bulk Mg/Si values that range between∼0.6 and 0.8. It should be noted that the Mg/Si ratio becomes enriched during heating due to Si evaporation which is much faster than Mg. A Mg/Si ratio between∼0.6 and 0.8 therefore suggests a different precursor Figure 6.Distribution of temperature for different sizes of entry particles over a
from carbonaceous chondrites, such as ordinary chondrites that have Mg/Si values of∼0.8, EH∼0.6 and EL∼0.7(Lodders & Fegley 1998). Thus, it appears that ∼15% of the total particle that survive entry have a provenance to ordinary or enstatite chondrites, while ∼85% are related to carbonaceous chondrites. Among all global collections of cosmic dust
(Taylor et al. 2000,2007a; Prasad et al. 2013), it is seen that a majority of the particles are sourced either from CI or CM chondrites, which can be distinguished from ordinary chon-drites (Brownlee et al. 1997). Engrand & Maurette (1998)
suggested that up to 99% of the particulate flux of cosmic matter is dominated by either carbonaceous or cometary bodies, which is especially true for unmelted particles. The CI and the CM chondrites are more porous and hydrated andfragment easily during asteroidal collisions and produce greater quantities of dust-sized materials (Tomeoka et al. 2003) that stream into the inner solar system. The anhydrous meteorites
(ordinary chondrites and others) have greater tensile strengths
and do not break down that easily into the smallest particles during comminution in the asteroid belt, therefore, their presence is not dominant among micrometeorites. On the basis of their elemental ratios and textures, the micrometeorites analysed in the present investigation also suggest a dominant contribution from carbonaceous chondrites.
6.3. Precursors for Refractory Minerals
[image:9.612.120.493.54.266.2]The spinels are refractory minerals with melting tempera-tures above 2000 K. In the present study only four micro-meteorites contain spinels, which are occasionally found in the CAIs of carbonaceous chondrites. The oxygen isotope composition of the spinels in the Antarctic micrometeorites shows they are16O-rich, similar to those found in CAIs, which suggests refractory inclusion (Taylor et al. 2012). P219 is nearly pure anorthitic in composition (An90–94), with few chromite grains enclosed. These types of anorthitic-rich spherules could have originated from the CAIs of CV, CO, Figure 7.Percentage ablation for different particle sizes and ZAsat entry velocities of 11 and 16 km s−1. Note that unmelted particles have a narrow zone of ZA at 16 km s−1, which broadens at 11 km s−1. The number indicated is the percentage ablation (e.g., ablation is 95% for ZA = 0°, velocity= 16 km s−1, and
[image:9.612.47.288.314.488.2]size=400μm.
Figure 8.Contribution of individual elements to the percentage mass ablated. Fe ablates more rapidly than Si and Mg, thereby contributing more to the total mass ablated. The contribution from refractory elements Ca and Al is very low.
Figure 9.Change in elemental percent vs. altitude. At 80 km the ablation of a 200μm particle at ZA 45°and entry velocity 16 km s−1is fast; the resulting loss
[image:9.612.322.564.314.487.2]CH, and CR chondrites (Krot & Keil 2002). The number of micrometeorites with a CAI component is less than 0.5%, which is far from the CM, CO, CV, and CK chondrites which have ∼1.2%, 1.0%, and 3.0% modal abundances (Hezel et al.2008). One of the primary reasons for a poor contribution
from refractory minerals toward theflux of micrometeorites is the very fluffy nature: the loosely packed assemblage with a large void space easily disintegrates during collisions either in the asteroidal belt or during atmospheric entry (Lal & Jull 2002). Only fragments that have similar mineral assem-blages have a greater chance of survival.
7. CONCLUSIONS
A CABMOD has been used to evaluate the effect of meteoroid size, velocity, and ZA on the degree of ablation and chemical variation of particles entering the atmosphere. We describe the analyses of 1133 micrometeorites collected from the SPWW. We predict, based on the measured Mg/Si ratios of the micrometeorites and the CABMOD analysis, that∼15% of recovered samples are either ordinary or enstatite chondrites as precursors, while the rest have a carbonaceous chondritic origin. The unmelted micrometeorites that contribute half of the totalflux that reaches Earthʼs surface have a very narrow ZA of 60°–90° and 80°–90° for entry velocity ∼11 and >11–21 km s−1. In spite of the fact that the micrometeorites recovered on the surface have often undergone large-scale alteration during entry, a significant number of micrometeorites
[image:10.612.57.554.53.390.2](∼65%) have Mg/Si ratios ∼0.8–1.0, suggesting modest ablation of less than 20%, while another 20% of the particles have undergone 20%–60% ablation. This quantification of ablation is important for estimating the micrometeorite precursor sizes andflux.
Figure 10.Change in elemental ratio with respect to the percent of mass ablatedfor particles of various diameters, ZAs, and entry velocities:(a)Mg/Si,(b)Fe/Si,(c) Ca/Si, and(d)Al/Si.
Figure 11. Variation of the Mg/Si ratio with percent of mass ablatedfor different ZA at velocities= 11 and 16 km s−1. The variation Mg/Si in the 0.8–1.0 range, combined with the histogram plot of Figure4, suggests that
∼65% of the particles undergo∼20% ablation(region I). Mg/Si∼1.0–1.4 suggests that∼20% of particles undergo 20%–60% ablation(region II). Only 3% of particles thatundergo more than 60% ablation survive atmospheric entry
[image:10.612.50.290.428.600.2]This work is supported by the CSIR XII Plan funded Project GEOSINKS and the PLANEX project, Physical Research Laboratory, Ahmedabad (N.G.R. and M.S.P.). This is NIOʼs contribution No. 5823. The work at the University of Leeds is supported by the European Research Council (project number 291332—CODITA).
REFERENCES
Berlin, J. 2009, PhD thesis, Univ. New Mexico
Blanchard, M. B., Brownlee, D. E., Bunch, T. E., Hodge, P. W., & Kyte, F. T. 1980,EPSL,46, 178
Brownlee, D. E. 2001, in Acretion of Extraterrestrial Matter Throughout Earthʼs History, ed. B. Peucker-Ehrenbrink & B. Schmitz (New York: Kluwer/Plenum)
Brownlee, D. E., Bates, B., & Schramm, L. 1997,M&PS,32, 157
Dermott, S. F., Jayaraman, S., Xu, Y. L., Grogan, K., & Gustafson, B. A. S. 1996, in AIP Conf. Proc. 348, The Origin and Dynamics of the Interplanetary Dust Cloud(Melville, NY: AIP),25
Dermott, S. F., Jayaraman, S., Xu, Y. L., Gustafson, B. A. S., & Liou, J. C. 1994,Natur,369, 719
Engrand, C., & Maurette, M. 1998,M&PS,33, 565
Flynn, G. J. 1989a, LPSC,19, 673
Flynn, G. J. 1989b,Icar,77, 287
Fraundorf, P. 1980,GRL,7, 765
Gabrielli, P., Barbante, C., Plane, J. M. C., et al. 2004,Natur,432, 1011
Genge, M. J., Engrand, C., Gounelle, M., & Taylor, S. 2008, M&PS,
43, 497
Gounelle, M., Chaussidon, M., Morbidelli, A., et al. 2009,PNAS,106, 6904
Hashimoto, A. 1983,GeocJ, 17, 111
Hezel, D. C., Russell, S. S., Ross, A. J., & Kearsley, A. T. 2008,M&PS,43, 1879
Kortenkamp, S. J., & Dermott, S. F. 1998,Icar,135, 469
Kortenkamp, S. J., Dermott, S. F., Fogle, D., & Grogan, K. 2001, in Acretion of Extraterrestrial Matter Throughout Earthʼs History, ed. B. Peucker-Ehrenbrink & B. Schmitz(New York: Kluwer/Plenum) Krot, A. N., & keil, K. 2002,M&PS,37, 91
Lal, D., & Jull, A. J. T. 2002,ApJ,576, 1090
Lanci, L., Kent, D. V., & Biscaye, P. E. 2007,GRL,34, L10803
Lodders, K., & Fegley, B., Jr. 1998, The Planetary Scientistʼs Companion
(New York: Oxford Univ. Press)
Love, S. G., & Brownlee, D. E. 1991,Icar,89, 26
Love, S. G., & Brownlee, D. E. 1993,Sci,262, 550
Love, S. G., Joswiak, D. J., & Brownlee, D. E. 1994,Icar,111, 227
Mason, B. 1971, Handbook of Elemental Abundances of the Elements in Meteorites(Newark, USA: Gordon and Breach)
Maurette, M., Jéhanno, C., Robin, E., & Hammer, C. 1987,Natur,328, 699
Nesvorný, D., Janches, D., Vokrouhlický, D., et al. 2011,ApJ,743, 129
Nesvorný, D., Jenniskens, P., Levison, H. F., et al. 2010,ApJ,713, 816
Peucker-Ehrenbrink, B., & Ravizza, G. 2000,GCA,64, 1965
Plane, J. M. C. 2012,Chem. Soc. Rev.,41, 6507
Plane, J. M. C., Feng, W., & Dawkins, E. C. M. 2015,ChRv, 115, 4497 Pouchou, J. L., & Pichoir, F. 1991, in Electron Probe Quantification, ed.
K. F. J. Heinrich & D. E. Newbury(New York: Plenum)
Prasad, M. S., Rudraswami, N. G., & Panda, D. K. 2013,JGR, 118, 2381 Reach, W. T., Franz, B. A., & Weiland, J. L. 1997,Icar,127, 461
Rochette, P., Folco, L., Suavet, C., et al. 2008,PNAS,105, 18206
Rudraswami, N. G., Prasad, S. M., Plane, J. M. C., et al. 2014, GCA,
131, 247
Rudraswami, N. G., Shyam Prasad, M., Babu, E. V. S. S. K., et al. 2012,GCA,
99, 110
Rudraswami, N. G., Shyam Prasad, M., Nagashima, K., & Jones, R. H. 2015,
GCA,164, 53
Schaefer, L., & Fegley, B. 2005,EMP, 95, 413
Sears, D. W., & Dodd, R. T. 1988, in Meteorites and the Early Solar System, ed. J. F. Kerridge & M. S. Matthews(Tucson, AZ: Univ. Arizona Press)
Suavet, C., Gattacceca, J., Rochette, P., et al. 2009,JGR,114, B04102
Taylor, S., Alexander, C. M. O’D., & Wengert, S. 2008, LPSC, 39, 1628 Taylor, S., & Brownlee, D. E. 1991, Metic,26, 203
Taylor, S., Herzog, G. F., & Delaney, J. S. 2007a,M&PS,42, 223
Taylor, S., Lever, J. H., & Harvey, R. P. 1998,Natur,392, 899
Taylor, S., Lever, J. H., & Harvey, R. P. 2000,M&PS,35, 651
Taylor, S., Matrajt, G., & Guan, Y. 2012,M&PS,47, 550
Taylor, S., Matrajt, G., Lever, J. H., Joswiak, D. J., & Brownlee, D. E. 2007b, in Workshop on Dust in Planetary Systems, ed. H. Kruger & A. Graps
(ESA SP-643; Paris: ESA),26
Tomeoka, K., Kiriyama, K., Nakamura, K., Yamahana, Y., & Sekine, T. 2003,
Natur,423, 60
Vondrak, T., Plane, J. M. C., Broadley, S., & Janches, D. 2008, ACP,
8, 7015
Yada, T., Nakamura, T., Noguchi, T., et al. 2005,GCA,69, 5789